META Stock Analysis – Have you ever considered the potential outcome had you invested $1,000 in Meta back in 2018? Imagine this scenario: at the onset of 2018, you allocate a modest sum of $1,000 into Meta, previously known as Facebook, a promising tech entity. Fast-forward to February 2024, and that initial investment has surged to a value of $3,708.
This translates to an impressive 271% increase from your initial investment, representing an annual growth rate of 30%. Undoubtedly, a remarkable return on investment.
Now, what factors contributed to this impressive growth? What drove Meta’s financial success?
Today, we explore Meta’s business model, revenue generation, and financial strategies.
In this analysis, we adopt a data-driven approach to comprehend Meta’s financial performance and the key drivers behind its growth.
Meta’s Revenue Analysis – META Stock Analysis
Let’s delve into Meta’s financial standing, starting with its revenue. In 2018, Meta initiated the year with a substantial revenue base. Fast forward to 2023, and the revenue has surged to an impressive $135B.
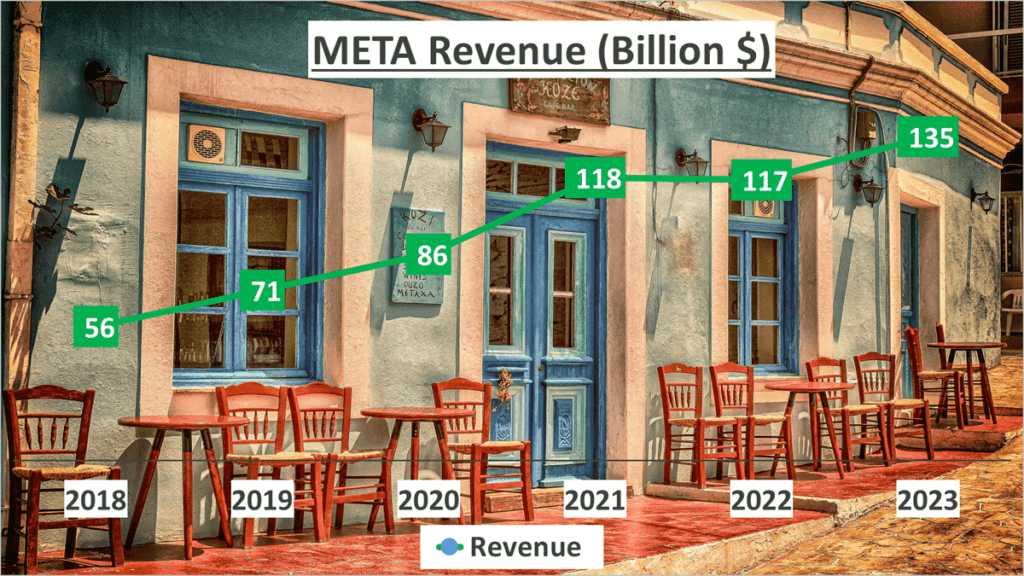
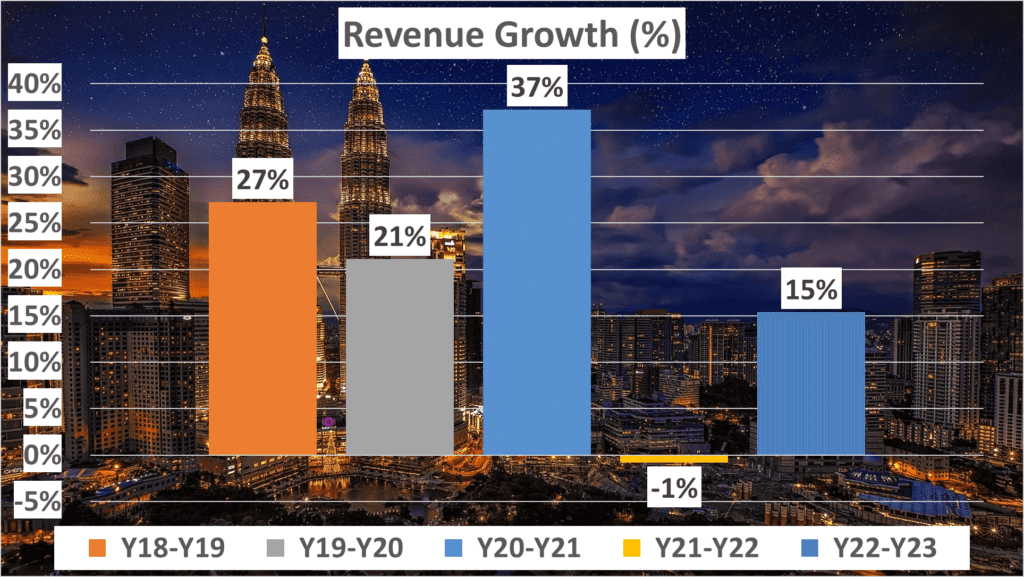
This noteworthy escalation signifies a Compound Annual Growth Rate (CAGR) of 19%. However, this growth wasn’t instantaneous. It resulted from a consistent year-on-year escalation, with increments of 27% between 2018 and 2019, 21% between 2019 and 2020, and a substantial 37% between 2020 and 2021. While there was a slight dip the following year with a 1% decrease, Meta rebounded in 2023 with a revenue growth of 15%.
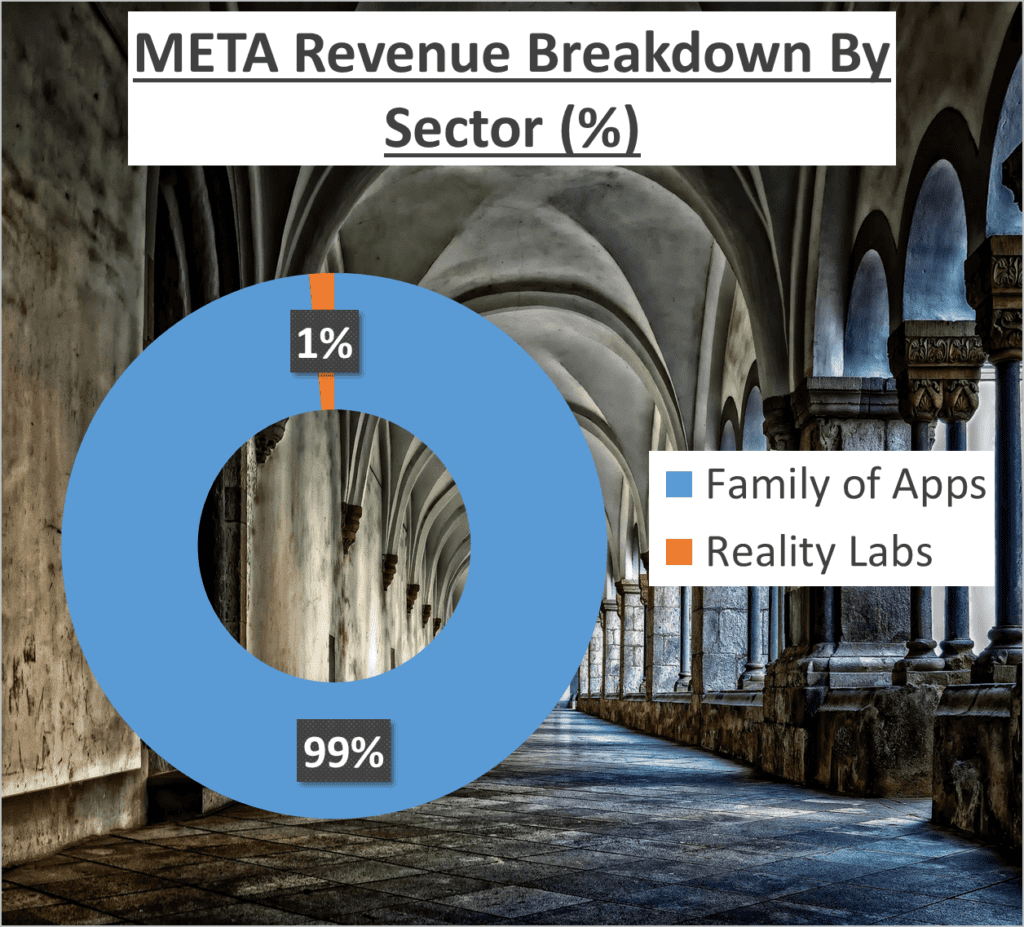
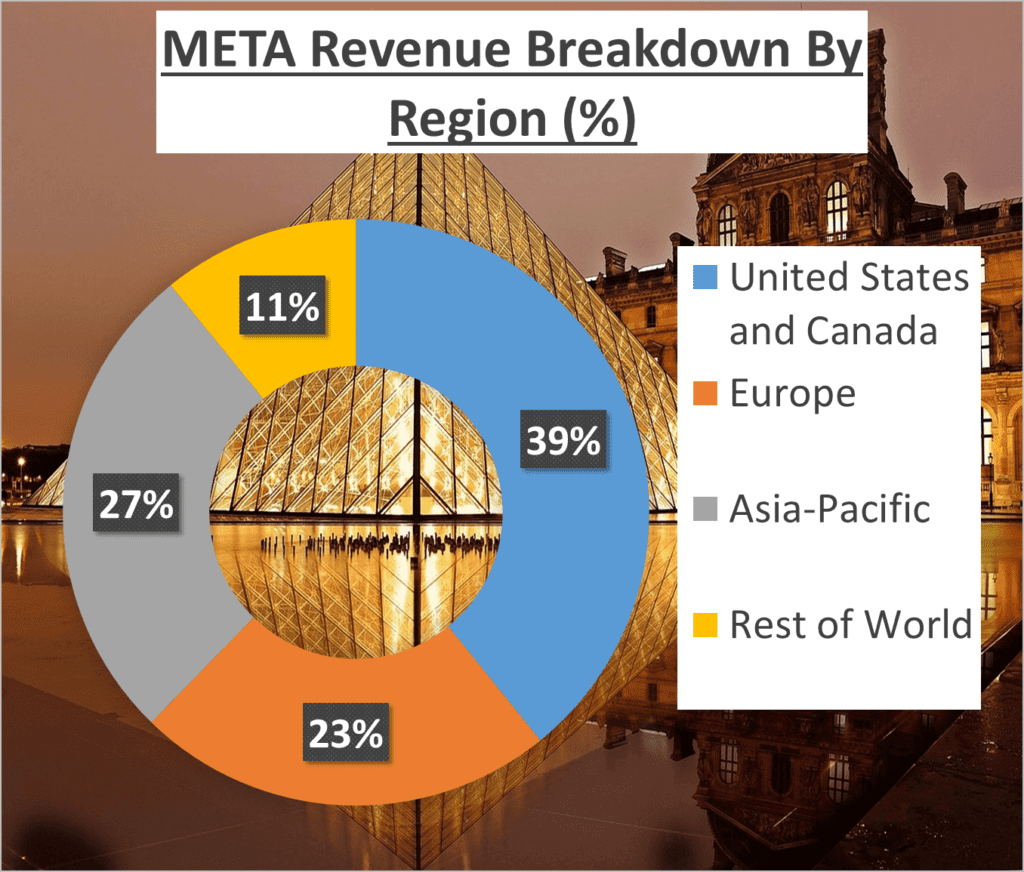
The majority of this revenue, precisely 99%, stems from Meta’s Family of Apps, with the remaining 1% attributed to Reality Labs. Geographically, Meta’s revenue is well-dispersed, with 39% contributed by the United States and Canada, 23% by Europe, 27% by the Asia-Pacific region, and the remaining 11% from other parts of the world.
This consistent revenue growth over the years attests to Meta’s adaptability and innovation in a swiftly evolving digital realm. It reflects Meta’s persistent investment in existing platforms and the development of new technologies to enhance user experience.
Furthermore, Meta’s diverse revenue streams and broad geographical presence mitigate vulnerability to regional economic fluctuations, ensuring stability in revenue growth.
In conclusion, Meta’s consistent revenue growth, sustained high CAGR, and diversified revenue sources indicate robust financial health. These factors position Meta as an enticing investment opportunity for those seeking to bolster their portfolio with a resilient tech stock. Meta’s consistent revenue growth serves as a promising indicator for potential investors.
Meta’s Profit Margin and Net Profit – META Stock Analysis
In our analysis, we will now delve into Meta’s profit margin and net profit, crucial metrics in the business world that provide insights into a company’s financial health and operational efficiency.
In 2023, Meta’s gross profit margin stood strong at 81%, aligning perfectly with its five-year average. This consistent performance underscores Meta’s adeptness at maintaining profitability amidst market fluctuations and changes in the business landscape.
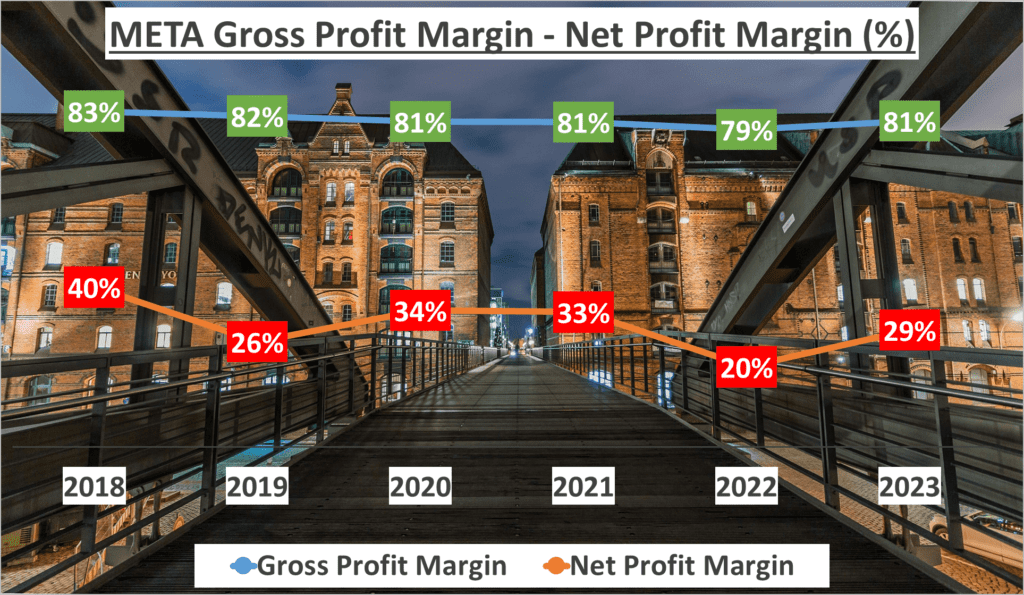
Turning our attention to Meta’s net profit margin, it registered at 29% in 2023, slightly lower than the five-year average of 30%. While this slight deviation may raise concerns, it’s important to recognize that profit margins can fluctuate due to various factors such as heightened competition, shifts in market demand, or regulatory changes.
Despite this, Meta’s net profit in 2023 was an impressive $39B, reflecting a compound annual growth rate of 12% since 2018. This steady growth trajectory speaks volumes about Meta’s consistent profitability and adeptness at generating profit over time.

In conclusion, Meta’s profit margins and net profit demonstrate the company’s ability to effectively manage costs and operations. The stability in Meta’s gross profit margin and the continuous growth in net profit highlight its operational efficiency and financial resilience. A high and steady profit margin is indicative of a company’s proficient management of costs and operations, further solidifying Meta’s position as a strong contender in the market.
Meta’s Assets and Liquidity Ratios – META Stock Analysis
Understanding a company’s assets and liquidity is paramount for any investor. Let’s delve into Meta’s financials.
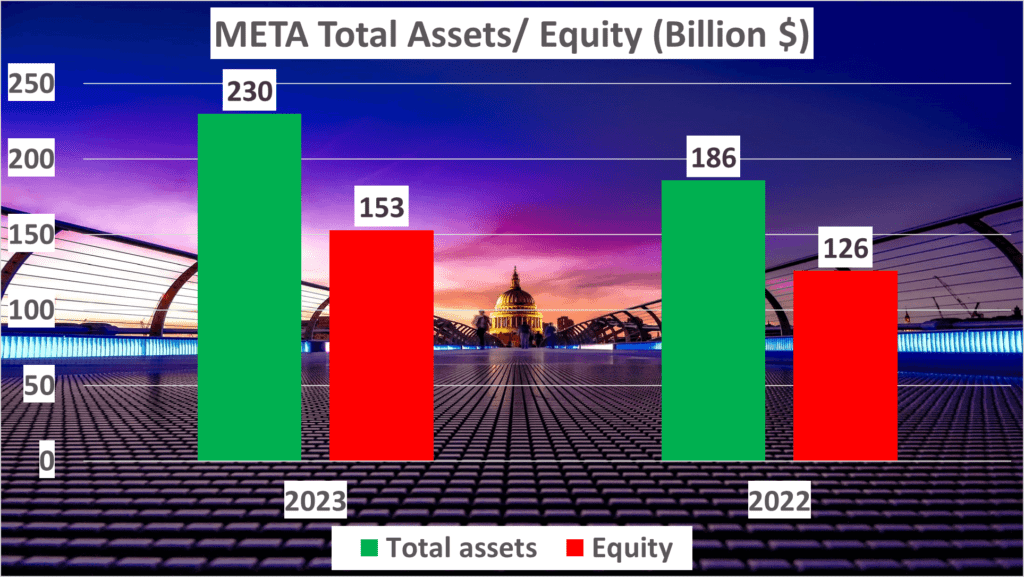
In 2023, Meta’s total assets amounted to an astounding $230B, marking a significant increase from the previous year’s total assets of $186B. As for net assets, in 2023, Meta’s net assets soared to an impressive $153B, a notable rise from $126B in 2022. The equity to total assets ratio for the same year was 67%, slightly lower than the 68% in 2022.
Now, let’s discuss liquidity ratios. The current ratio, measuring a company’s ability to meet short-term and long-term obligations, stood at 2.66 in 2023, up from 2.2 in 2022, indicating Meta’s strong financial capability to fulfill its financial commitments—a positive signal for investors.
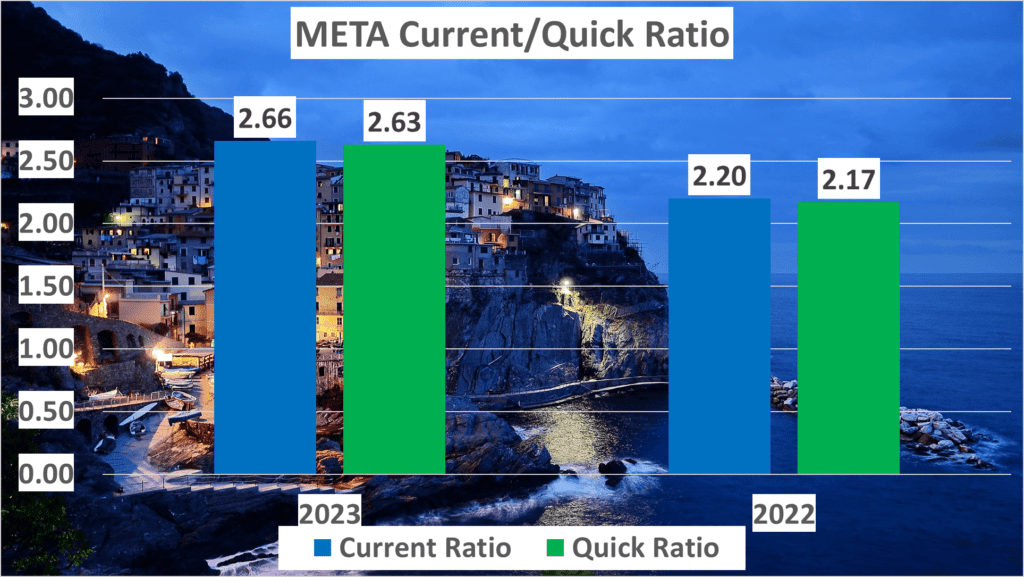
Similarly, the quick ratio, a more stringent measure of liquidity, increased to 2.63 in 2023 from 2.17 in the previous year, further bolstering Meta’s financially robust position.
So, what do these figures signify for Meta? High liquidity ratios, as demonstrated by Meta, indicate the company’s sound short-term financial health. It signifies that Meta possesses adequate resources to cover its short-term debts, crucial for sustaining seamless operations.
In essence, Meta’s solid financial standing, as evidenced by its total and net assets, coupled with its robust liquidity ratios, positions it as a reliable investment choice for investors. It underscores the company’s profit-generating ability and signifies a reduced risk of financial turmoil.
Meta’s strong liquidity ratios affirm its sound short-term financial health, serving as a promising sign for investors and further enhancing Meta’s impressive financial profile.
Meta’s Cash Flow and DuPont Analysis – META Stock Analysis
Let’s now examine Meta’s cash flow and DuPont analysis.
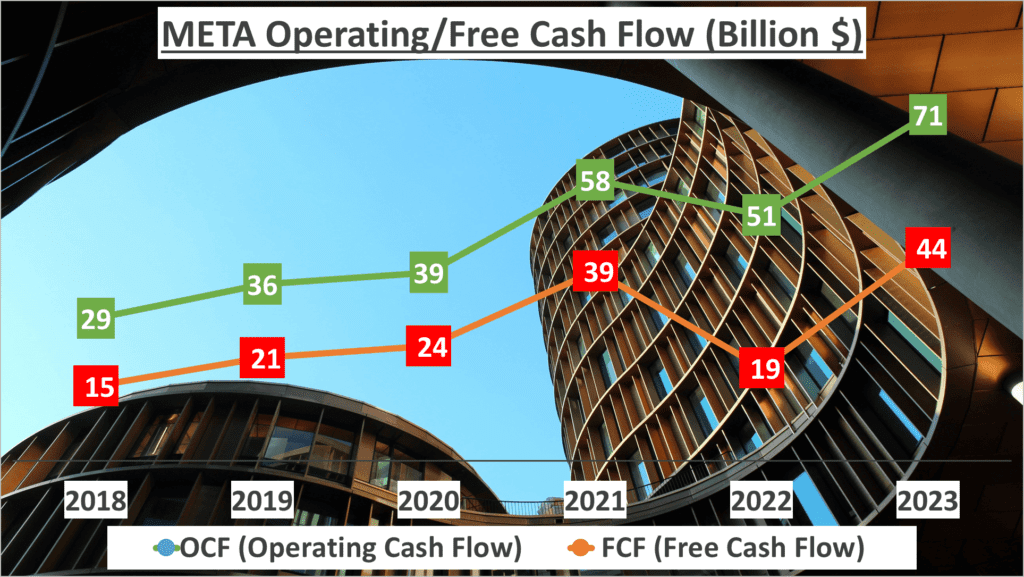
Meta’s operating cash flow for 2023 stands at an impressive $71B, marking a significant increase from 2018, with an annual Compound Annual Growth Rate (CAGR) of 19%. Similarly, Meta’s free cash flow for the same year is $44B, demonstrating a robust annual CAGR of 23% since 2018. These figures underscore Meta’s strong growth in both operating and free cash flow.
But what does this imply for Meta’s financial performance? To answer this question, we turn to the DuPont analysis, a method that dissects Return on Equity (ROE) into three components: net profit margin, asset turnover, and the asset-to-equity ratio.
In 2023, Meta’s ROE is 26%, with a net profit margin of 29%, asset turnover of 0.65, and asset-to-equity ratio of 1.5. Comparing to the previous year, we observe interesting changes. In 2022, Meta’s ROE was 18%, net profit margin was 20%, asset turnover was 1.26, and asset-to-equity ratio was 1.48.
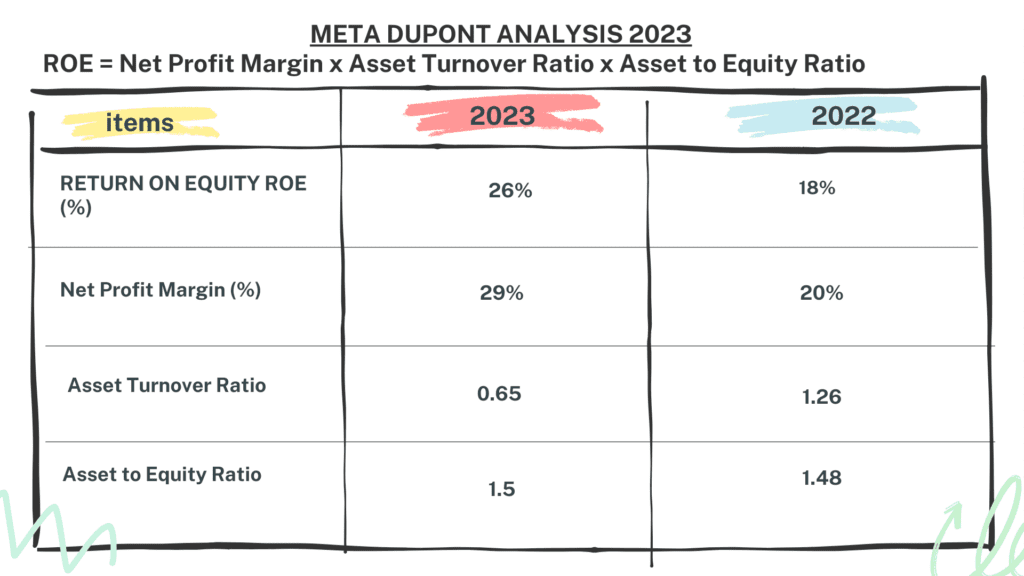
What does this analysis reveal? The increase in ROE from 2022 to 2023 is mainly attributed to a significant improvement in Meta’s net profit margin, indicating enhanced efficiency in converting sales into profit—a positive signal for potential investors.
In conclusion, Meta’s robust cash flows and improved net profit margin, as evidenced by the DuPont analysis, signify the company’s solid financial performance. It’s evident that Meta remains a key player in its industry, sustaining robust growth and showcasing impressive financial resilience.
The DuPont analysis offers a comprehensive perspective on Meta’s ROE and the contributing factors behind it, providing valuable insights for investors.
Summary and Conclusion – META Stock Analysis
In conclusion, Meta has demonstrated a robust financial performance over the years. Since 2018, the company has achieved an impressive annual growth rate of 30%.
In 2023, Meta’s revenue reached $135B, with an annual Compound Annual Growth Rate (CAGR) of 19% since 2018. Additionally, Meta’s gross profit margin for 2023 was commendable at 81%, remaining consistent with its five-year average.
The net profit margin stood at 29%, reflecting Meta’s efficiency in generating profit. Moreover, Meta’s total assets for 2023 were valued at $230B, with net assets amounting to $153B.
Furthermore, Meta maintained a strong liquidity position in 2023, boasting a current ratio of 2.66 and a quick ratio of 2.63. Its operating cash flow amounted to $71B, showcasing a robust annual CAGR of 19%.
In summary, this financial analysis lays a solid groundwork for making well-informed investment decisions regarding Meta.
Watching more on Youtube:
Author: investforcus.com
Follow us on Youtube: The Investors Community

