SMCI Stock Analysis: A Hypothetical Investment Case Study – Imagine allocating $1000 into SuperMicro (SMCI) back in 2018. Fast forward to 2024, and you’d be astounded to find your investment skyrocketing to a remarkable $63,503—a phenomenal increase of 6250%!
Yes, you read that right—your initial investment would have multiplied over 63 times. This translates to an impressive annual growth rate of 129%, far surpassing the average market returns.
This exceptional return on investment underscores SuperMicro’s outstanding performance over the past six years. But what exactly drove this meteoric ascent? What factors contributed to this remarkable growth, and is it sustainable?
These questions prompt a thorough examination of SuperMicro’s financial and business metrics. Let’s dive into the data to uncover the secrets behind SuperMicro’s phenomenal success.
SMCI Stock Analysis: Revenue Insights

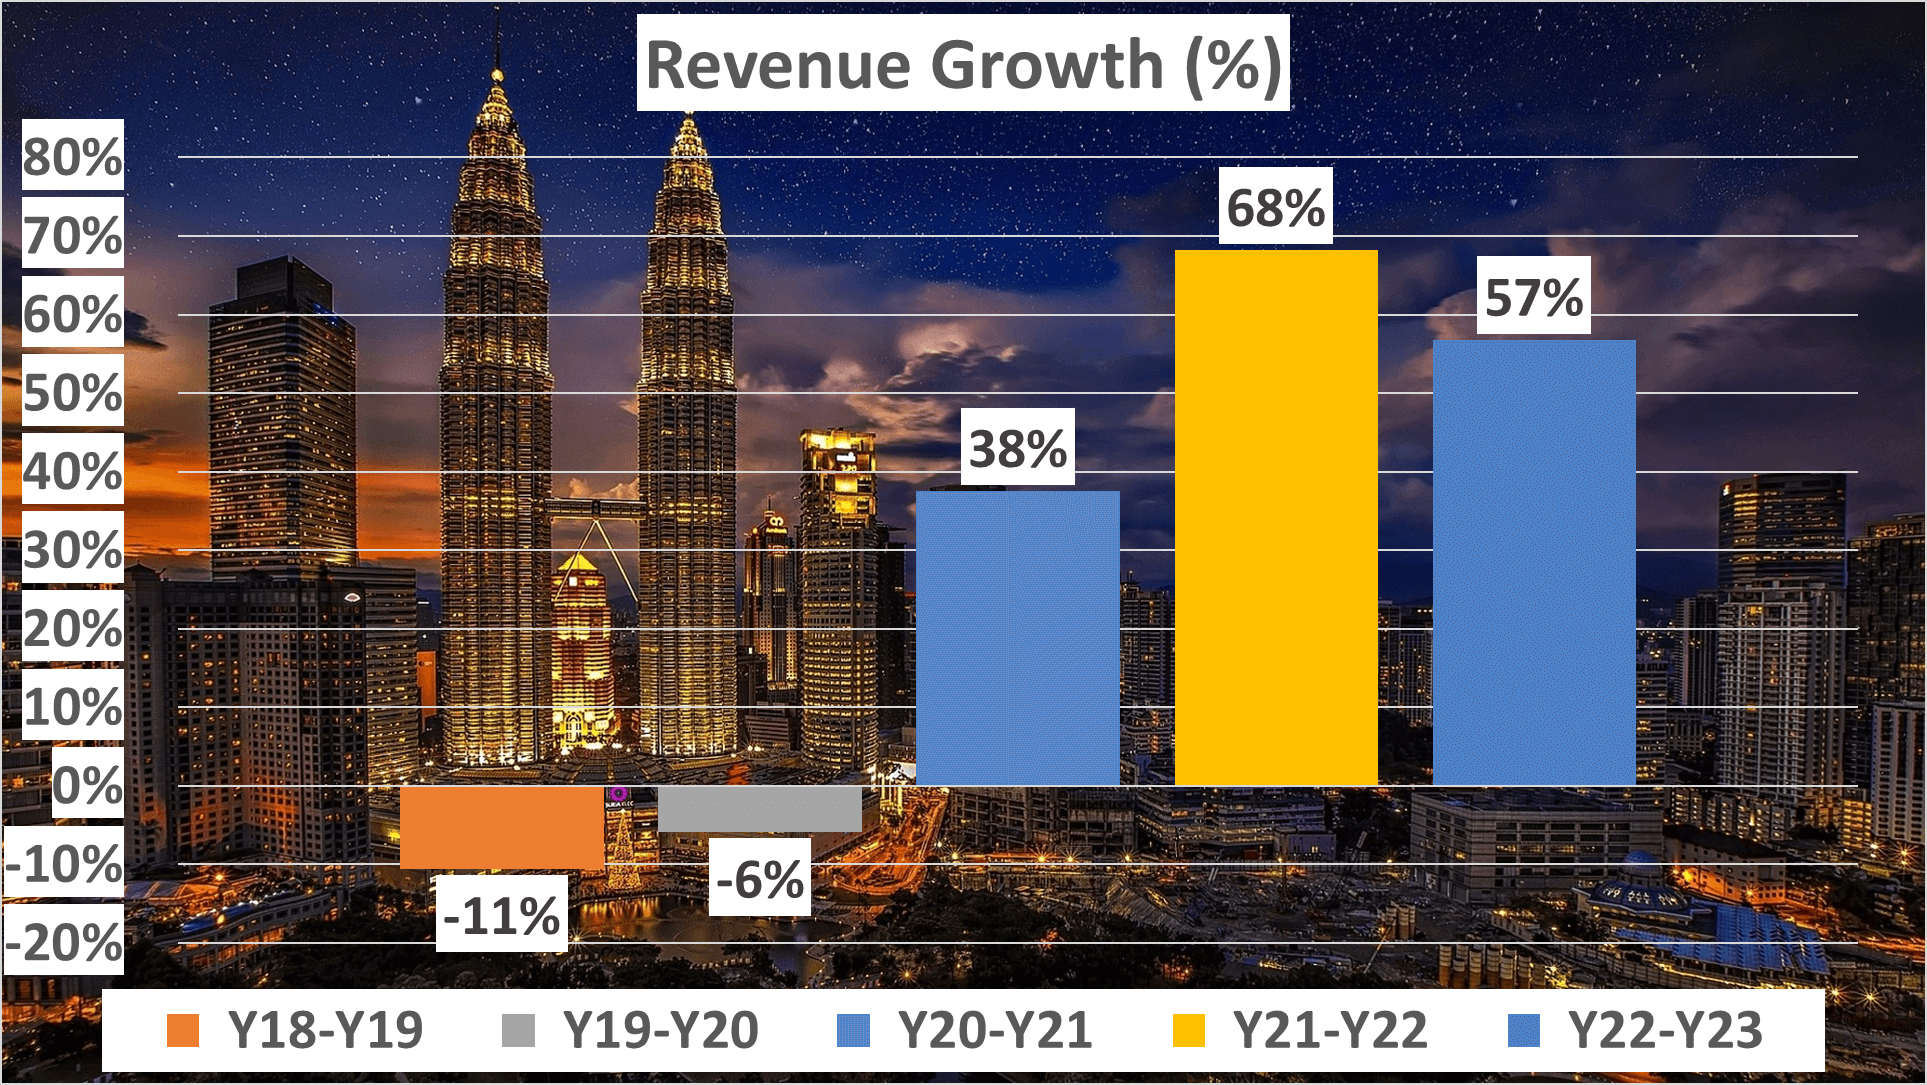
In 2023, SuperMicro’s revenue hit $5.8B, boasting a remarkable annual growth rate of 25% since 2018. Let’s dissect this trajectory further. Between 2018 and 2019, SuperMicro witnessed an 11% revenue decline, followed by a 6% dip the following year. However, 2020 marked a turning point, with a notable surge of 38%. This momentum persisted in subsequent years, with a 68% spike in 2021 and a 57% increase in 2022.
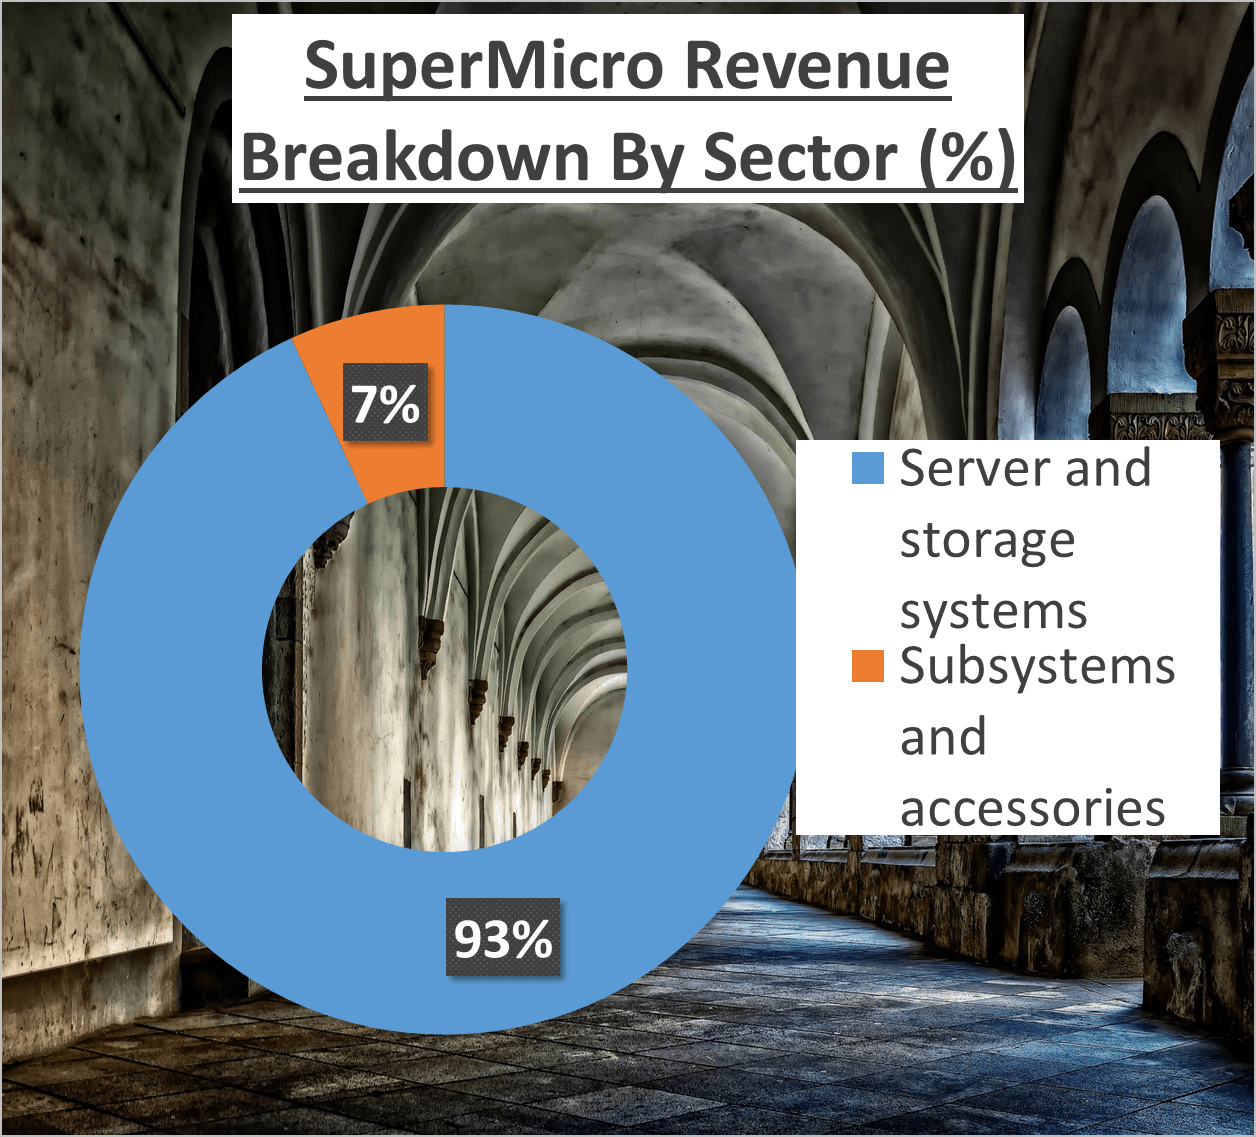
This robust revenue growth has been instrumental in driving up SuperMicro’s stock value. Now, let’s analyze the composition of SuperMicro’s revenue. The bulk of its income, 93%, stems from server and storage systems, while the remaining 7% is attributed to subsystems and accessories.
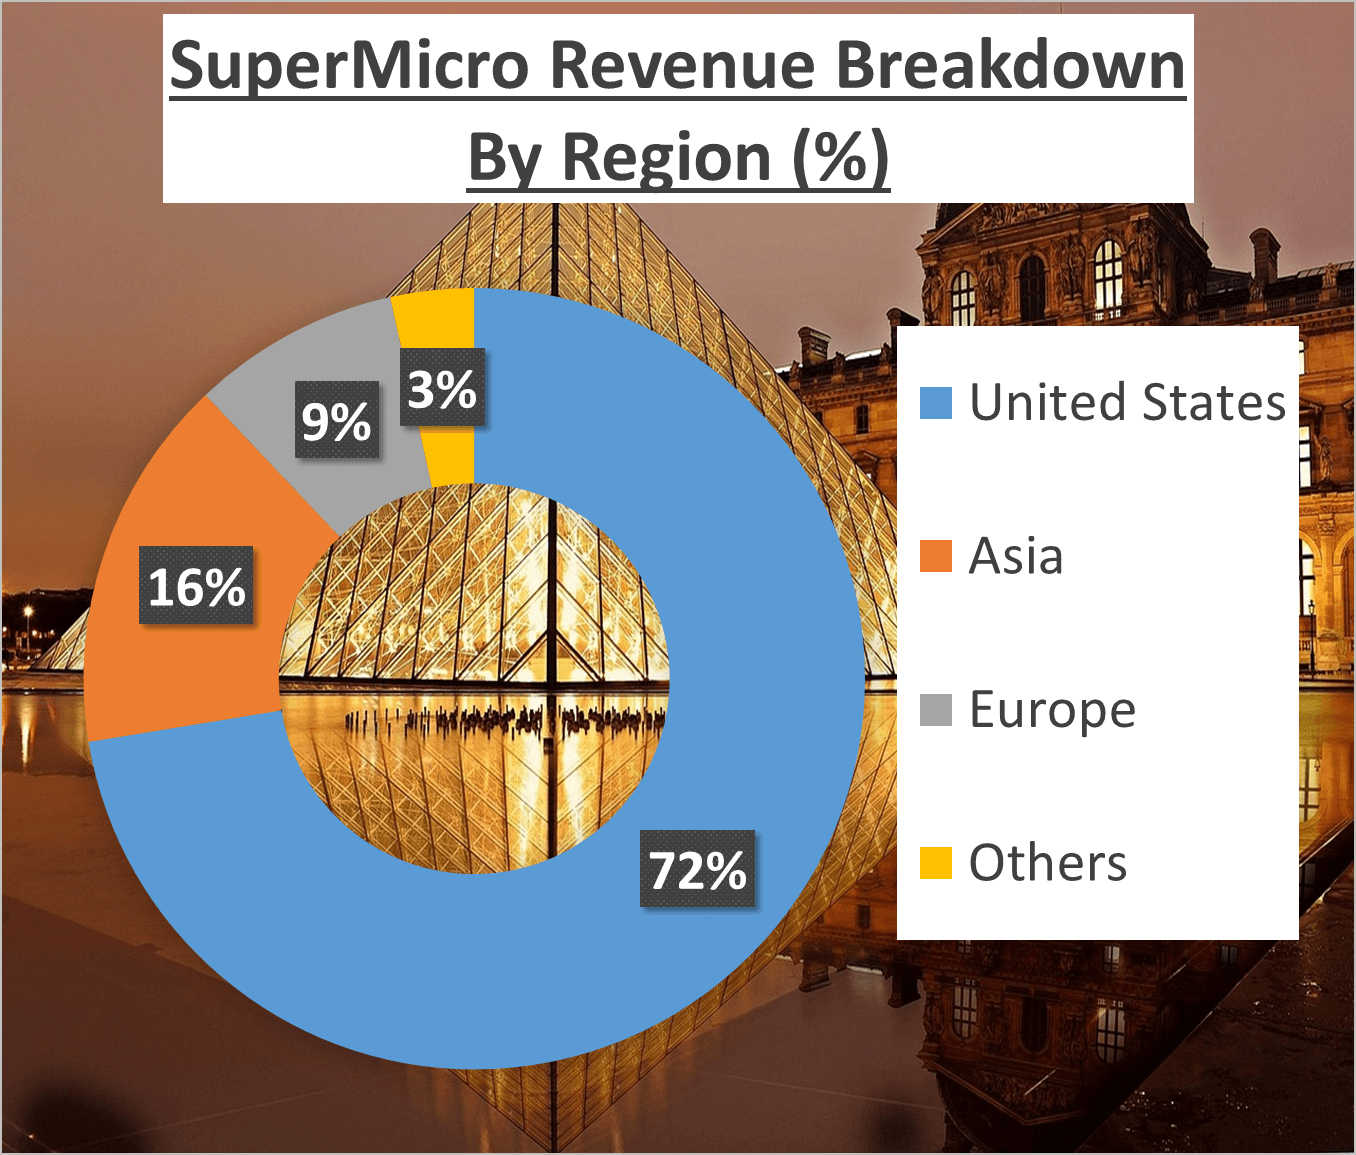
Geographically, the United States leads with 72% of the revenue, followed by Asia at 16%, Europe at 9%, and the rest of the world contributing 3%. This diversified revenue stream, combined with its global presence and product range, forms a solid foundation for SuperMicro.
The company’s ability to maintain steady income from its core product line while expanding into new segments showcases its strategic vision. Additionally, its significant revenue share from the competitive US market underscores its strong brand reputation and market position.
While impressive revenue growth is a key driver of stock performance, it’s only part of the equation. In the following section, we’ll delve into SuperMicro’s profit margins and net profit to gain deeper insights into its financial health and profitability.
SMCI Stock Analysis: Profitability Insights
In 2023, SuperMicro maintained a gross profit margin of 16%, in line with its five-year average. However, what truly stands out is the net profit margin, which soared to 9%, a substantial improvement from the five-year average of 5%.

The consistency in gross profit margin signifies a robust business model, while the remarkable growth in net profit margin reflects the company’s enhanced efficiency in expense management.
Now, let’s delve into the net profit. In 2023, SuperMicro reported a net profit of $500M. Compared to 2018, this represents an astounding compound annual growth rate of 66%.
Such an impressive growth rate underscores the efficacy of the company’s strategies and its adeptness in executing its business plans.
But what do these stable gross profit margins and escalating net profit margins reveal?
The gross profit margin gauges the profitability of SuperMicro’s core operations, excluding overheads. Its stability indicates the company’s ability to maintain pricing control and manage cost of goods sold effectively.
Conversely, the net profit margin encompasses all expenses, including overheads. The substantial improvement observed here suggests SuperMicro’s success not only in controlling direct costs but also in managing indirect expenses. This could be attributed to economies of scale, improved cost management practices, or a blend of both.
In essence, while the stable gross profit margin signifies a consistent business performance, the escalating net profit margin signals operational efficiency enhancements.
This efficiency is clearly reflected in the remarkable growth rate of net profit, ultimately contributing to SuperMicro’s robust stock performance.
These profit metrics further elucidate the stock’s impressive trajectory. With a steady gross profit margin and a burgeoning net profit margin, SuperMicro demonstrates operational efficiency and effective cost management, culminating in significant net profit growth and a commendable stock performance.
SMCI Stock Analysis: Asset Evaluation and Liquidity Metrics
In 2023, SuperMicro’s total assets surged to $5.4B, a significant increase from $3.7B in 2022. This upswing reflects the effectiveness of the company’s growth strategy and its robust business performance.

Digging deeper, the net assets for 2023 soared to $3.1B, marking a considerable leap from $2B in 2022. This substantial increase in net assets further accentuates the company’s impressive financial standing.
Now, let’s shift our focus to the equity-to-total-assets ratio. In 2023, this ratio rose to 57%, up from 54% in 2022. This upward trend indicates that a significant portion of the company’s assets is funded by equity, suggesting solid financial stability.
Moving on to liquidity ratios—specifically, the current and quick ratios. These metrics are pivotal as they gauge a company’s ability to fulfill its short-term obligations.
In 2023, SuperMicro’s current ratio stood at 2.4, a slight increase from 2.29 in 2022. This indicates that the company possessed more than double the current assets compared to current liabilities, ensuring its short-term financial resilience.

The quick ratio, which excludes inventory from current assets, was 1.15 in 2023, a marginal decrease from 1.29 in 2022. Despite the slight dip, it signifies SuperMicro’s capability to settle its current liabilities without relying on inventory liquidation—an encouraging sign of financial robustness.
These metrics collectively depict a strong and improving financial position for SuperMicro. By analyzing total and net assets, equity-to-total-assets ratio, and liquidity ratios, it’s evident that SuperMicro has adeptly managed its resources, paving the way for sustained growth and stability.
SMCI Stock Analysis: Cash Flow Assessment and DuPont Analysis
Despite impressive profit figures, SuperMicro’s cash flow presents a contrasting scenario. Let’s delve into the specifics. In 2023, SuperMicro reported negative operating and free cash flows of -$300M and -$320M, respectively.

What does this indicate? It suggests that despite the company’s commendable net profit figures, its cash generation capability is lacking. Now, there are several factors contributing to this disparity.
One significant culprit is the company’s substantial investment in inventory. SuperMicro’s inventory days stood at 145 in 2023, down from 170 in 2022, indicating a sluggish sales turnover. Addressing this could significantly enhance the company’s cash flow.
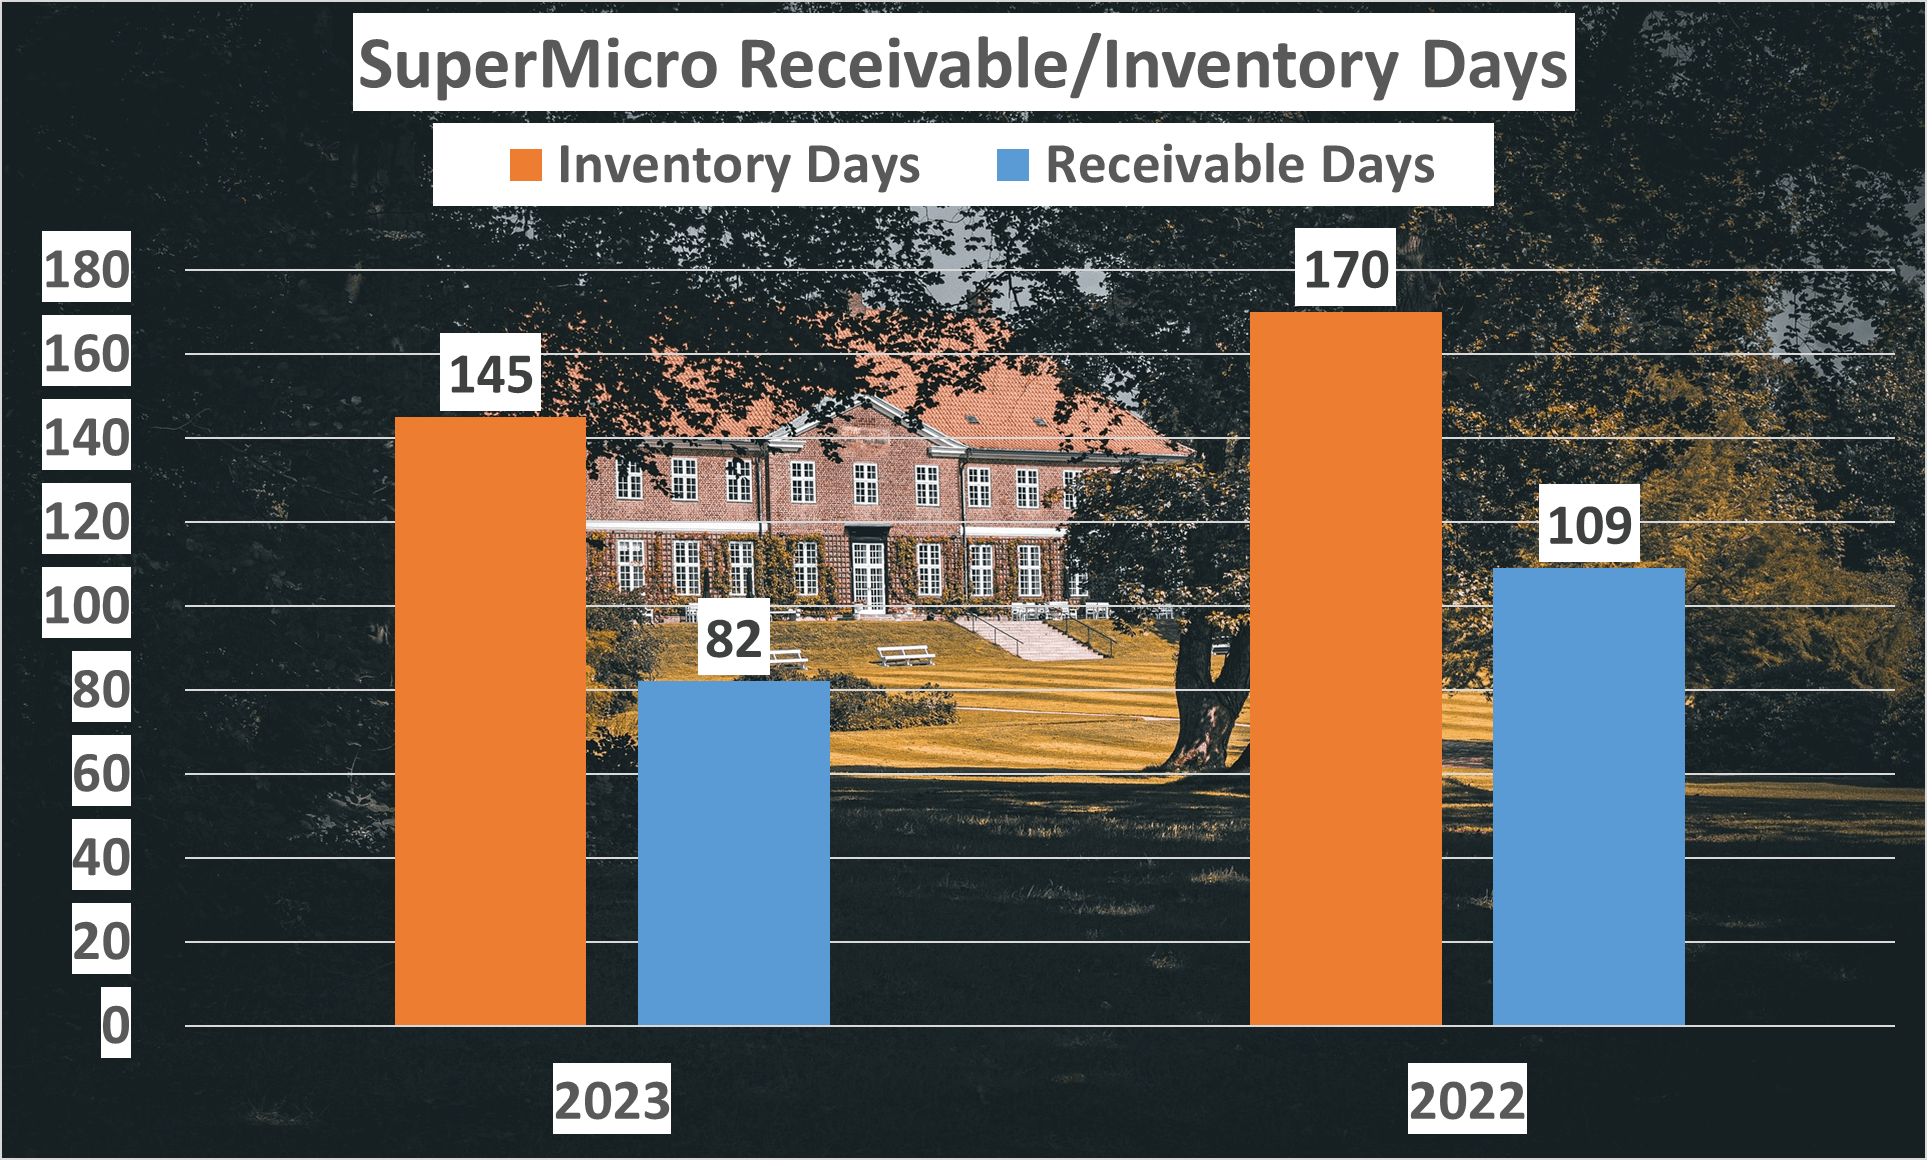
Another factor impacting cash flow is the high number of receivable days. With 82 days in 2023, down from 109 days in 2022, SuperMicro takes a considerable time to collect payments from its customers, presenting another area for improvement.
Now, let’s transition to a DuPont analysis to dissect the components of Return on Equity (ROE). In 2023, SuperMicro’s ROE was 16%, comprising a net profit margin of 9%, an asset turnover of 1.27, and an asset-to-equity ratio of 1.74.
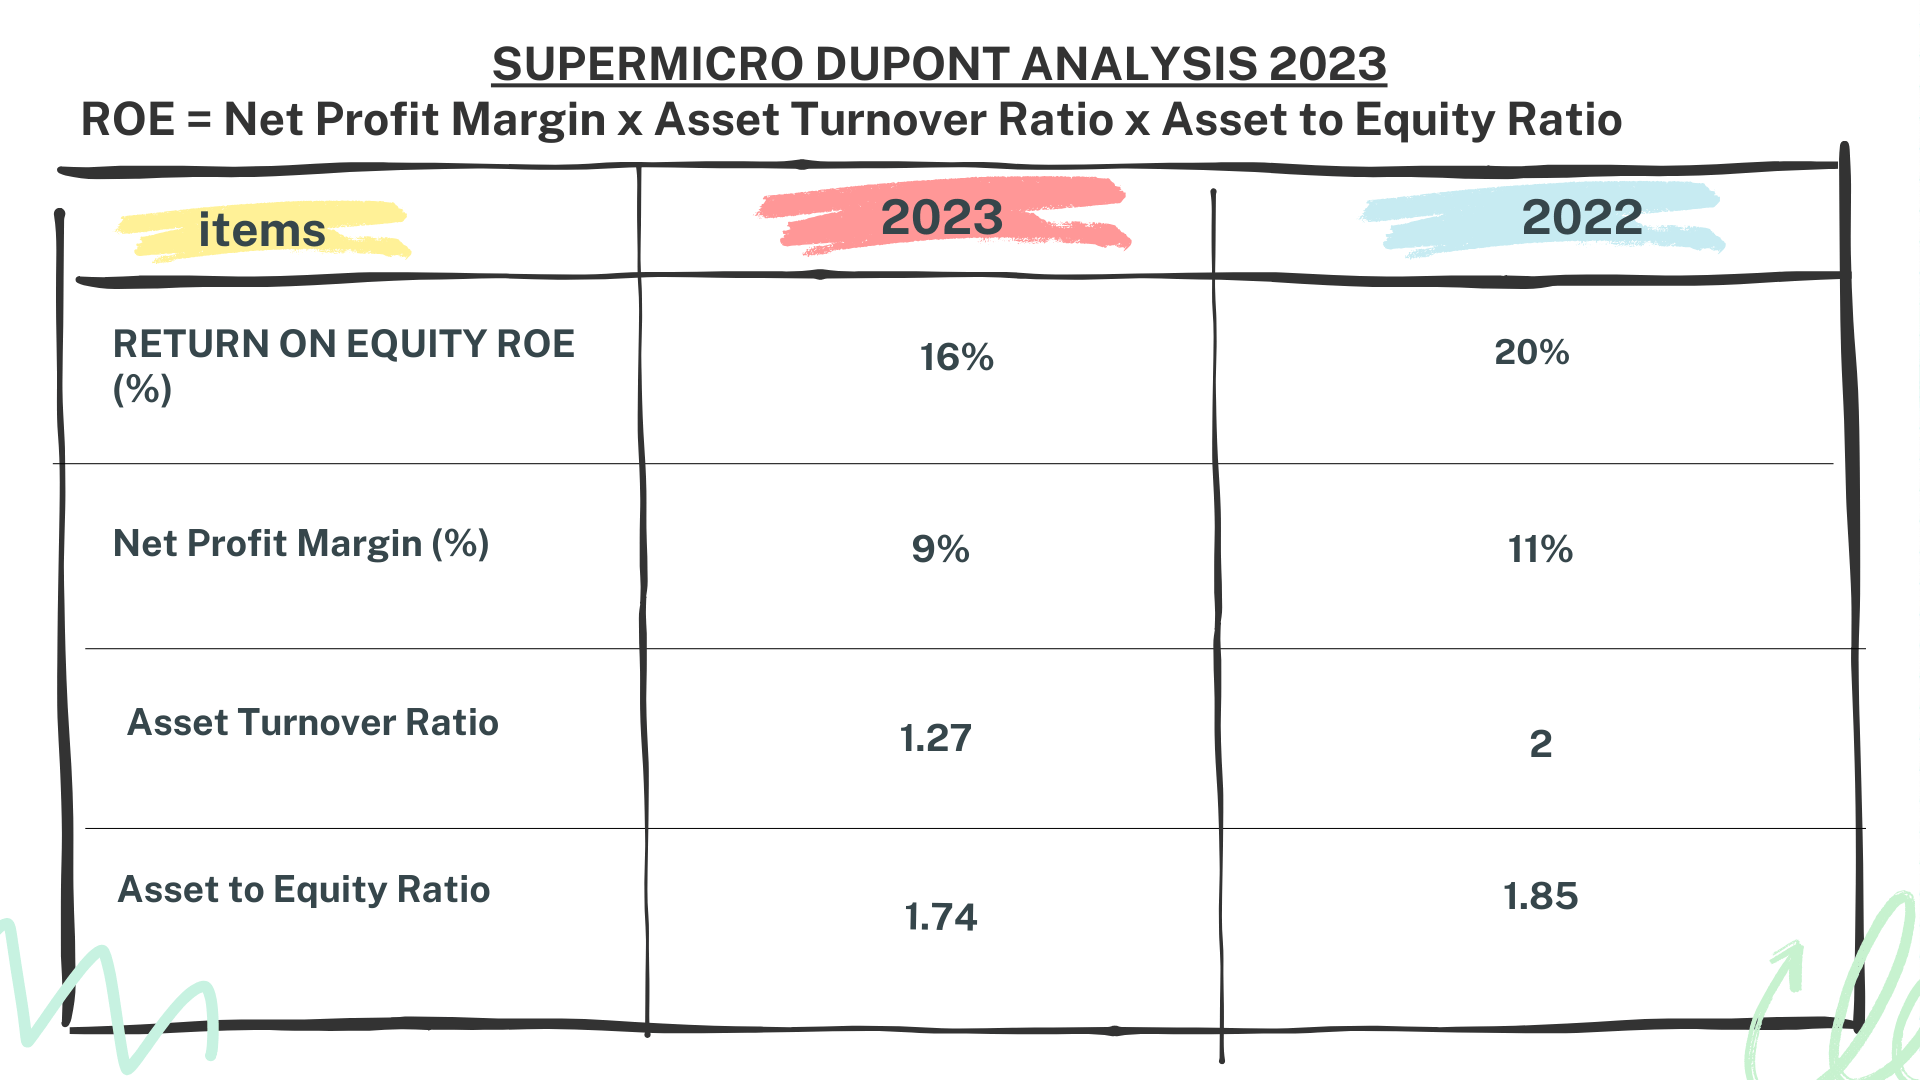
Comparing these figures to 2022, where ROE was 20%, reveals a decline across all components: net profit margin, asset turnover, and asset-to-equity ratio.
These findings highlight potential areas for SuperMicro’s improvement, despite the overall positive outlook.
SMCI Stock Analysis: Summary
In summary, SuperMicro’s stellar stock performance is driven by its robust revenue growth, enhanced profit margins, and solid financial footing.

With an impressive compound annual growth rate of 25% since 2018, the company’s annual revenue reached $5.8B in 2023. This substantial revenue uptick, combined with a steady 16% gross profit margin and an improved net profit margin of 9%, has propelled SuperMicro’s stock to new heights.
Furthermore, the significant growth in total assets, soaring from $3.7B in 2022 to $5.4B in 2023, has bolstered SuperMicro’s financial position and bolstered investor confidence.
However, to sustain this growth trajectory, SuperMicro must address its cash flow and inventory turnover challenges. While the company boasts commendable current and quick ratios, its operating and free cash flows remain in negative territory.
Author: investforcus.com
Follow us on Youtube: The Investors Community

