Apple vs Microsoft Stock Analysis: A Comparative Financial Overview – Curious about how Apple’s financials fare against Microsoft’s? These tech giants have significantly influenced the digital landscape for years, each with distinct business strategies.
Apple, renowned for its iPhone, has crafted a product ecosystem adored worldwide. Meanwhile, Microsoft’s Windows and Office suite have become integral to both households and businesses.
Beyond their iconic products, understanding their financial standings is paramount for informed investments. Let’s delve into the numbers to gauge the comparative financial health and growth potential of Apple and Microsoft. Stay tuned for a comprehensive analysis.
Revenue Comparison – Apple vs Microsoft Stock Analysis
Let’s dive into the financials of both tech giants as of the end of 2023. Apple, renowned for its iPhones and MacBooks, reported an impressive $383B in total revenue. Meanwhile, Microsoft, the powerhouse behind Windows and Office Suite, recorded a substantial $212B in total revenue.
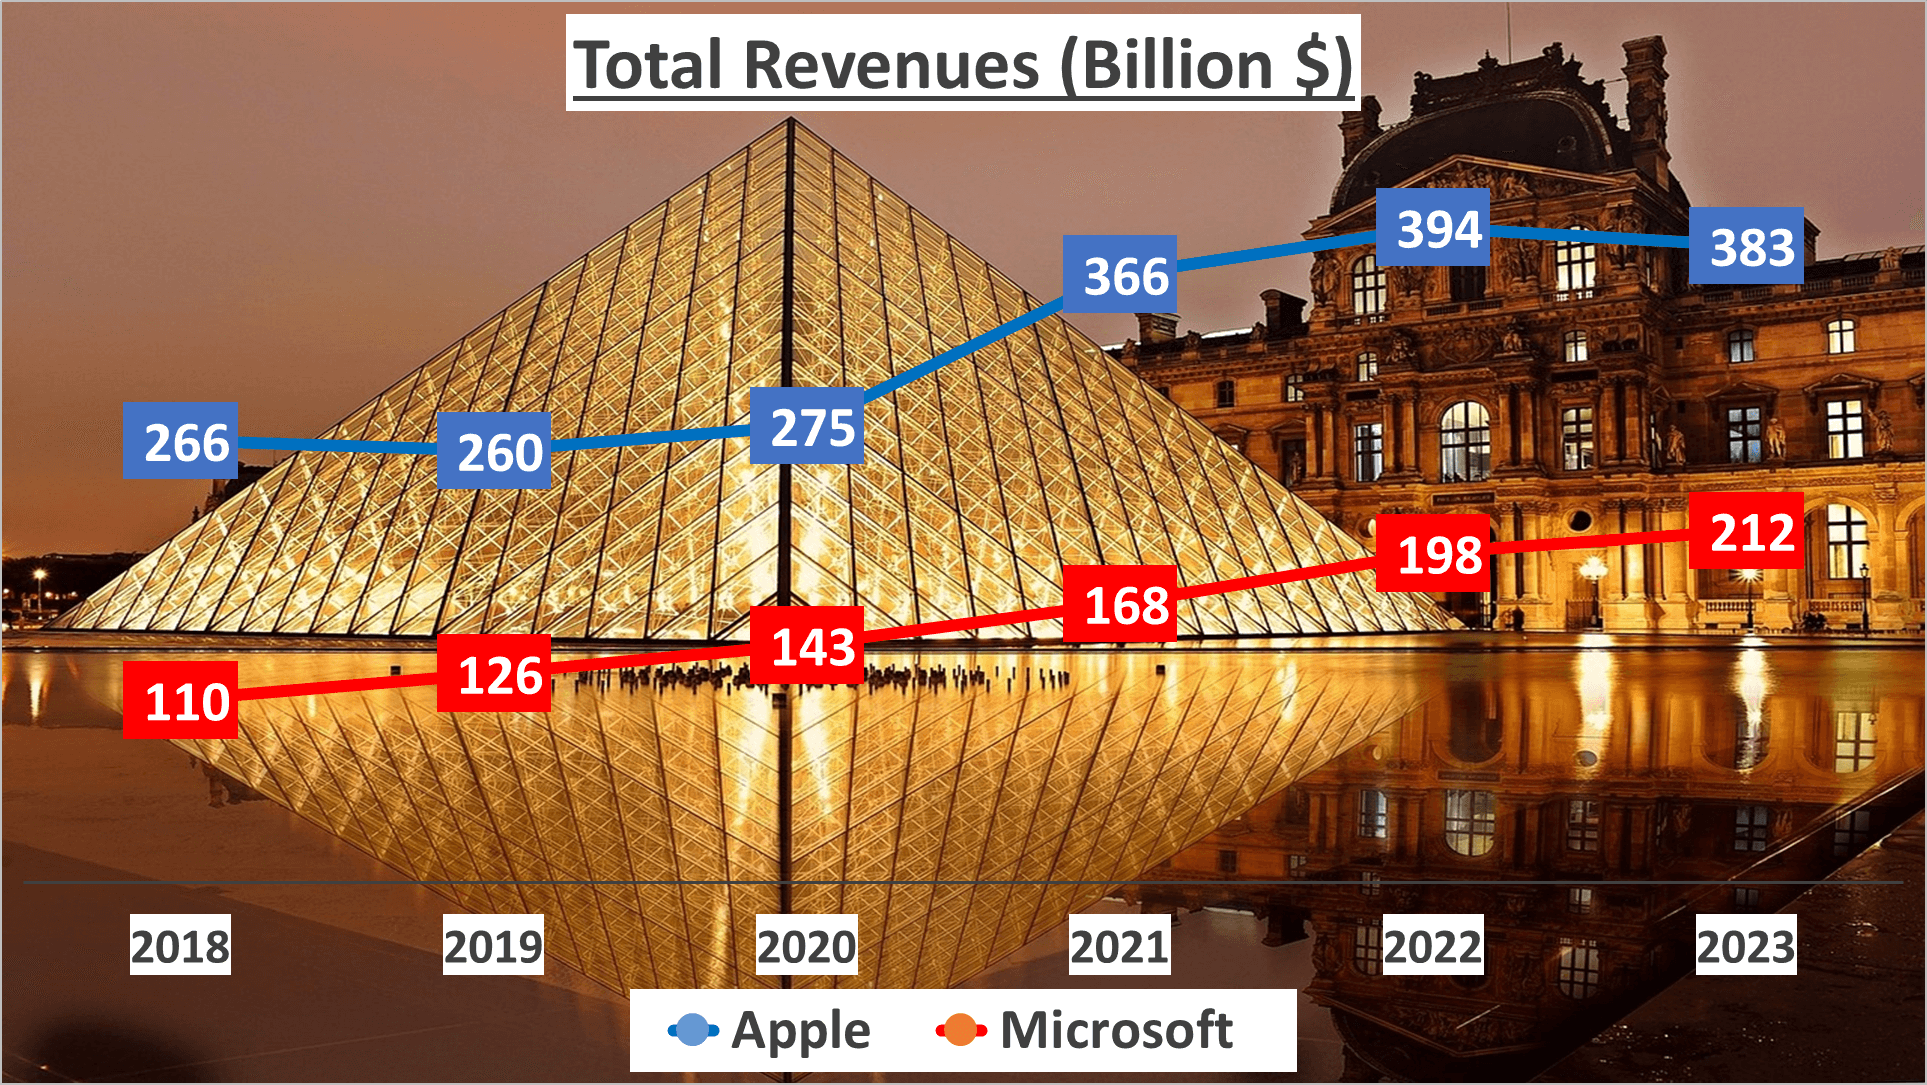
Examining the five-year Compound Annual Growth Rate (CAGR), an intriguing trend emerges. Apple boasted a CAGR of 8%, whereas Microsoft showcased a more impressive 14% growth rate. Despite Apple’s higher revenue, Microsoft’s growth rate nearly doubled that of Apple’s.
Now, let’s explore the reasons behind this discrepancy. From 2021 to 2023, Apple experienced a slowdown in revenue growth, possibly due to market saturation for iPhones and intensified competition. Conversely, Microsoft sustained steady growth, primarily attributed to its successful transition to cloud-based services, proving highly lucrative.
What does this signify? While Apple commands higher revenue, Microsoft’s rapid growth rate underscores the success of its diversified services and focus on the cloud. However, Apple’s heavy reliance on iPhone sales, comprising over half of its revenue, poses a potential vulnerability amid a slowing smartphone market.
It’s crucial to acknowledge that these figures offer only a partial view. Factors like profitability, efficiency, and cash flow are equally vital in assessing a company’s financial health. Nonetheless, it’s evident that both Apple and Microsoft are thriving entities with distinct strategies and strengths.
In summary, Apple leads in revenue, whereas Microsoft outpaces in growth rate, showcasing the divergent paths of these tech titans.
Revenue Breakdown – Apple vs Microsoft Stock Analysis
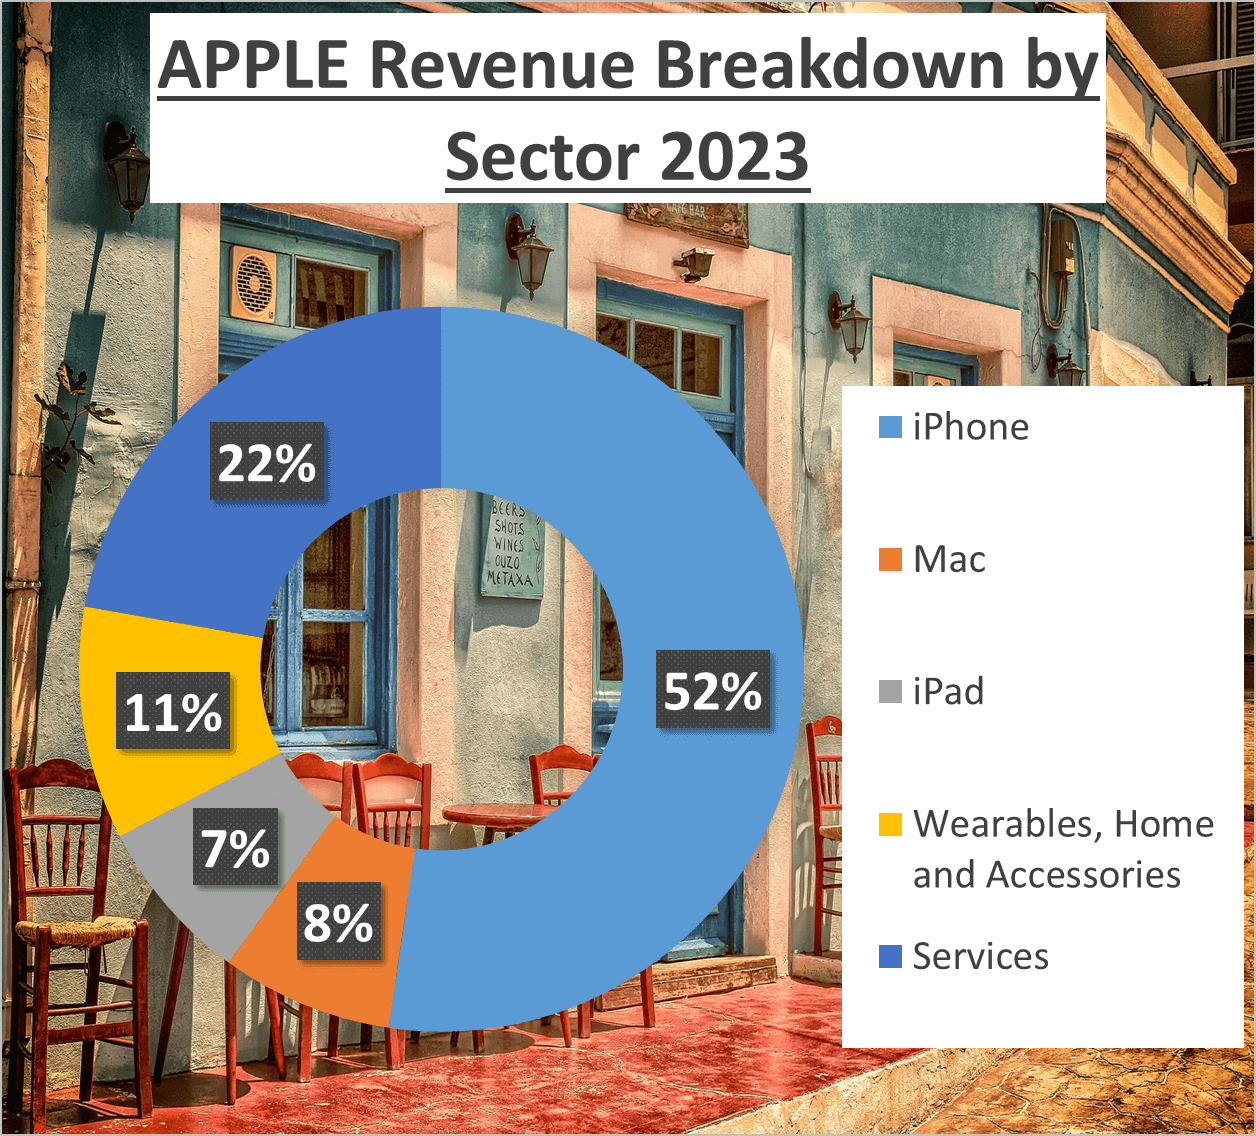
Let’s dissect where exactly these revenues originate. For Apple, the breakdown is as follows: Over half of their revenue, precisely 52%, stems from their flagship product, the iPhone. Mac contributes 8%, while iPad chips in with 7%. Surprisingly, the Wearables, Home, and Accessories category show an upward trend, accounting for 11% of total revenue. Lastly, Services, encompassing the App Store, Apple Music, and iCloud, constitute 22% of their revenue.
In contrast, Microsoft’s revenue breakdown paints a distinct picture. The largest portion, 41%, hails from Intelligent Cloud, their cloud computing service. Productivity and Business Processes, inclusive of Office, LinkedIn, and Dynamics, contribute 33%. Finally, Personal Computing, covering Windows, Xbox, and Surface, brings in 26% of total revenue.
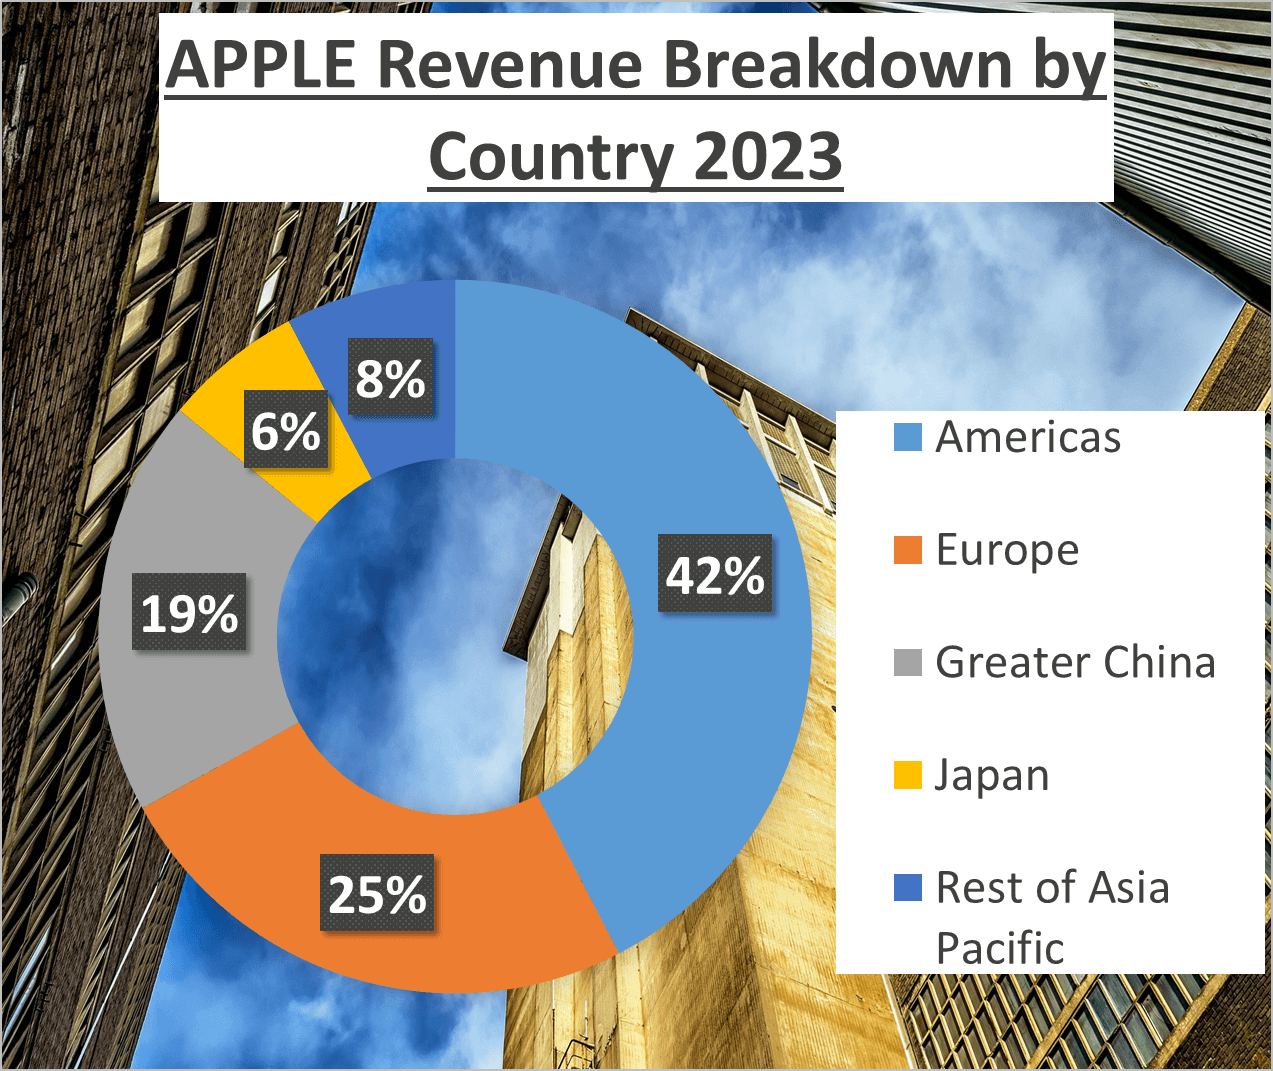
Now, let’s examine the geographical distribution of this revenue. For Apple, 42% of revenue comes from the Americas, 25% from Europe, 19% from Greater China, and the remaining 14% from other regions. On the contrary, Microsoft displays a more balanced distribution, with 50% of revenue originating from the United States and the remaining half from international markets.
The divergence in revenue sources between these tech giants is intriguing. Apple heavily relies on hardware, with the iPhone as its primary revenue driver, while Microsoft leans towards software and services, with a substantial portion generated from cloud computing.
Regarding geographical diversification, Apple boasts a more varied revenue stream, with substantial contributions from the Americas, Europe, and Greater China. In contrast, Microsoft’s revenue stream is more concentrated, with half of its revenue stemming from the United States.
The disparity in revenue sources between Apple and Microsoft underscores their distinct business models and strategic focuses.
Profitability and Efficiency – Apple vs Microsoft Stock Analysis
Revenue is just one part of the equation; let’s delve into profitability and efficiency.
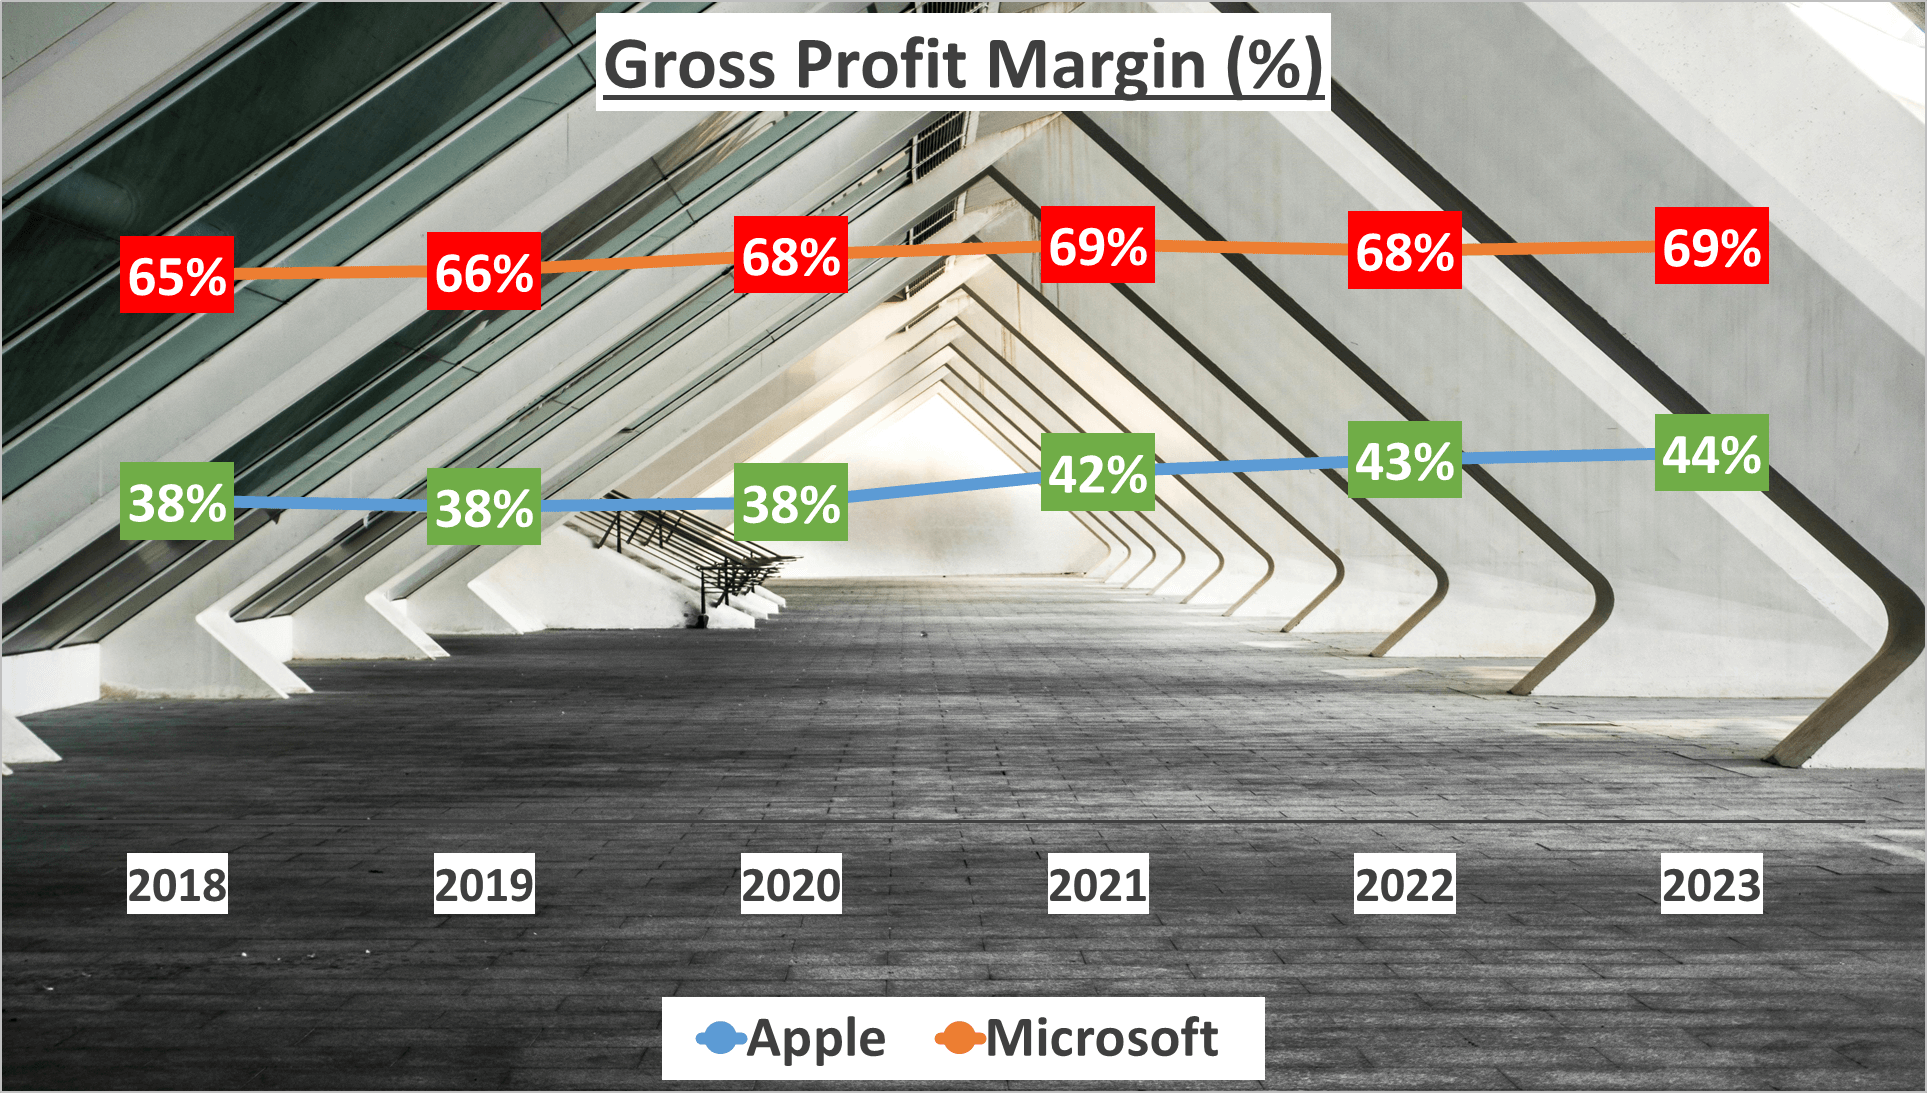
Starting with gross profit margin, in 2023, Apple’s gross profit margin stood at 44%, slightly above its five-year average of 41%. Microsoft, however, boasted a higher gross profit margin of 69%, slightly surpassing its five-year average of 68%.
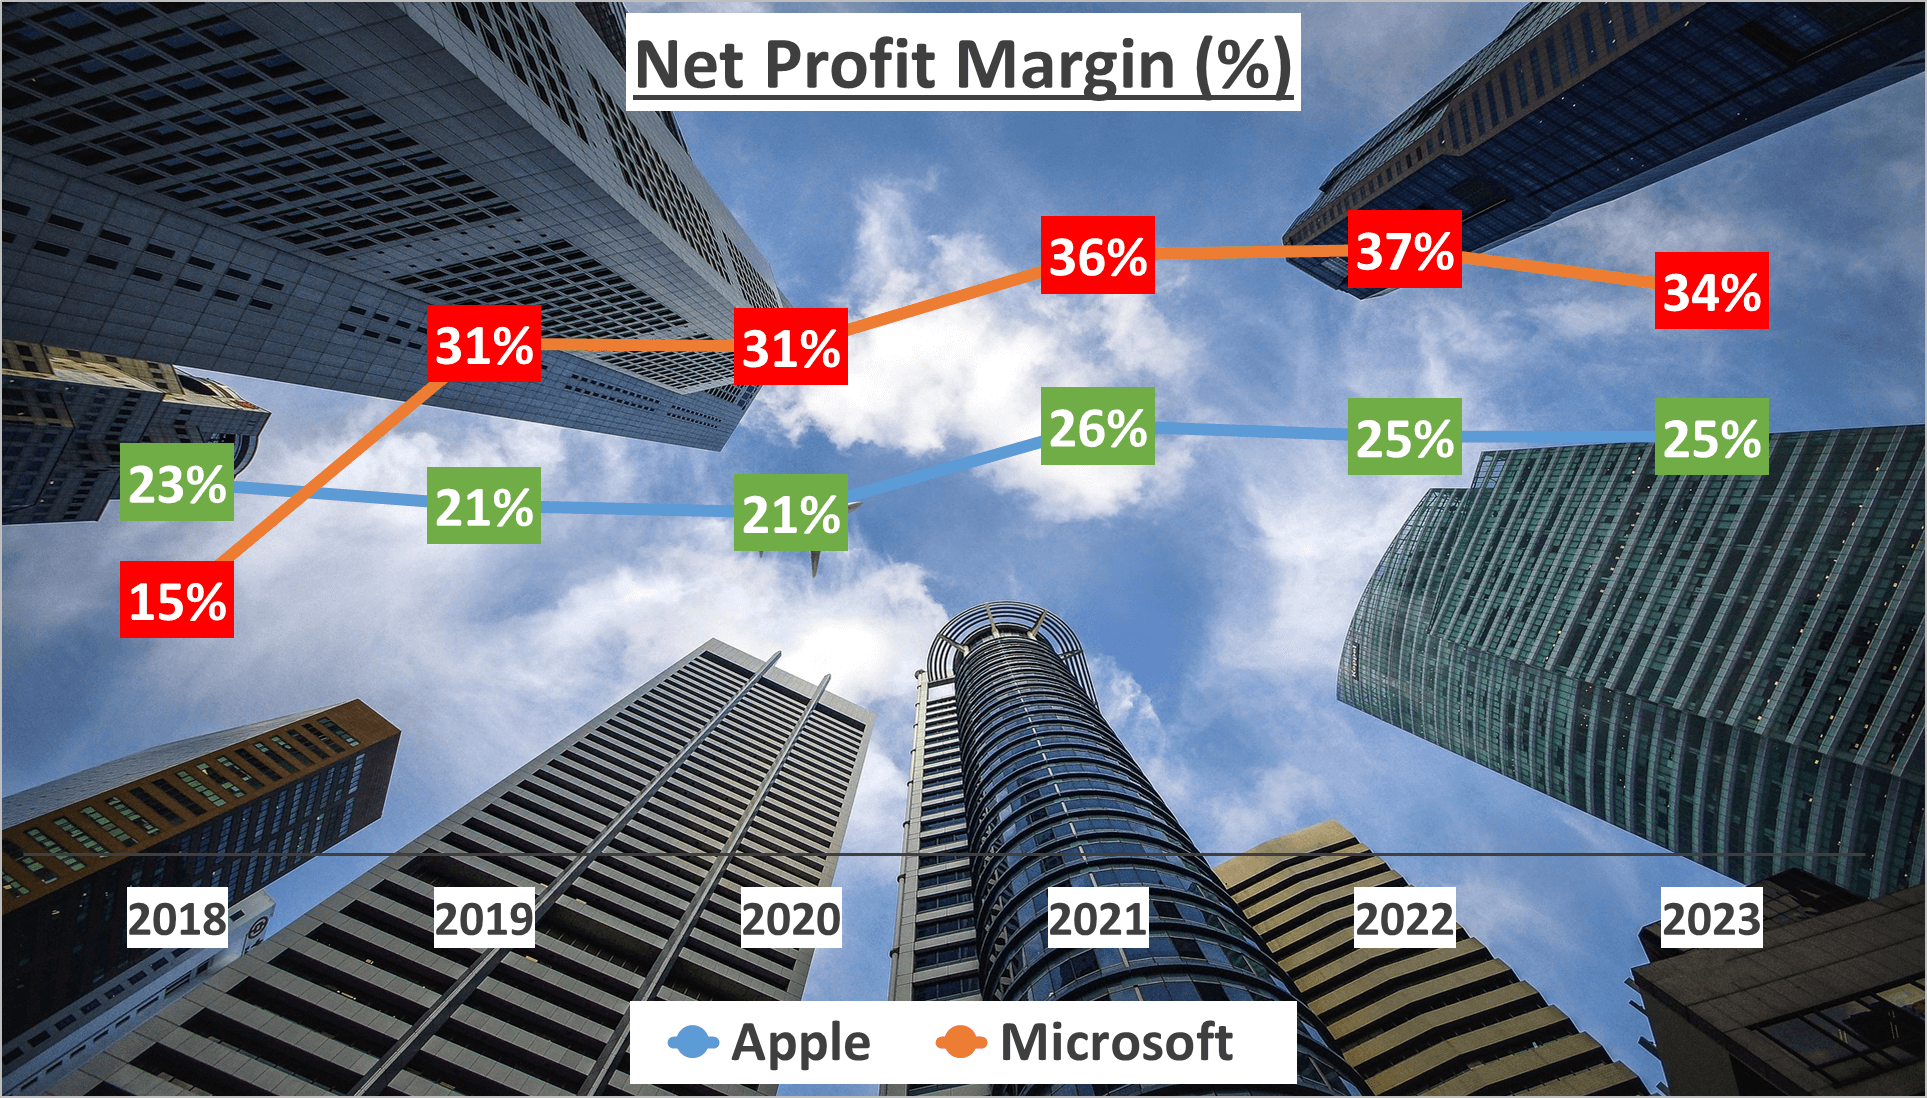
Moving on to net profit margins, Apple recorded a 25% margin in 2023, up one percentage point from the five-year average. Microsoft, impressively, showcased a net profit margin of 34%, three percentage points higher than its five-year average.
Now, let’s examine total assets and net assets. Apple’s total assets amounted to $353B, whereas Microsoft’s total assets were $412B. However, in terms of net assets, Apple reported $62B, significantly lower than Microsoft’s $206B.
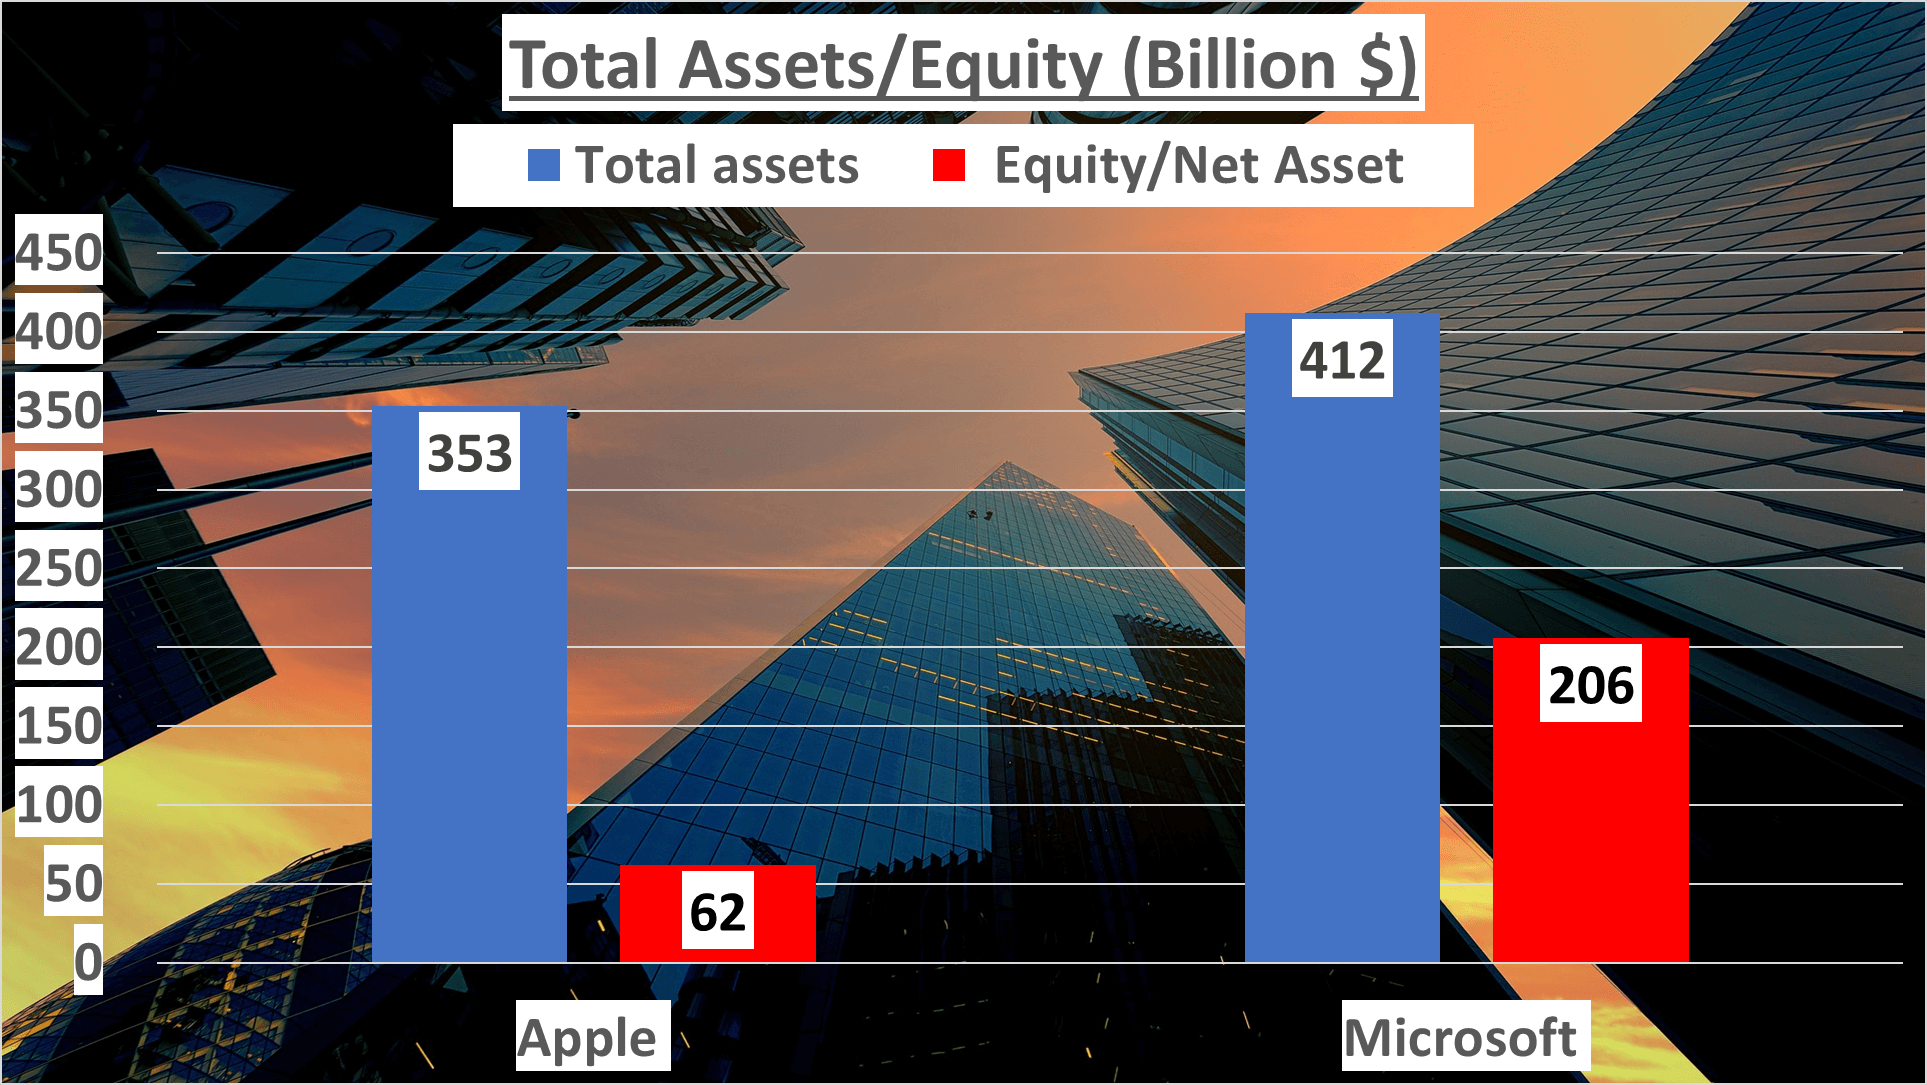
This leads us to the equity to total assets ratio, where Apple scored 18%, while Microsoft boasted a higher ratio of 50%.
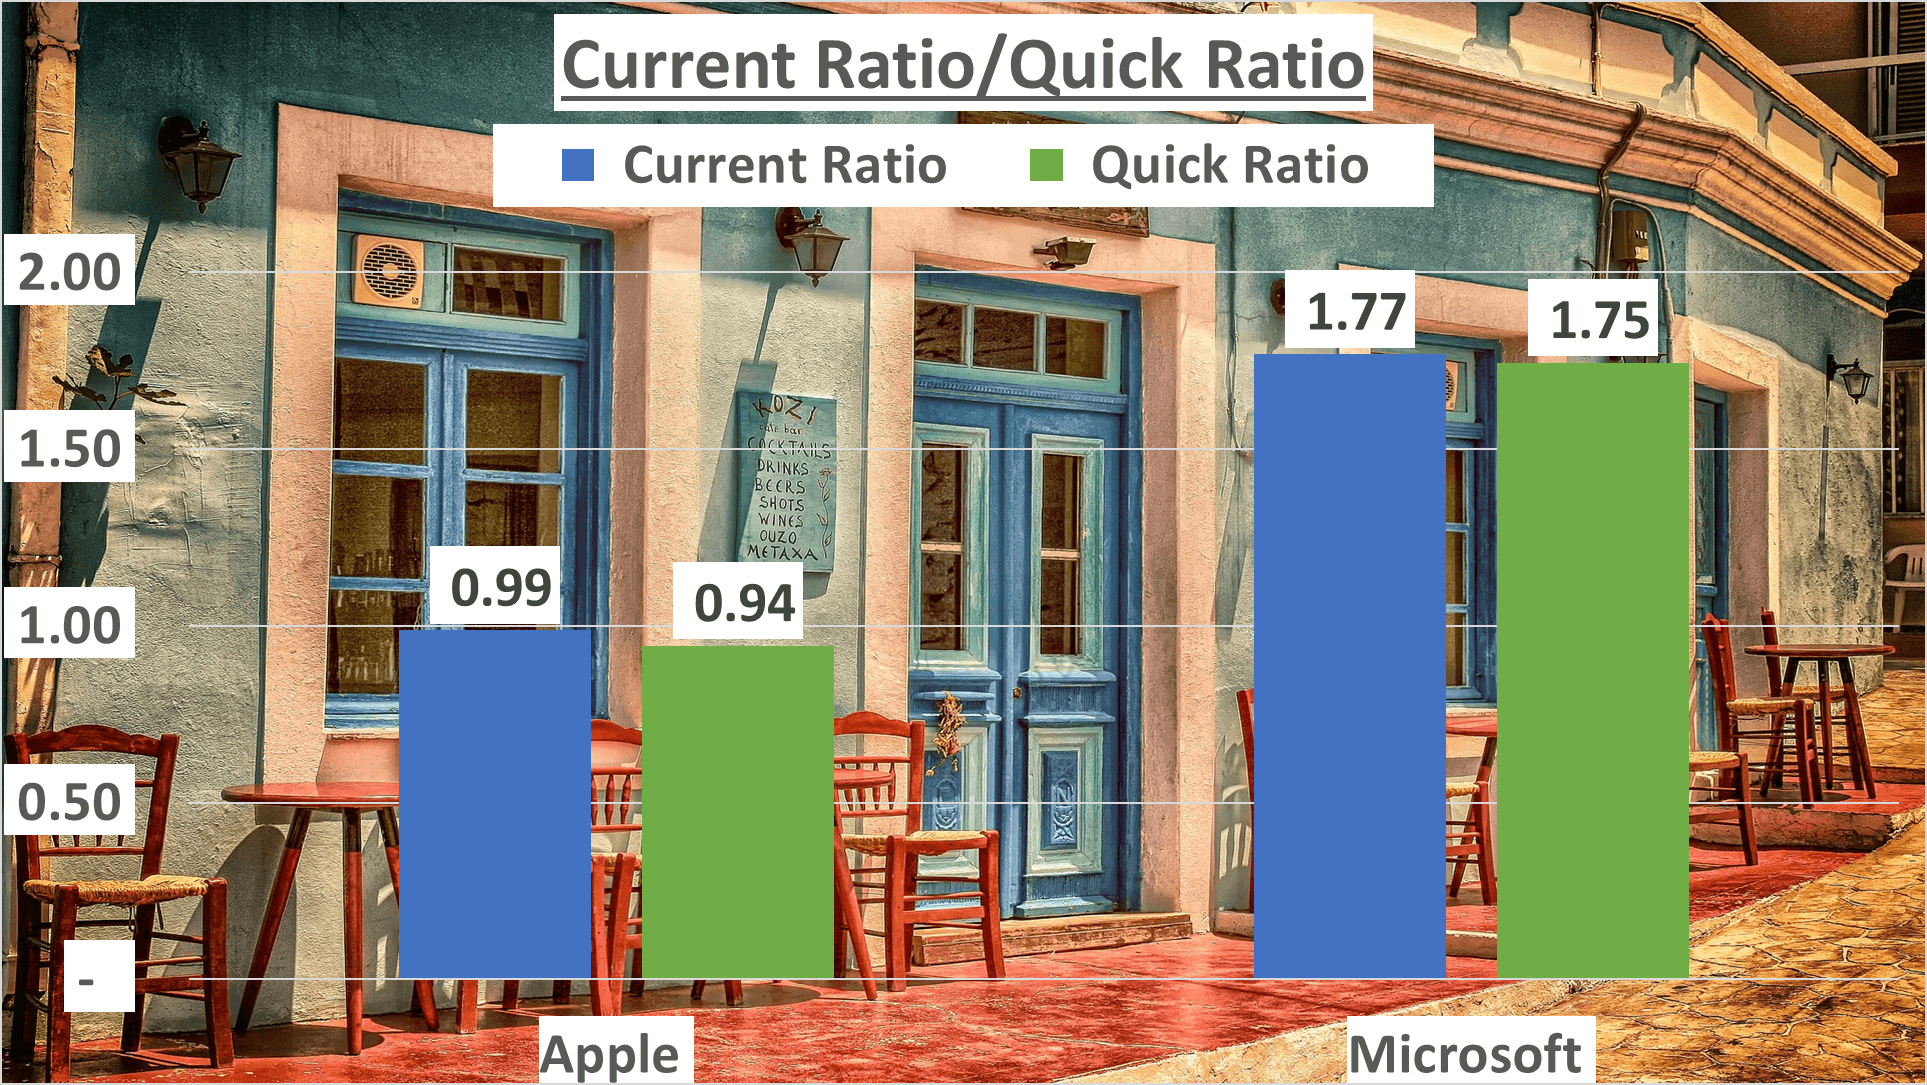
Don’t overlook the current and quick ratios. Apple’s current ratio was 0.99, and its quick ratio was 0.94. Microsoft outperformed in both metrics, with a current ratio of 1.77 and a quick ratio of 1.75.
Lastly, operational efficiency. Apple demonstrated an inventory days figure of 7 days and accounts receivable days of 20 days. Microsoft’s inventory days were 13 days, with accounts receivable days at 59 days. Here, Apple surpasses Microsoft, indicating superior operational efficiency.
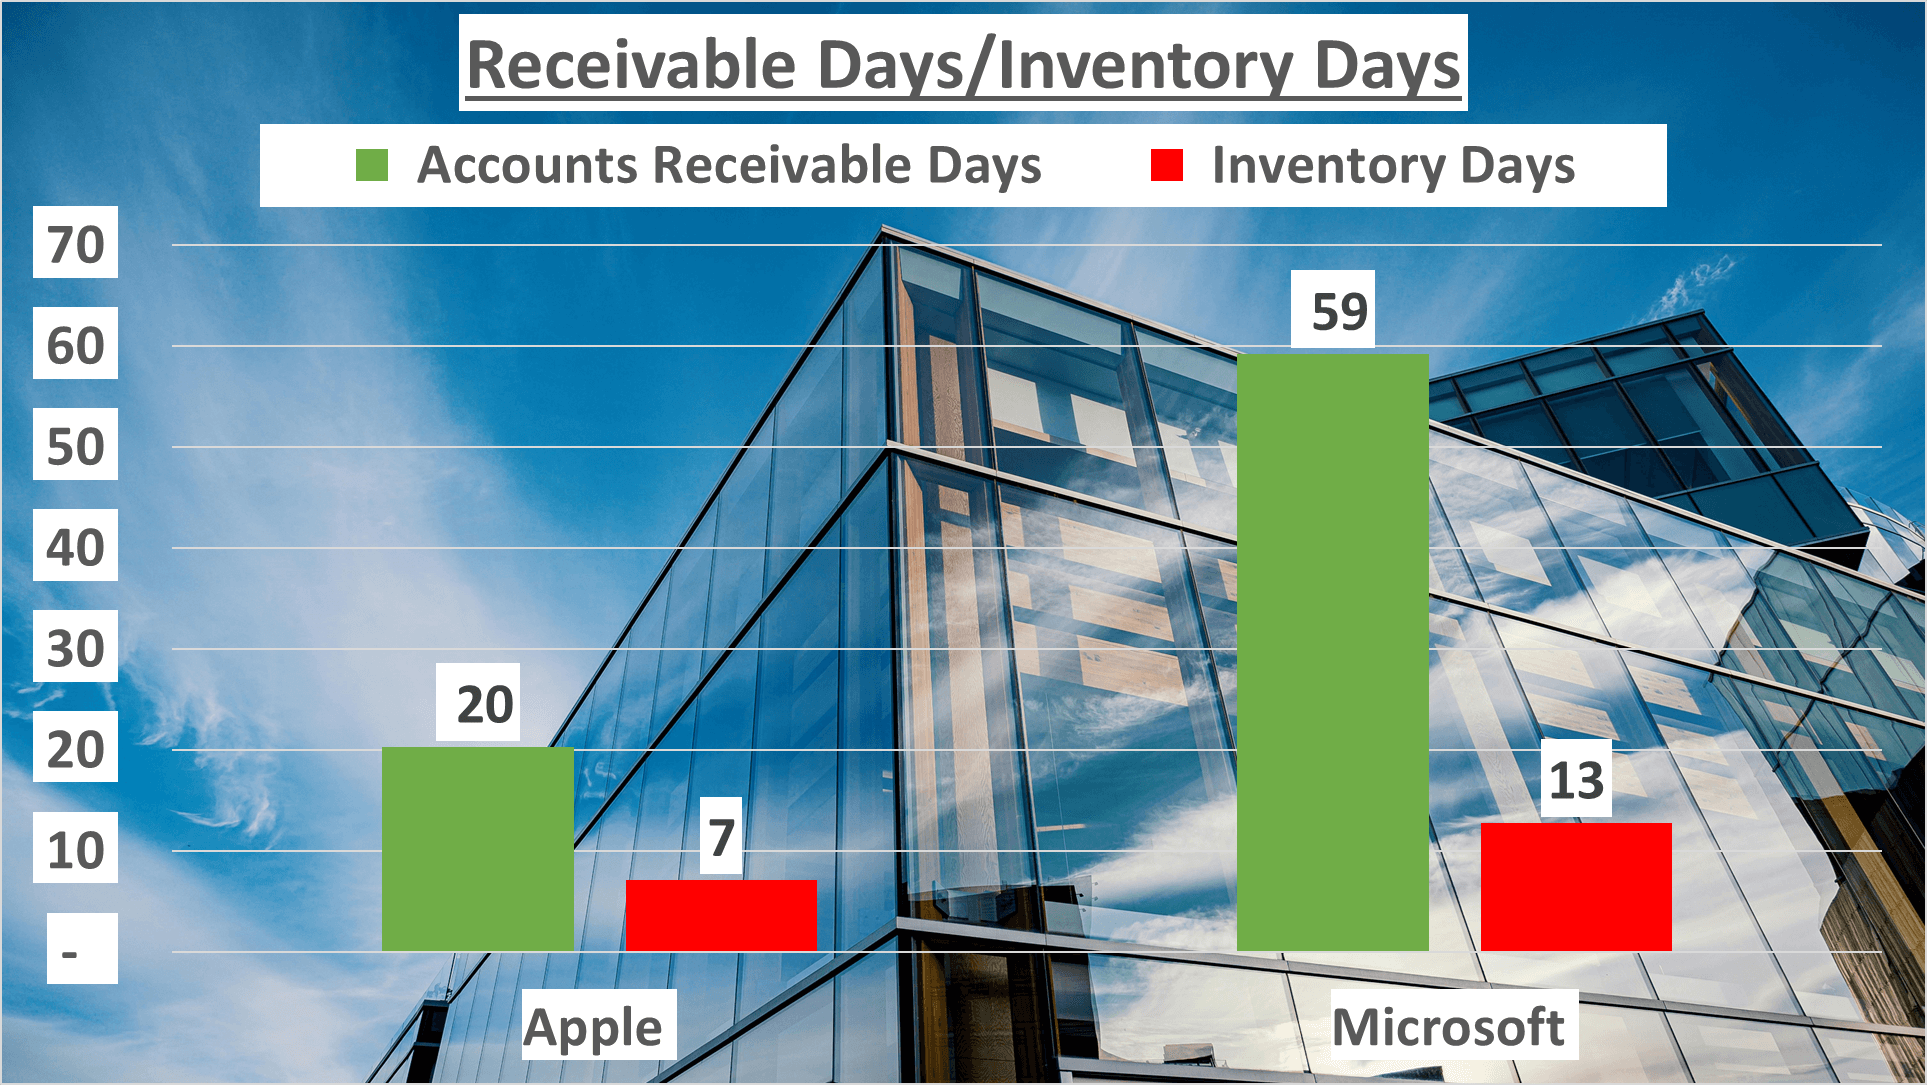
So, what’s the takeaway? While Microsoft may boast a higher profit margin, Apple showcases superior operational efficiency. It’s a compelling comparison, emphasizing the importance of these factors in assessing the financial health of these tech giants.
Cash Flow and ROE Analysis – Apple vs Microsoft Stock Analysis
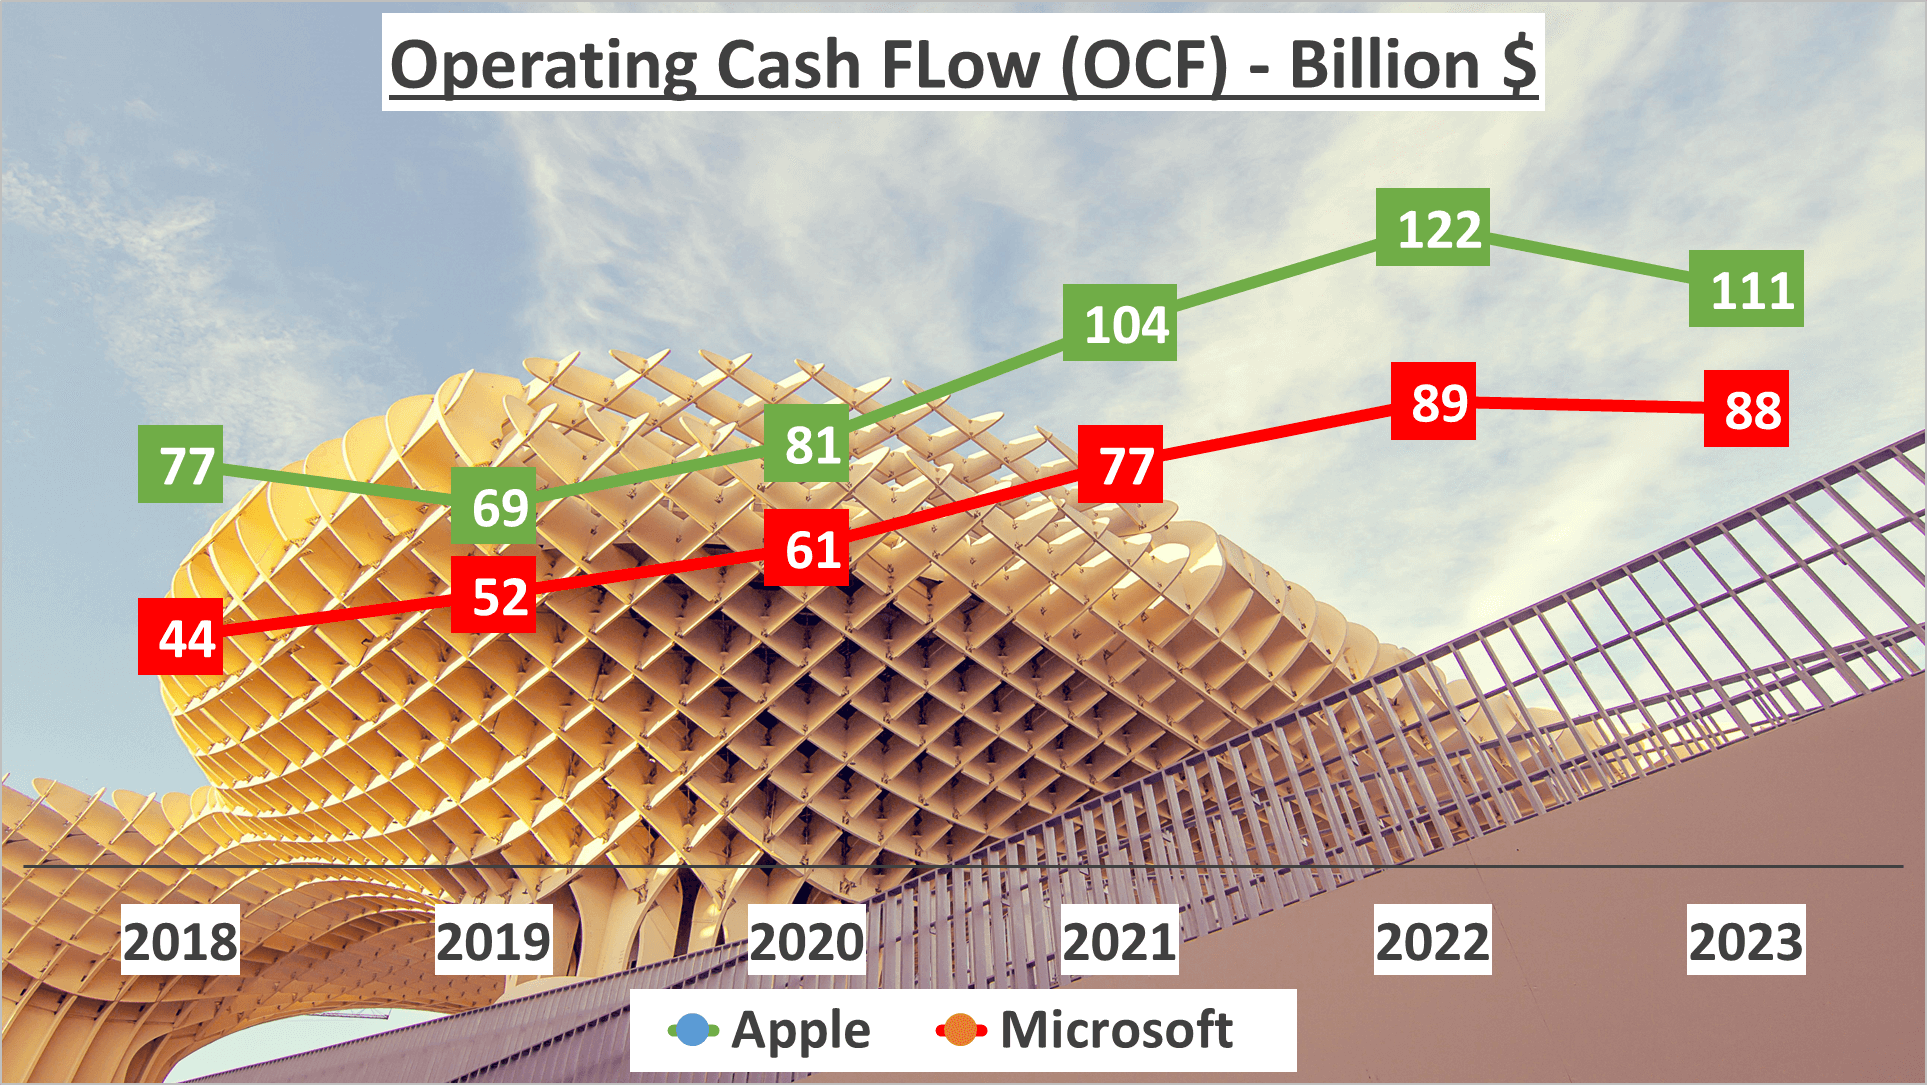
Opening: “Let’s explore cash flow and return on equity. Starting with cash flow analysis, in 2023, Apple generated an operating cash flow of $111B, while Microsoft generated $88B. This signifies the cash produced from core business operations, excluding capital expenditures.
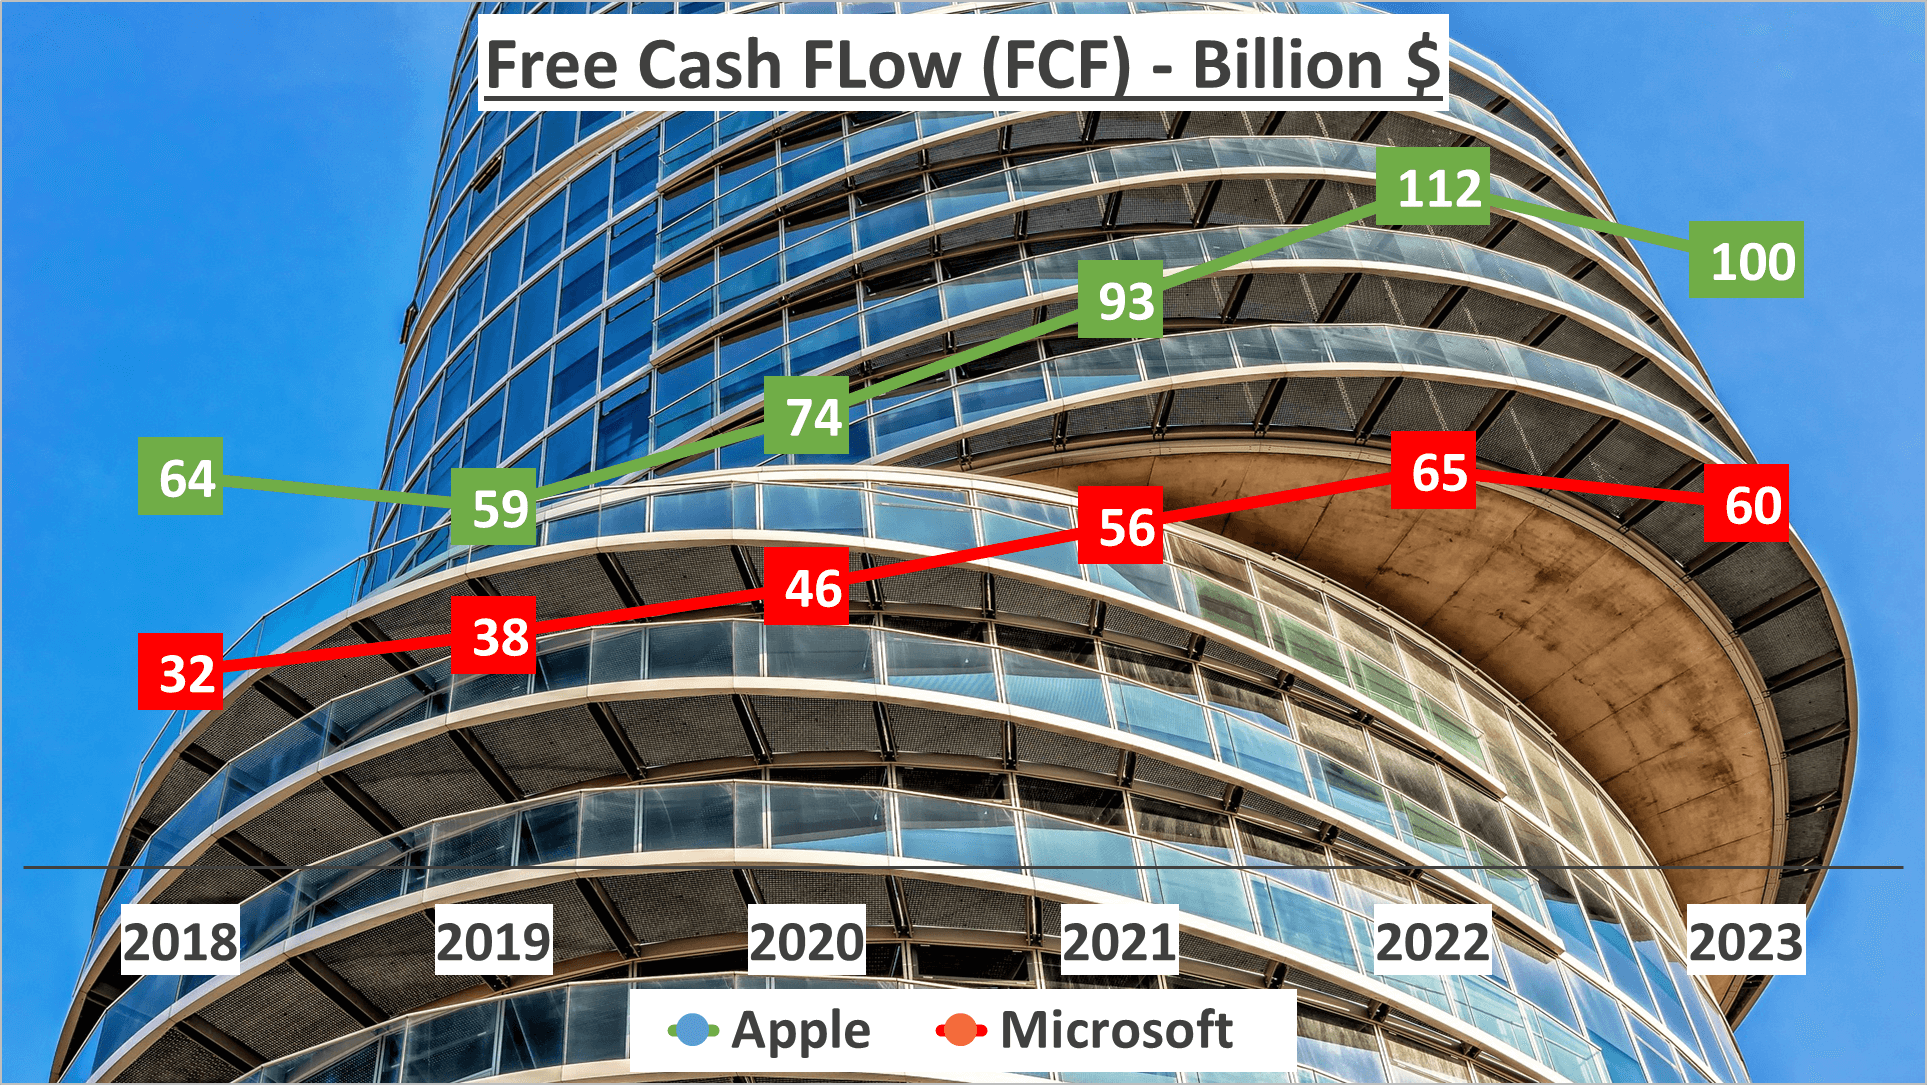
Deducting capital expenditures yields free cash flow. For Apple, it amounted to $100B, whereas Microsoft’s stood at $60B. This cash is available for investment in growth, dividends, or share buybacks.
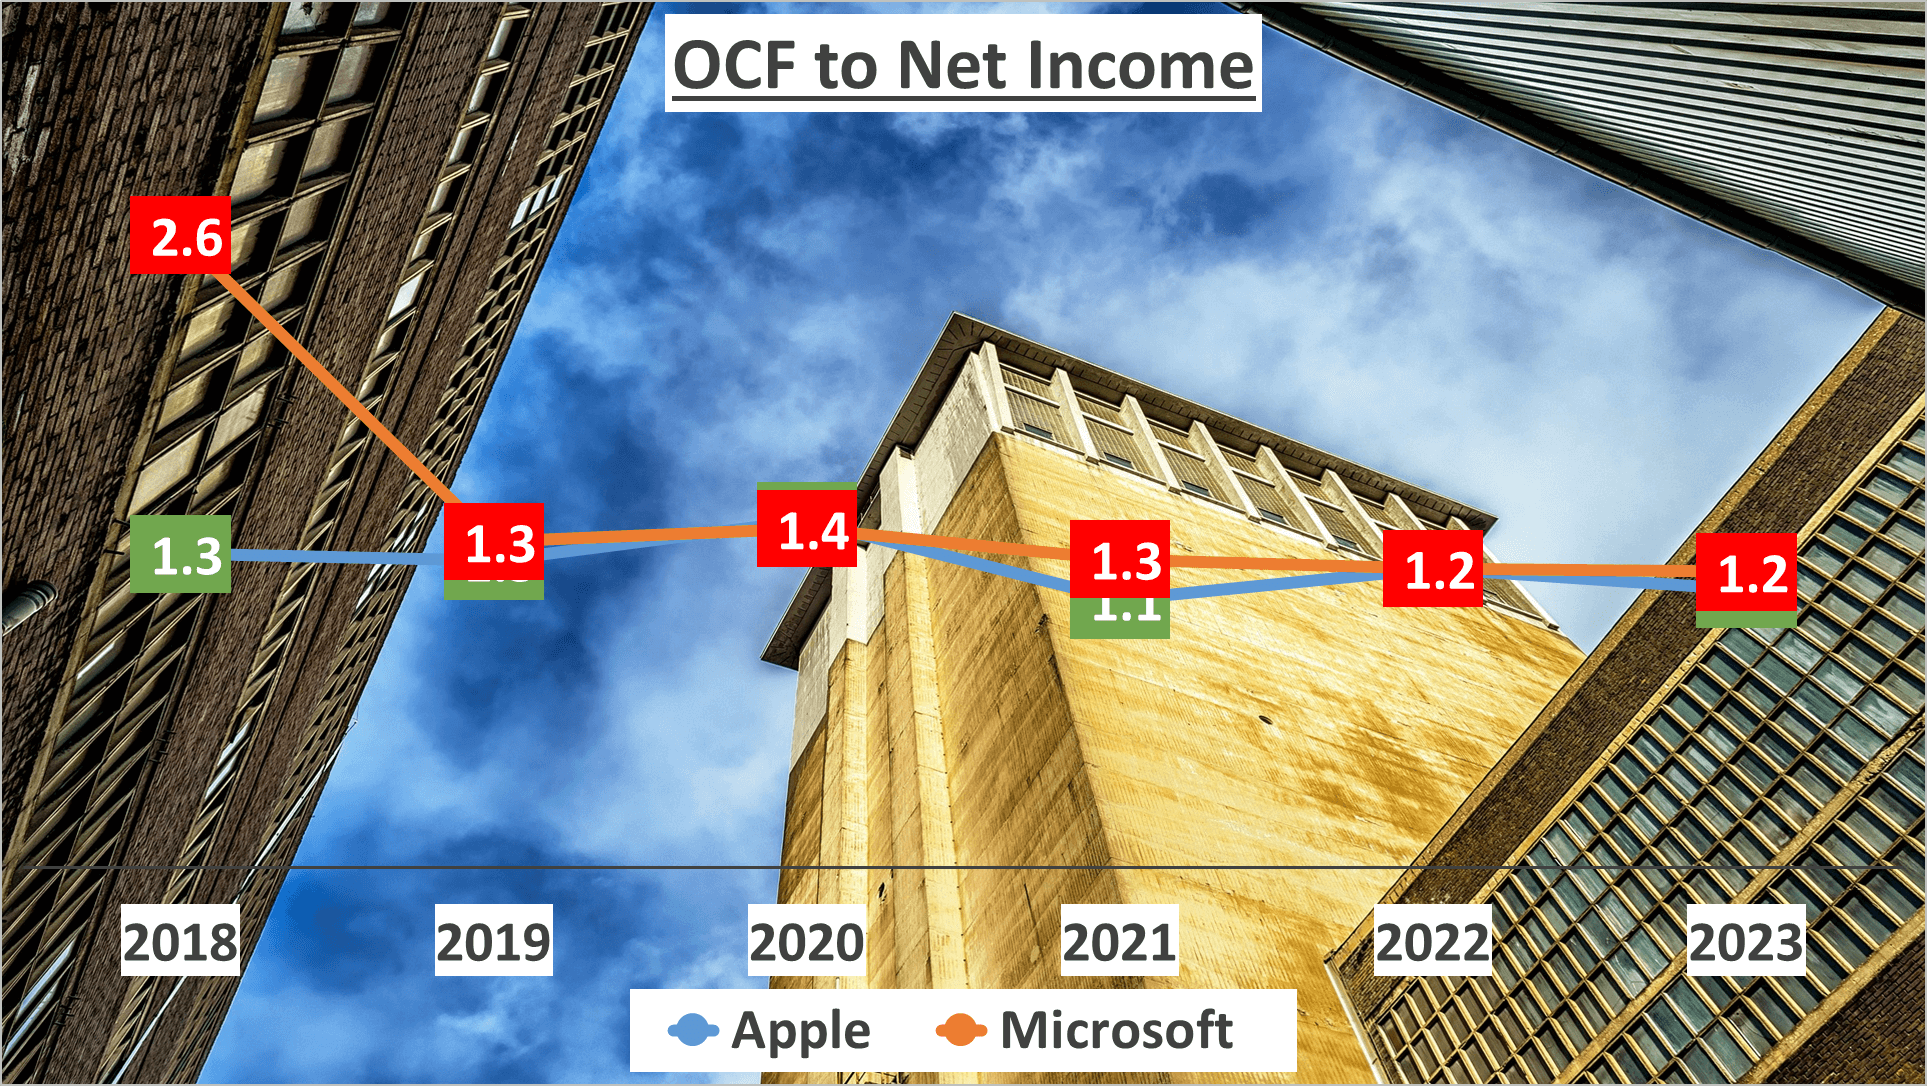
Examining the ability to convert net income into cash, indicated by the operating cash flow to net income ratio, Apple’s ratio is 1.1, slightly lower than Microsoft’s 1.2, suggesting both efficiently convert profits into cash flow.
Moving on to return on equity (ROE), a measure of financial performance, calculated by dividing net income by shareholders’ equity. In 2023, Apple’s ROE soared to 208%, propelled by a net profit margin of 25%, an asset turnover of 1.45, and an asset to equity ratio of 5.67. In contrast, Microsoft’s ROE stood at 47%, driven by a higher net profit margin of 34%, albeit with a lower asset turnover of 0.73 and asset to equity ratio of 2.
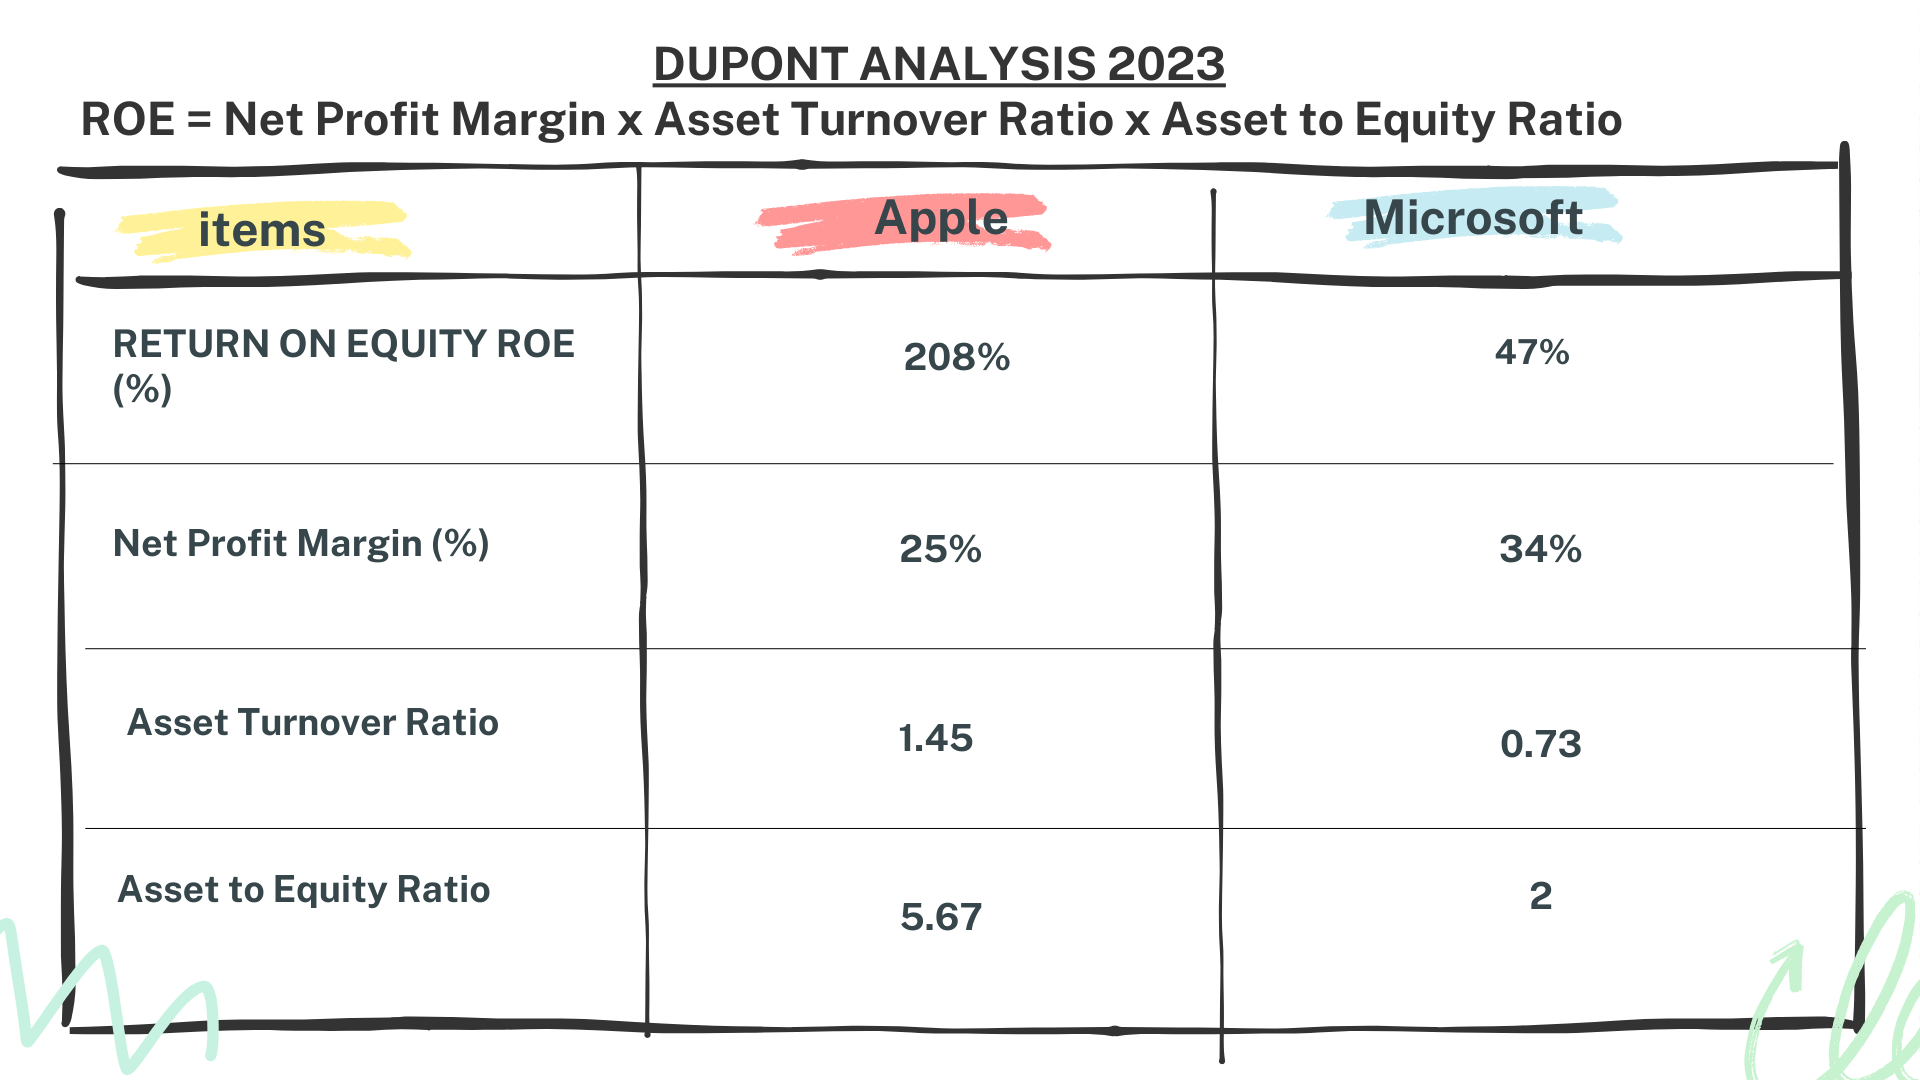
Closing: “Apple’s high ROE stems from its robust asset to equity ratio, largely driven by its dividend and share buyback policy, reducing the equity base and amplifying return on equity. Consider this when comparing the ROE of these tech giants.
Conclusion – Apple vs Microsoft Stock Analysis
Determining a clear winner in this financial showdown is challenging. Both Apple and Microsoft showcase robust financial performances. Apple, boasting a total revenue of $383B and a net profit of $97B in 2023, demonstrates impressive growth despite recent slowdowns.
Conversely, Microsoft maintains consistent growth, with a total revenue of $212B and a net profit of $72B, supported by a five-year Compound Annual Growth Rate of 14%.
Regarding profitability, Microsoft holds an edge with a higher net profit margin. However, Apple’s operational efficiency shines through with shorter inventory and accounts receivable days.
In essence, both tech giants display solid financial health and promising growth trajectories. While each has its strengths and weaknesses, understanding these financial metrics is essential for informed investment decisions.
Author: investforcus.com
Follow us on Youtube: The Investors Community
