Dell vs IBM Stock Analysis – Curious about how the financials of tech giants Dell and IBM stack up against each other? You’re not alone. Investors, analysts, and tech enthusiasts alike often find themselves intrigued by the fiscal health of these two industry titans.
And for good reason. A comprehensive understanding of a company’s financial strengths and weaknesses can offer invaluable insights for potential investors, guiding them towards more informed decisions.
In today’s discussion, we embark on a comparison between Dell and IBM, analyzing their financial performance across various key parameters. We’ll scrutinize their revenues and their evolution over time, dissecting the composition of these revenues, and evaluating their profitability through gross and net profit margins.
Assets serve as the backbone of any enterprise, so we’ll delve into the total assets held by each company and their changes over time. However, it’s not merely about the quantity of assets; it’s also about their liquidity and their ability to be converted into cash if needed. Therefore, we’ll explore key liquidity ratios as well.
Operational efficiency is another critical determinant of success, so we’ll closely examine the inventory and accounts receivable days for both Dell and IBM. And given that cash flow is paramount, we’ll assess the cash flow generated by their operational activities.
Lastly, we’ll gauge the return on equity for both companies, a pivotal metric providing insight into a company’s profitability relative to the equity invested in it.
So, fasten your seatbelts as we dive into the numbers and uncover what they reveal about these two tech powerhouses.
Revenues and Revenue Structure – Dell vs IBM Stock Analysis
Let’s begin by examining the revenue streams of Dell and IBM to gain insights into their financial performance.
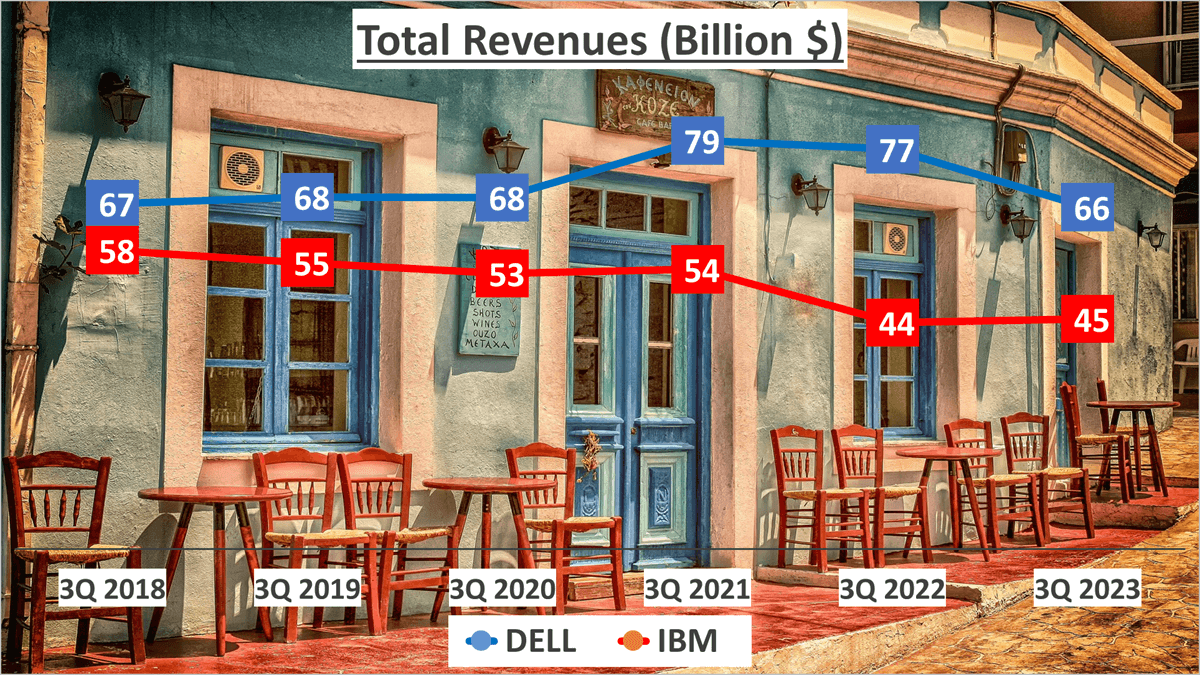
Dell reported total revenues of $66B for the first three quarters of 2023. However, a review of their performance over the past five years reveals a Compound Annual Growth Rate (CAGR) of -0.2%, indicating a slight decline in revenues. Similarly, IBM recorded total revenues of $45B for the same period in 2023, with a five-year CAGR of -5%.
Now, let’s dissect the revenue composition:
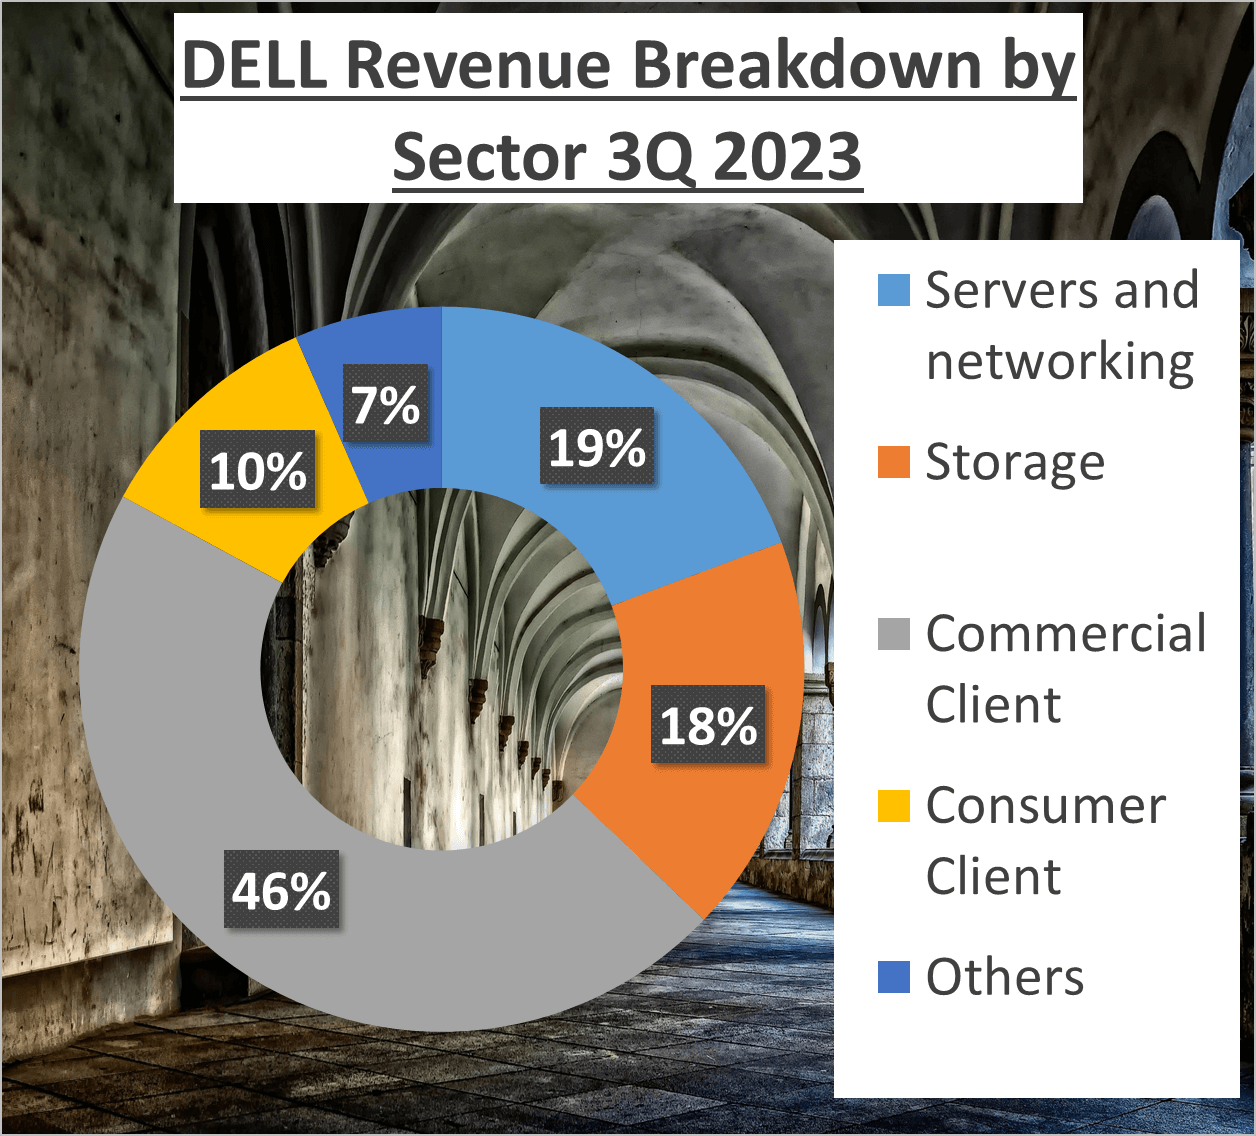
For Dell, approximately 46% of revenue is derived from the Commercial Client division, with Servers and networking contributing 19%, and Storage accounting for 18%. The remaining 17% is allocated among Consumer Client and other segments.
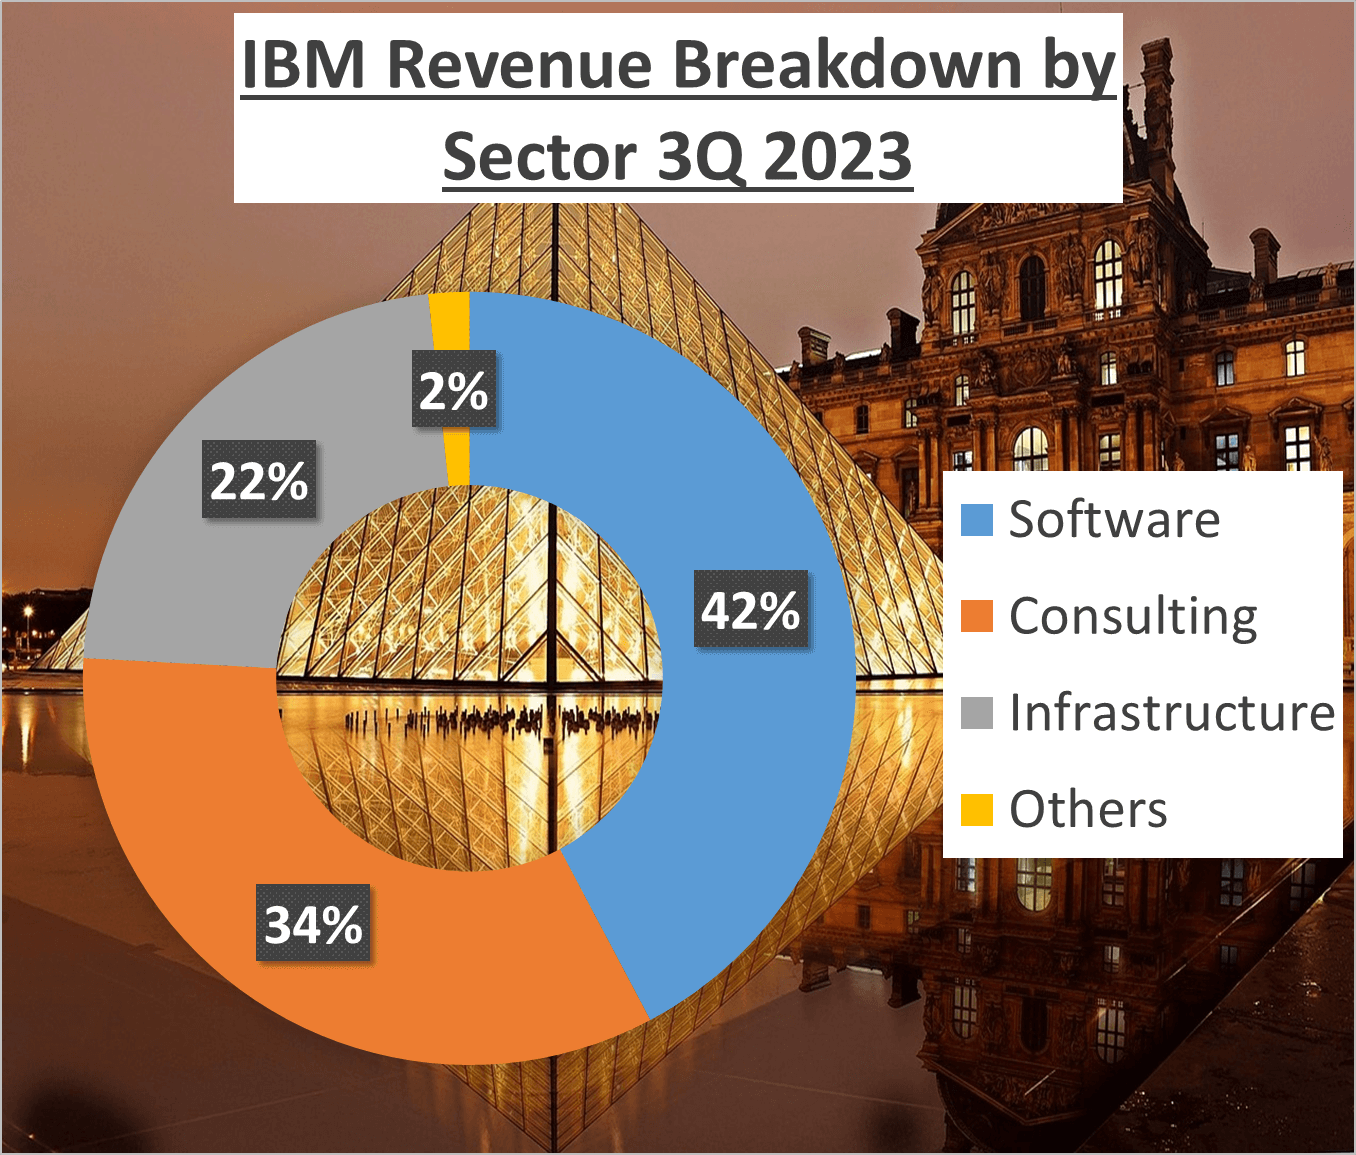
In contrast, IBM heavily relies on its Software division, which contributes 42% of total revenue. Consulting follows closely, contributing 34%, while Infrastructure and other sectors make up the remaining 24%.
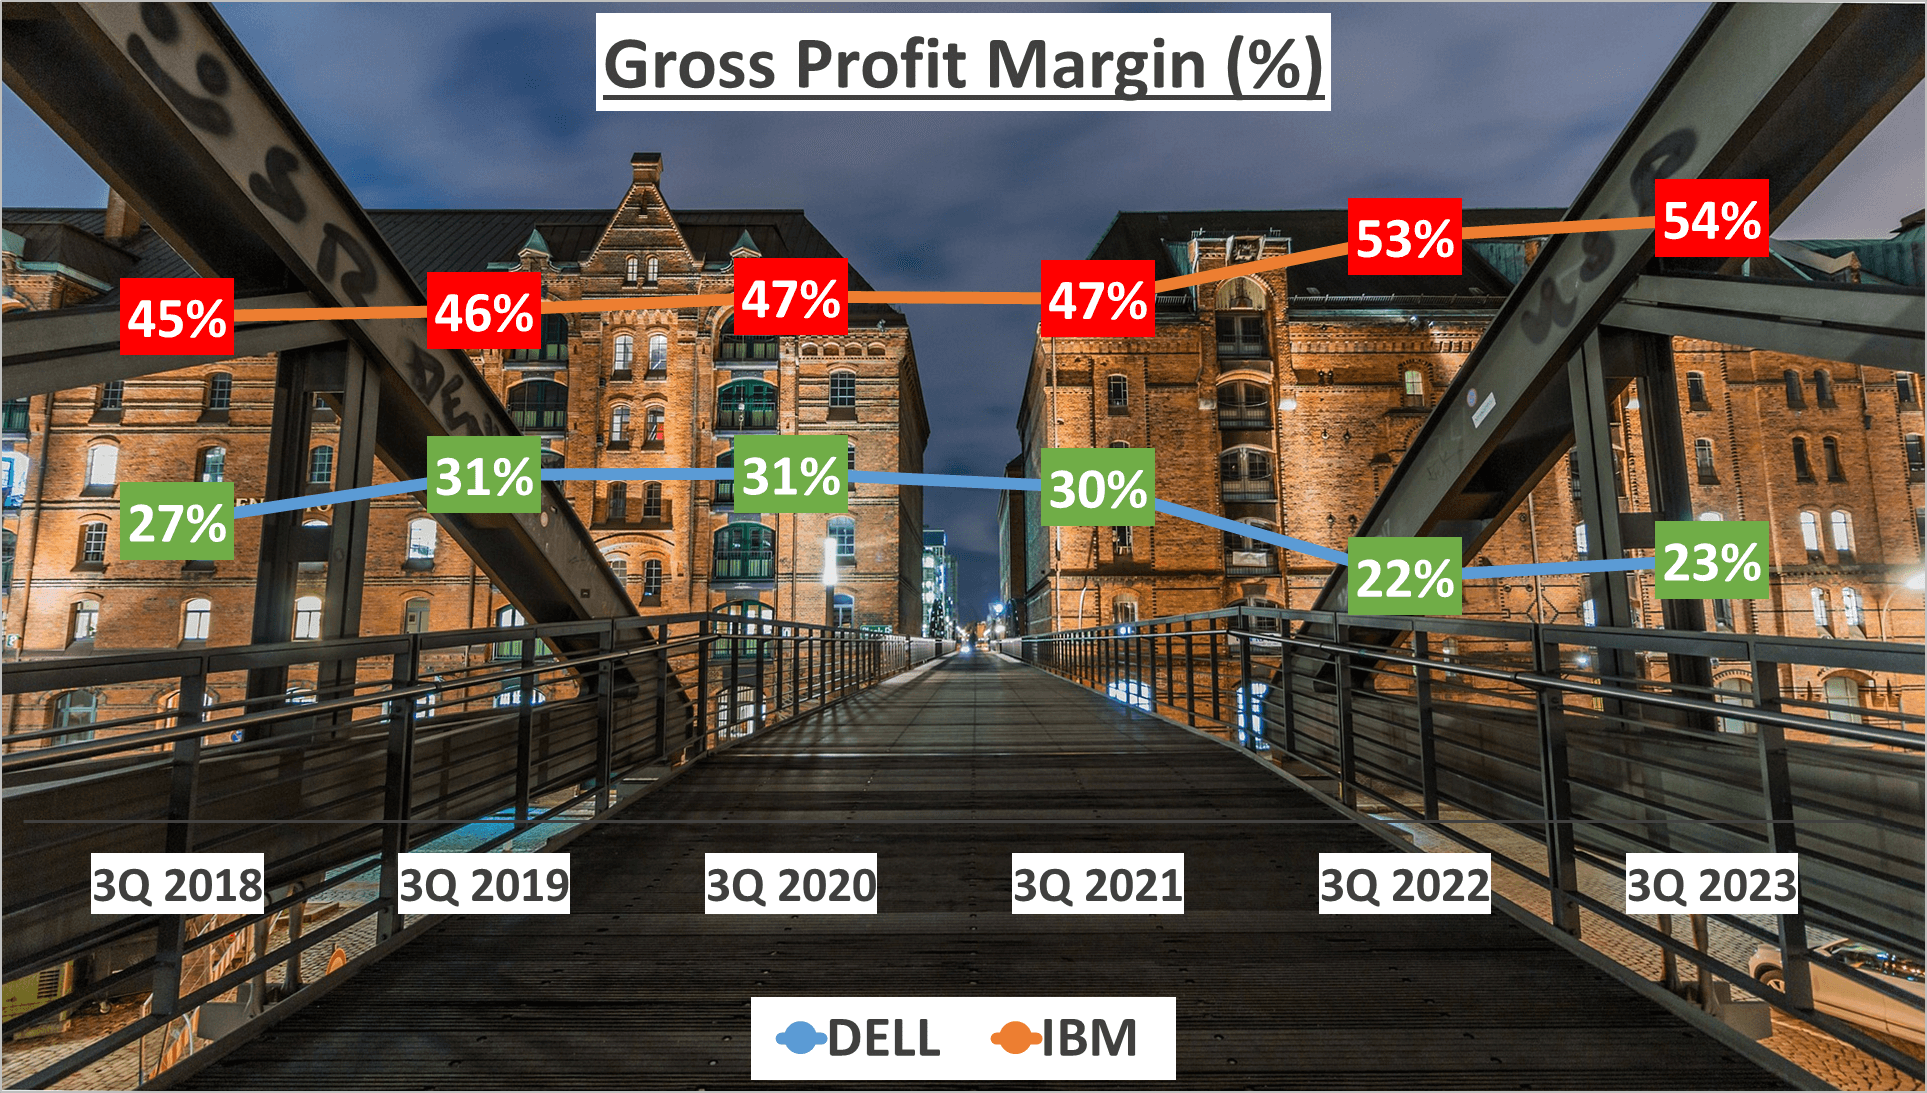
However, revenue alone doesn’t paint the full picture. It’s crucial to assess how much of these revenues translate into profits. Dell’s Gross Profit Margin for the first three quarters of 2023 was 23%, slightly lower than the five-year average of 27%. In contrast, IBM boasted a Gross Profit Margin of 54%, surpassing their five-year average of 49%.
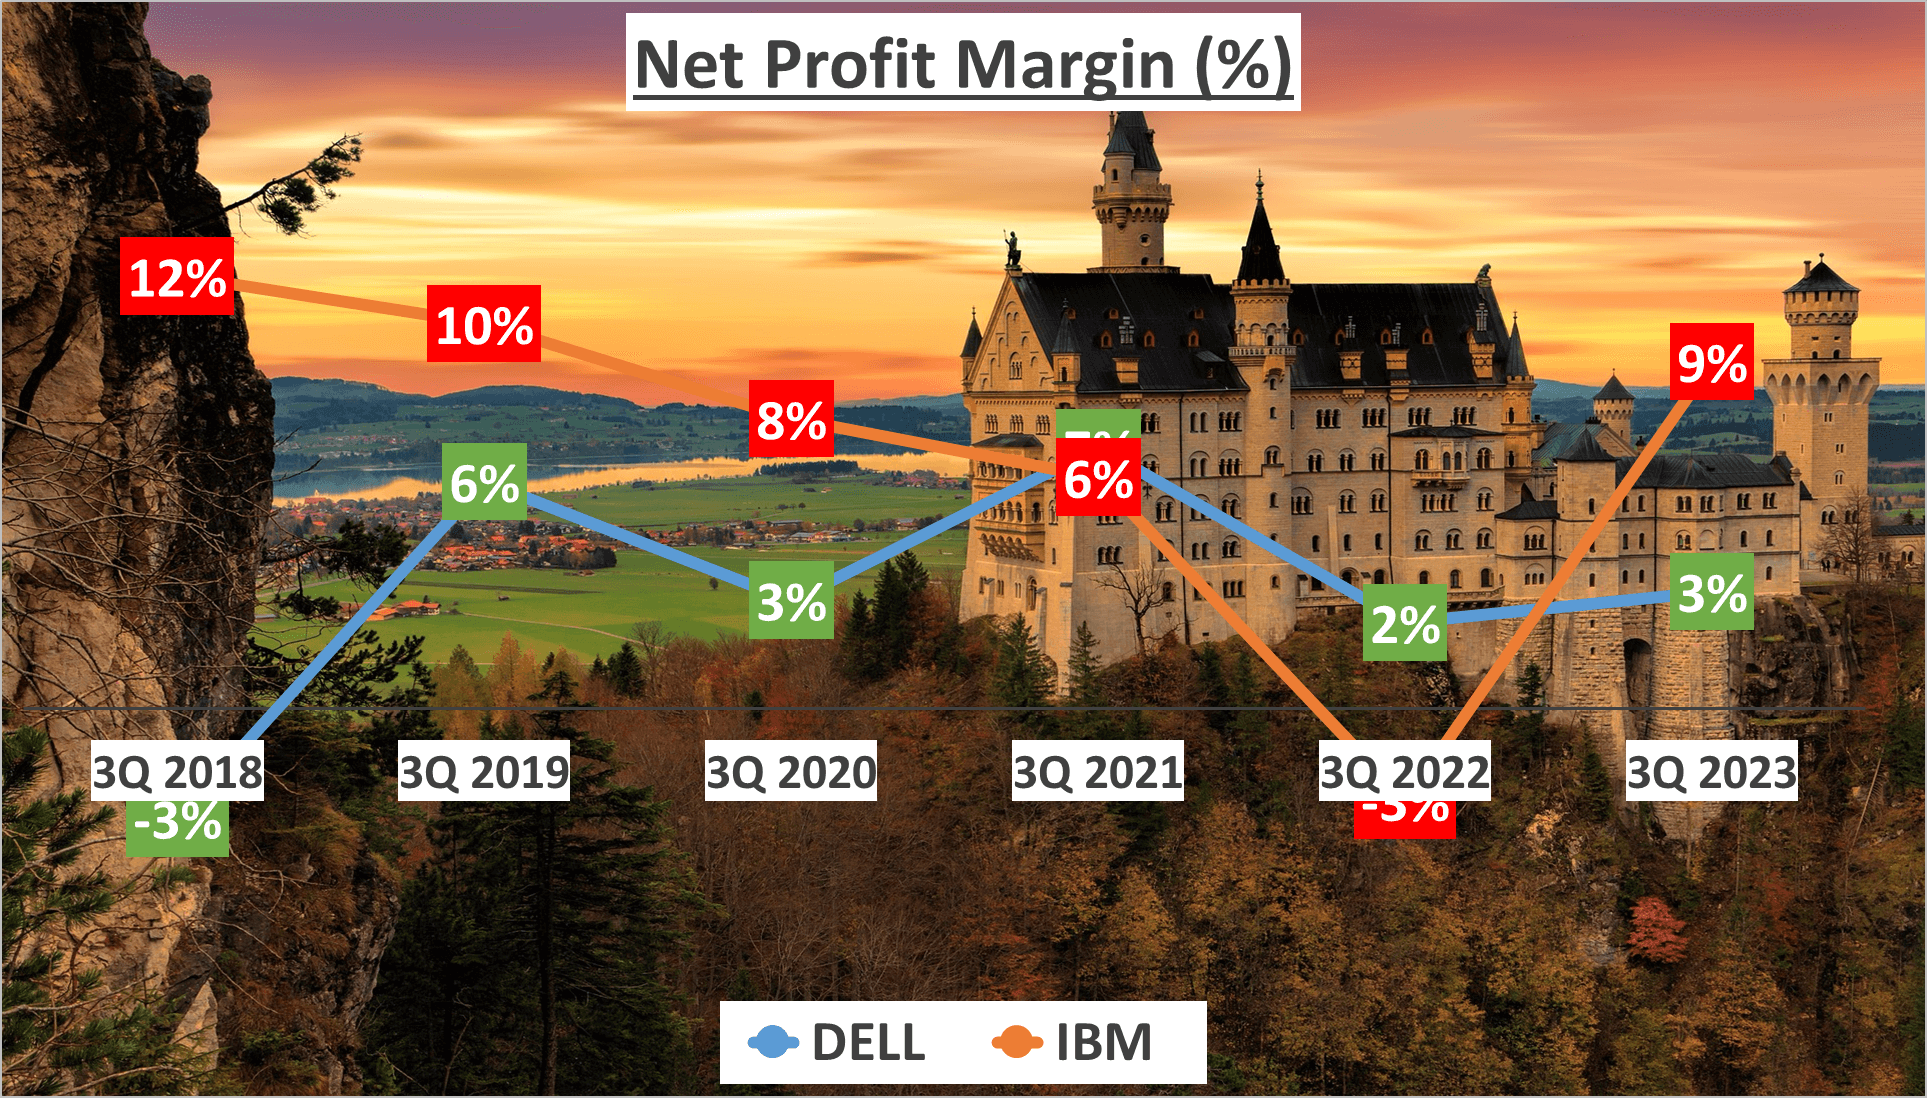
Moving on to Net Profit Margin, Dell stands at 3%, consistent with their five-year average, while IBM’s Net Profit Margin of 9% shows a slight improvement over their five-year average of 7%.
In the next section, we’ll delve into the profitability analysis to understand how much of the revenue is actually converted into profit.
Profitability Analysis – Dell vs IBM Stock Analysis
While these numbers provide valuable insights, focusing solely on margins tells only part of the story. Dell’s net profit for the first three quarters of 2023 amounted to $2.1B, marking a significant turnaround from the negative $2B in 2018. Conversely, IBM’s net profit declined from $6.8B in 2018 to $4.2B in 2023.

In essence, Dell has successfully reversed its net profit trajectory from negative to positive, whereas IBM, despite boasting a higher gross profit margin, faced a decline in net profit over the past five years. This divergence underscores the contrasting paths the two tech giants are on, with Dell making notable strides in profitability while IBM encounters challenges.
These figures emphasize that while margins are crucial, the ultimate test of a company’s profitability lies in its final net profit, which factors in all expenses, taxes, and other variables.
Now that we’ve examined profitability, let’s shift our focus to the assets of these companies.
Assets and Liquidity – Dell vs IBM Stock Analysis
Let’s assess how effectively Dell and IBM manage their assets and liquidity.
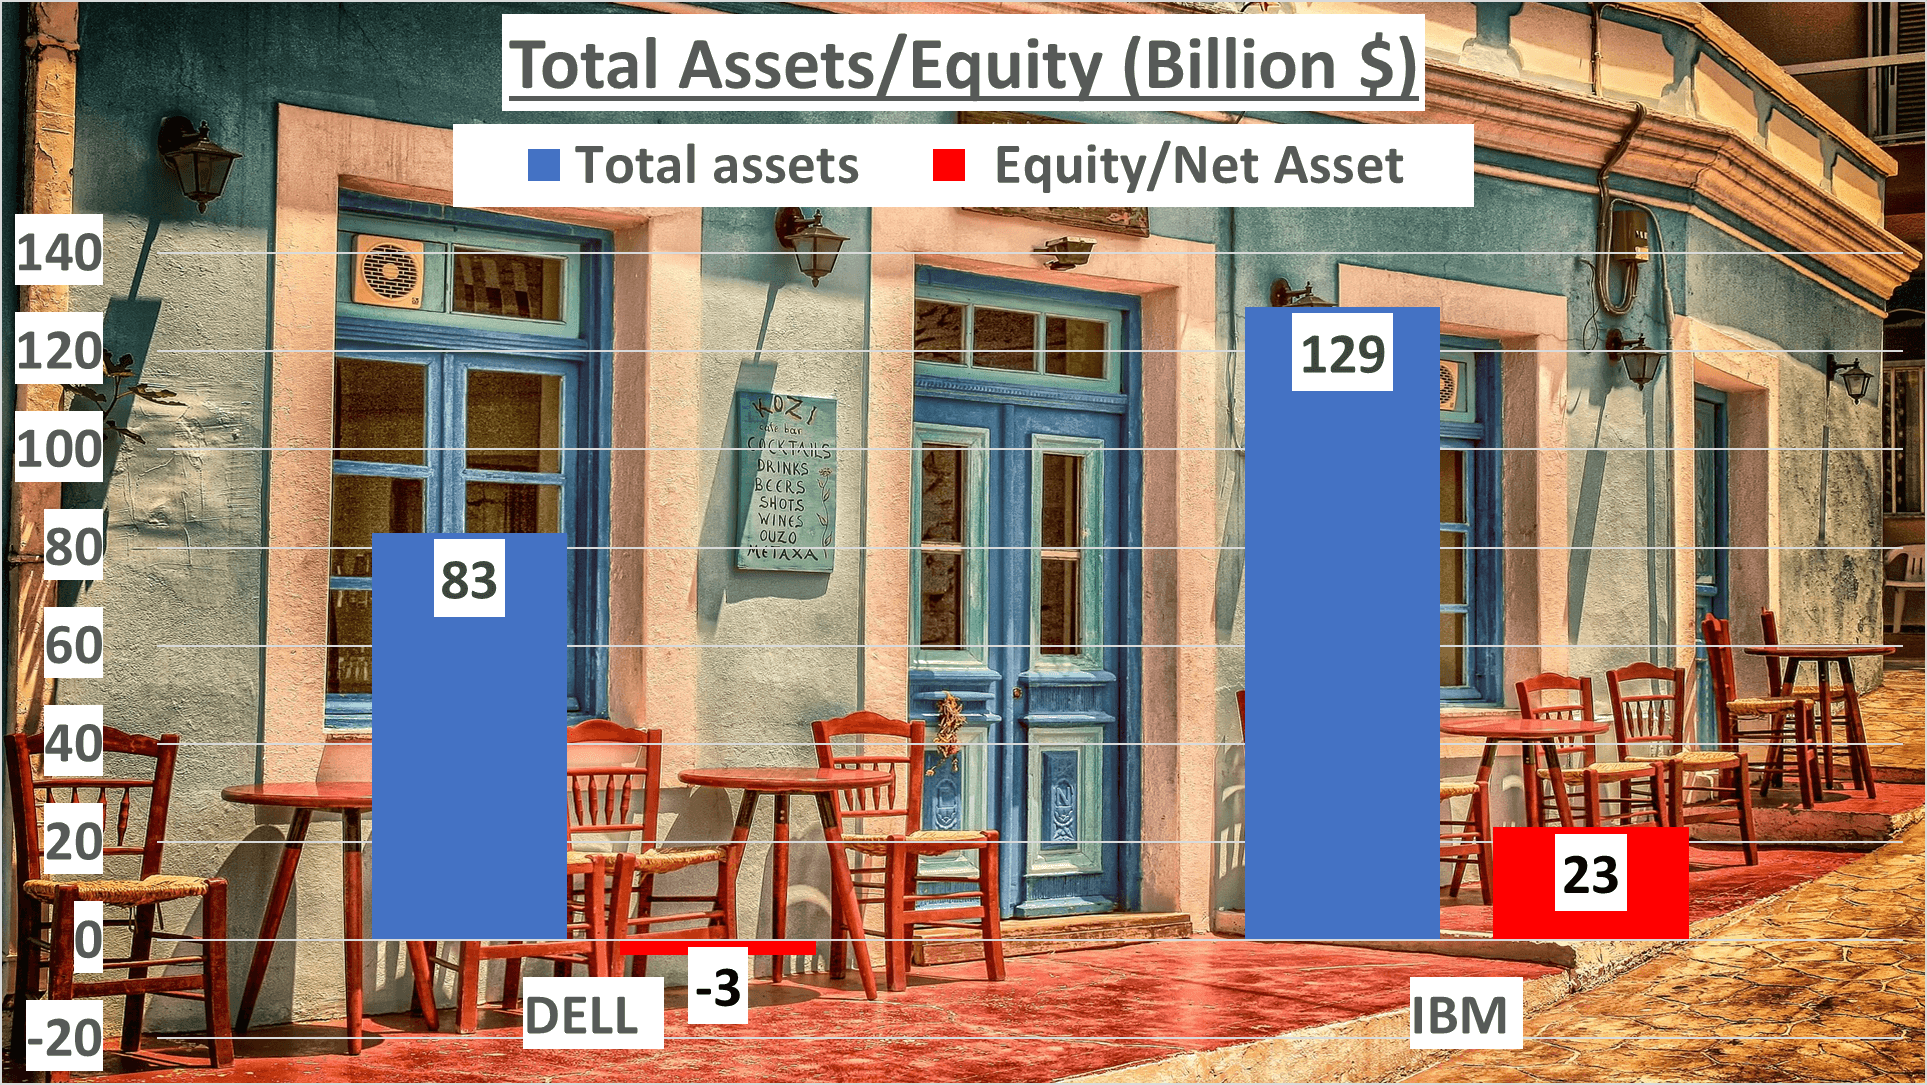
A glance at the balance sheets of Dell and IBM reveals notable disparities. By the end of the third quarter of 2023, Dell’s total assets amounted to $83B, whereas IBM’s total assets reached $129B. However, the net assets present a contrasting narrative. Dell’s net assets were negative, at -$3B, while IBM’s net assets were positive, at $23B.
Turning to liquidity, a critical measure of a company’s ability to fulfill short-term obligations, we observe further distinctions. Dell’s current ratio, comparing current assets to current liabilities, stood at 0.76, whereas IBM’s was 0.91, suggesting IBM’s slightly superior capability to settle short-term liabilities with short-term assets.
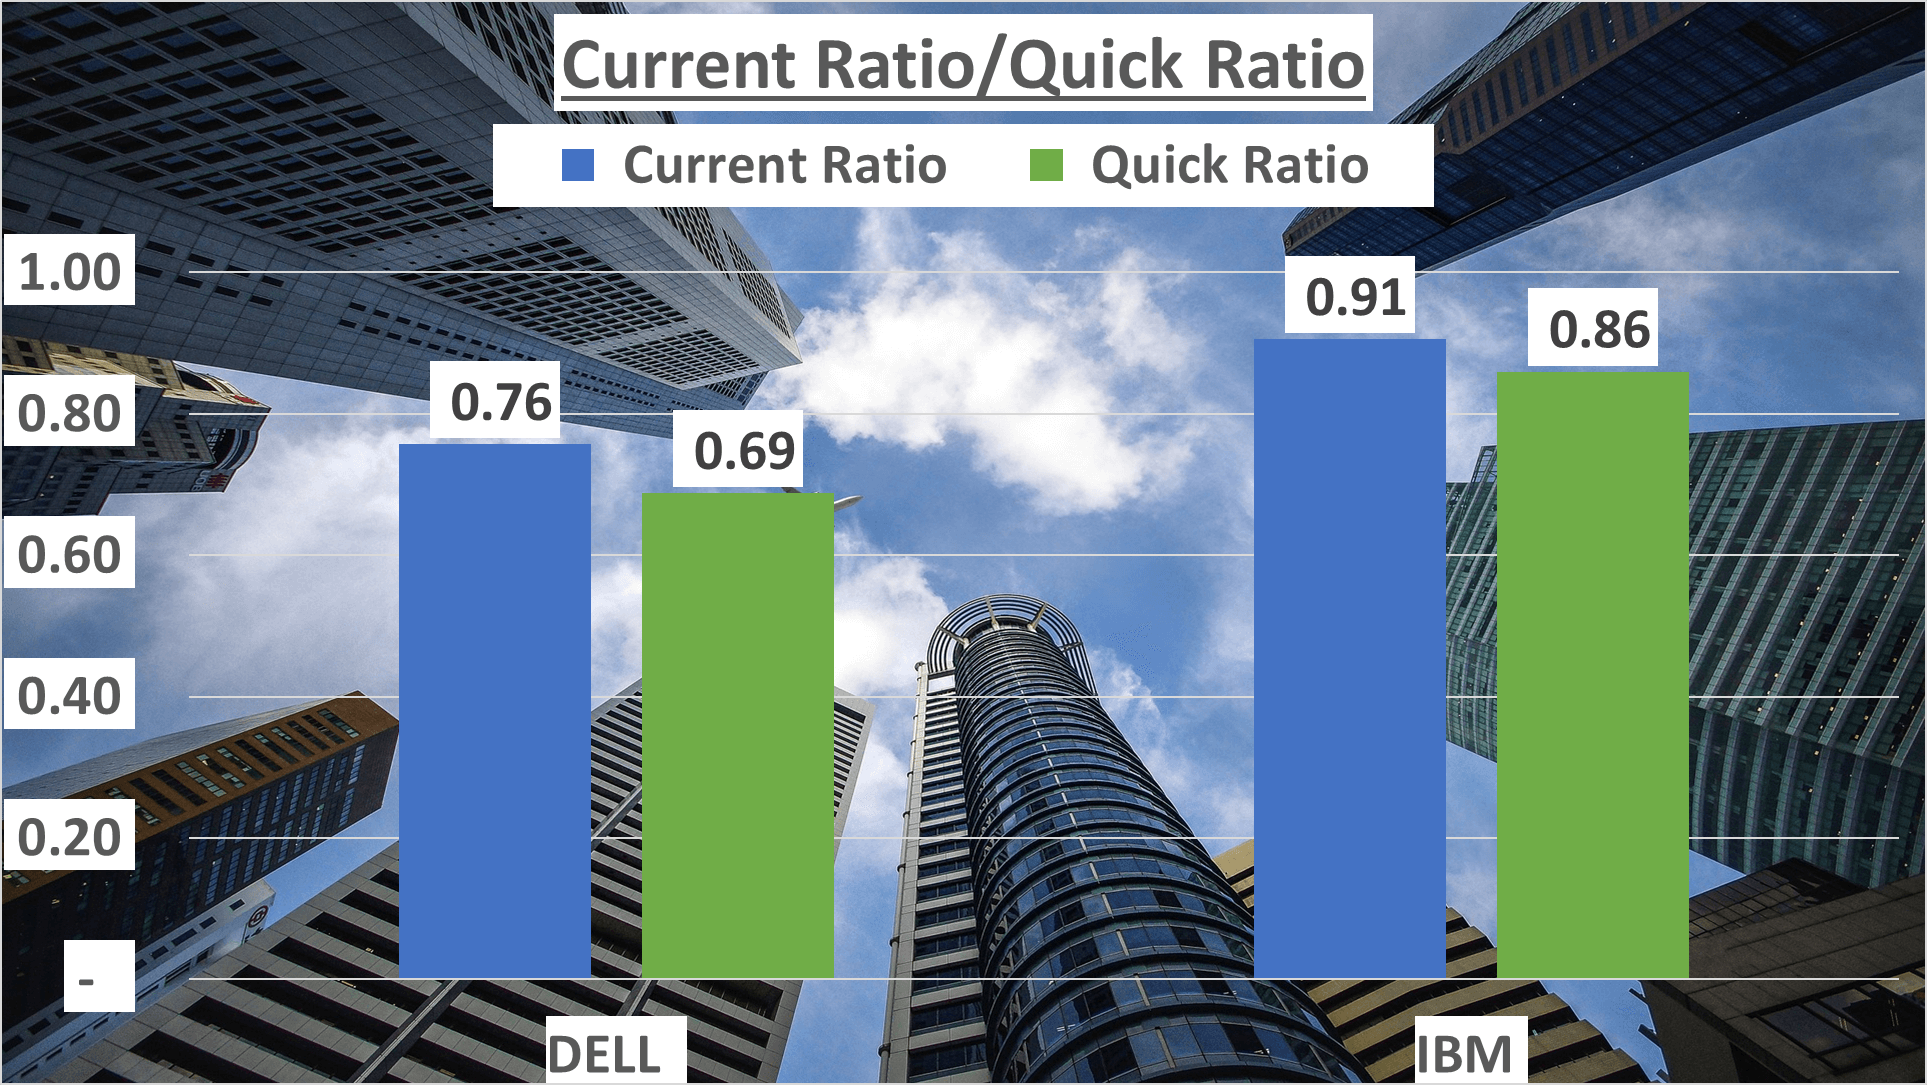
Now, let’s delve into the quick ratio, a more stringent liquidity metric that excludes inventories from current assets before comparing them to current liabilities. Dell’s quick ratio was 0.69, while IBM’s was 0.86, indicating that IBM has a better chance of meeting short-term obligations without relying on inventory sales.
In reviewing these figures, IBM seems to demonstrate stronger management of assets and liquidity. Nonetheless, it’s crucial to acknowledge that these metrics provide only a snapshot of a company’s financial well-being and don’t offer a comprehensive narrative.
Next, we’ll examine the operational efficiency of both companies to gain further insights into their performance.
Operational Efficiency and Cash Flow – Dell vs IBM Stock Analysis
Efficiency is paramount in business operations. So, how efficient are DELL and IBM? Both companies exhibit robust operational performance.
DELL swiftly turns over its inventory in 22 days, while IBM accomplishes this in just 19 days.
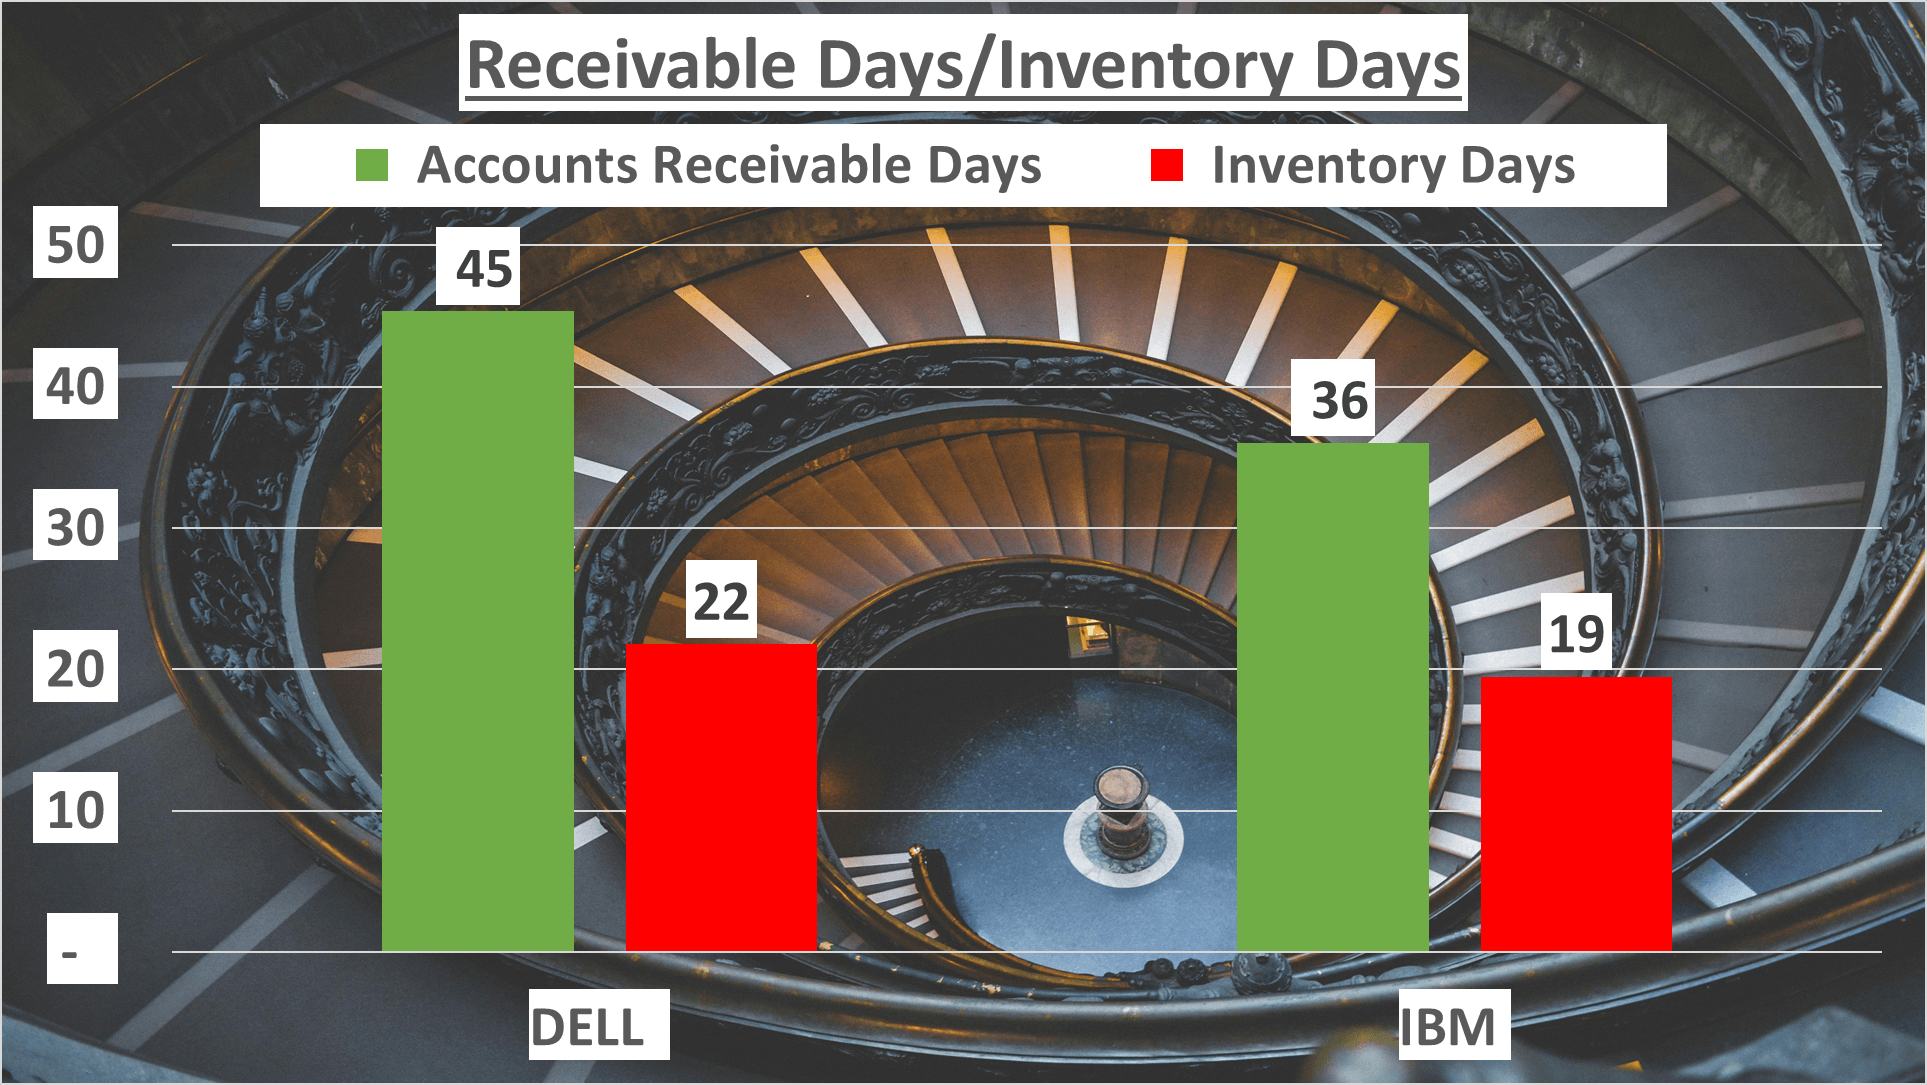
Regarding payment collection, DELL takes 45 days, whereas IBM takes 36 days.
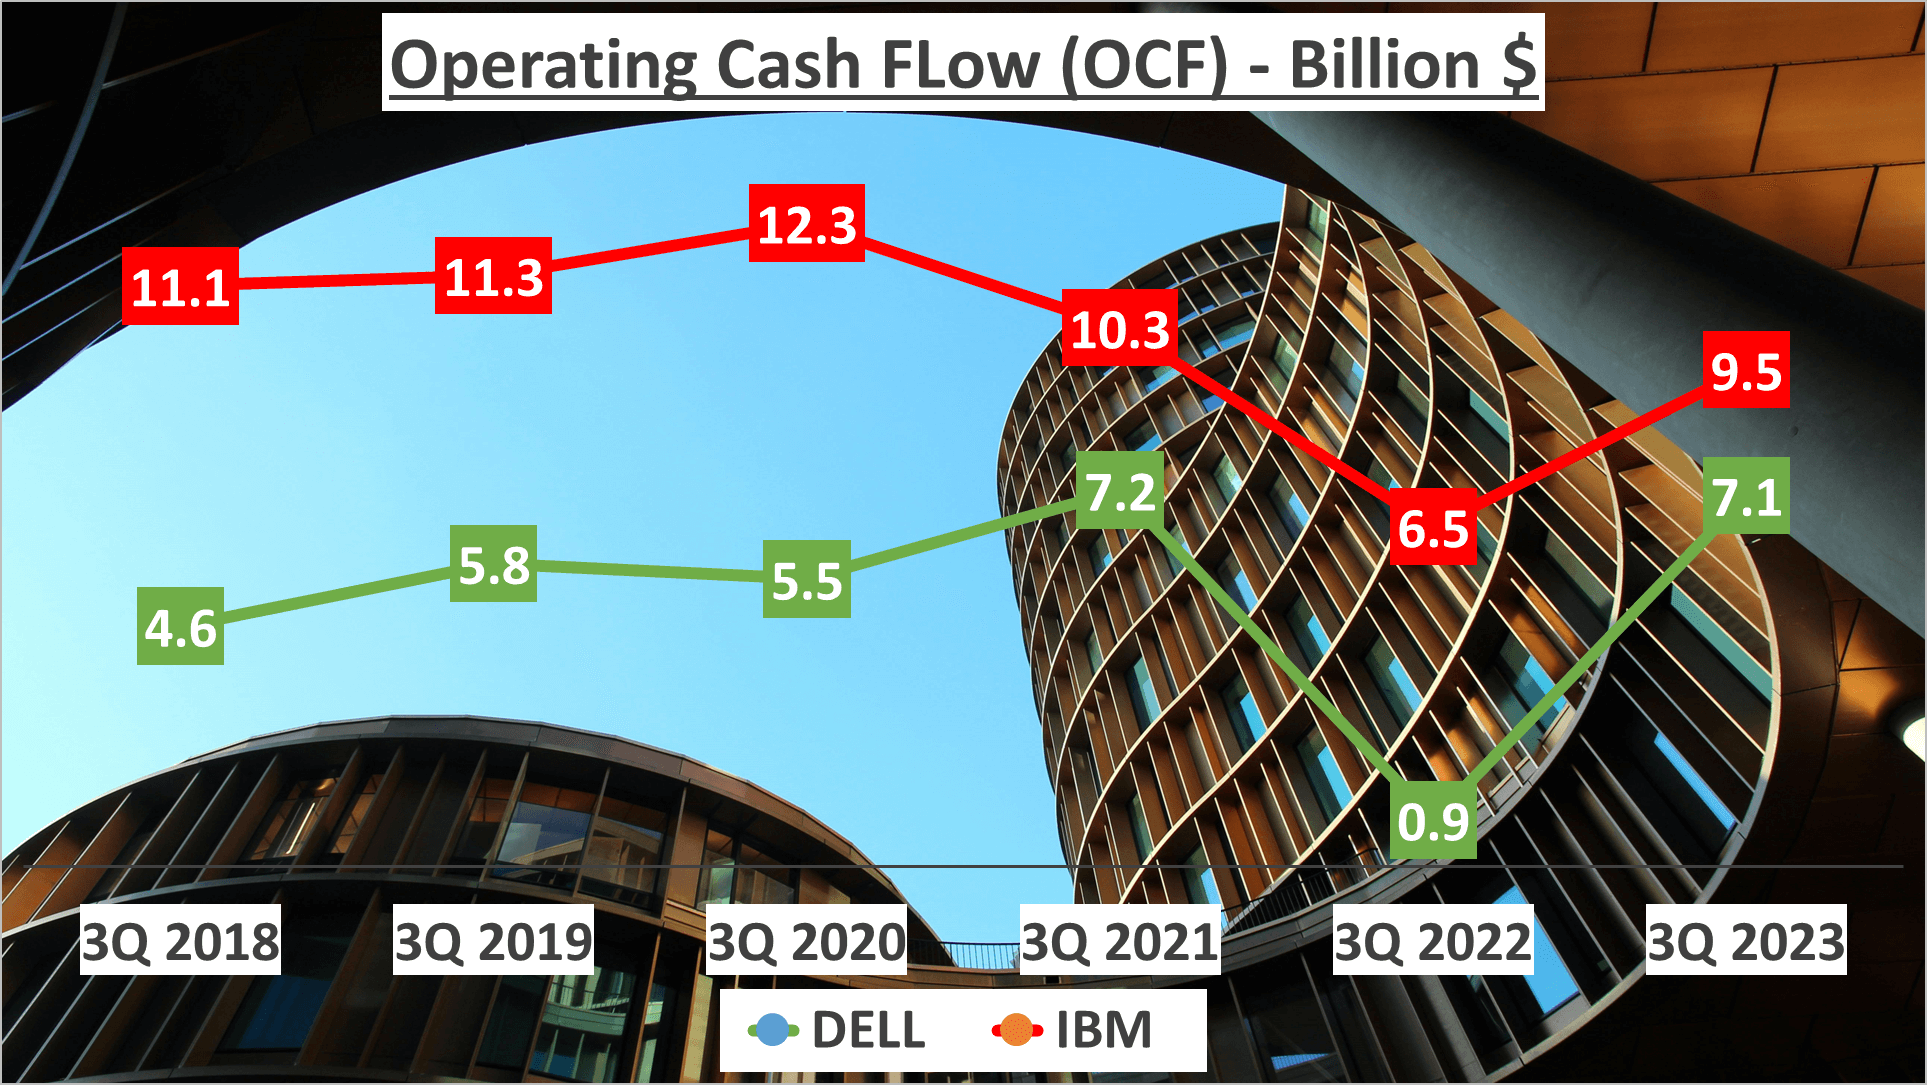
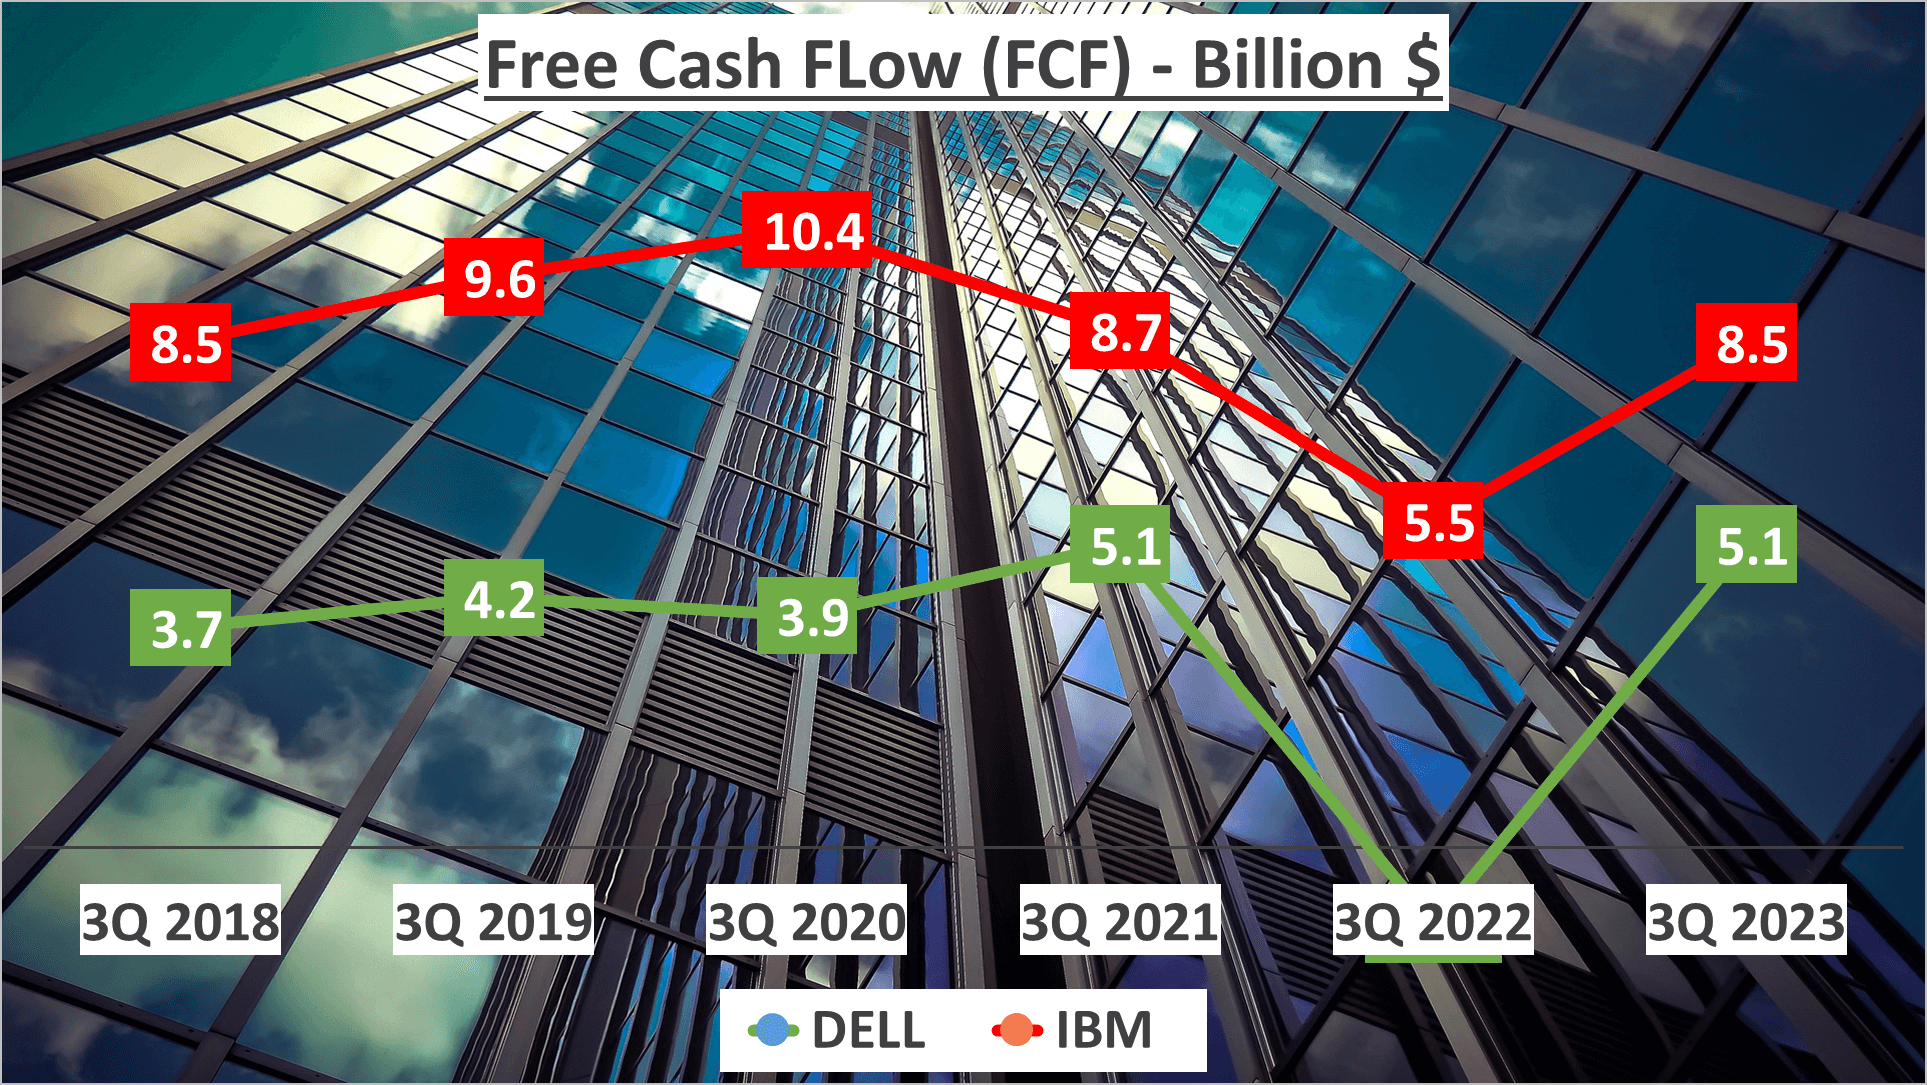
Now, let’s delve into cash flow, DELL boasts an operating cash flow of $7.1B and a free cash flow of $5.1B. In contrast, IBM reports an operating cash flow of $9.5B and a free cash flow of $8.5B.
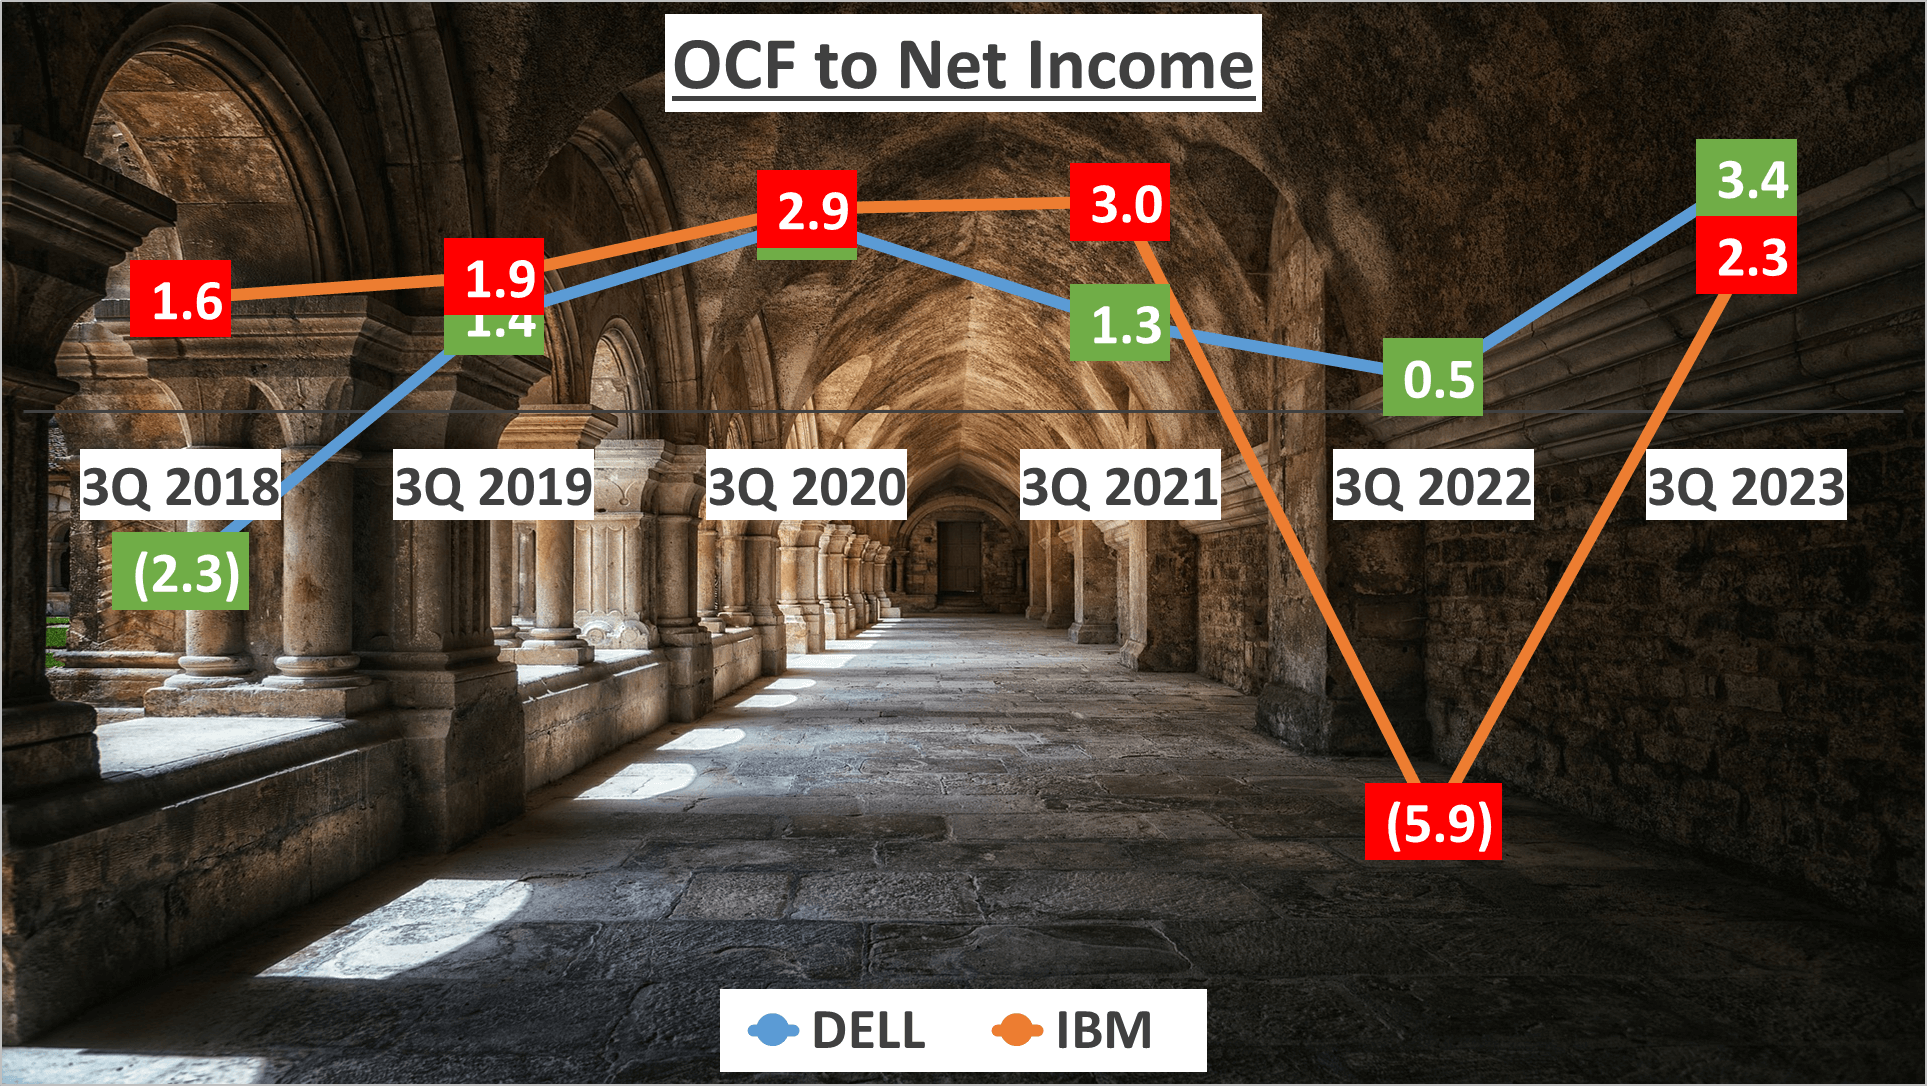
The ratio of operating cash flow to net income is a revealing metric. DELL’s ratio stands at 3.4, demonstrating healthy cash generation from operations relative to net income. IBM’s ratio is slightly lower at 2.3, yet it still signifies robust cash flow.
Return on Equity Analysis and Conclusion – Dell vs IBM Stock Analysis
The Return on Equity (ROE) is a crucial metric shedding light on a company’s profitability. So, what insights does it offer about DELL and IBM?
ROE, calculated by dividing net income by shareholder equity, showcases how effectively a company generates profit from shareholder investments.
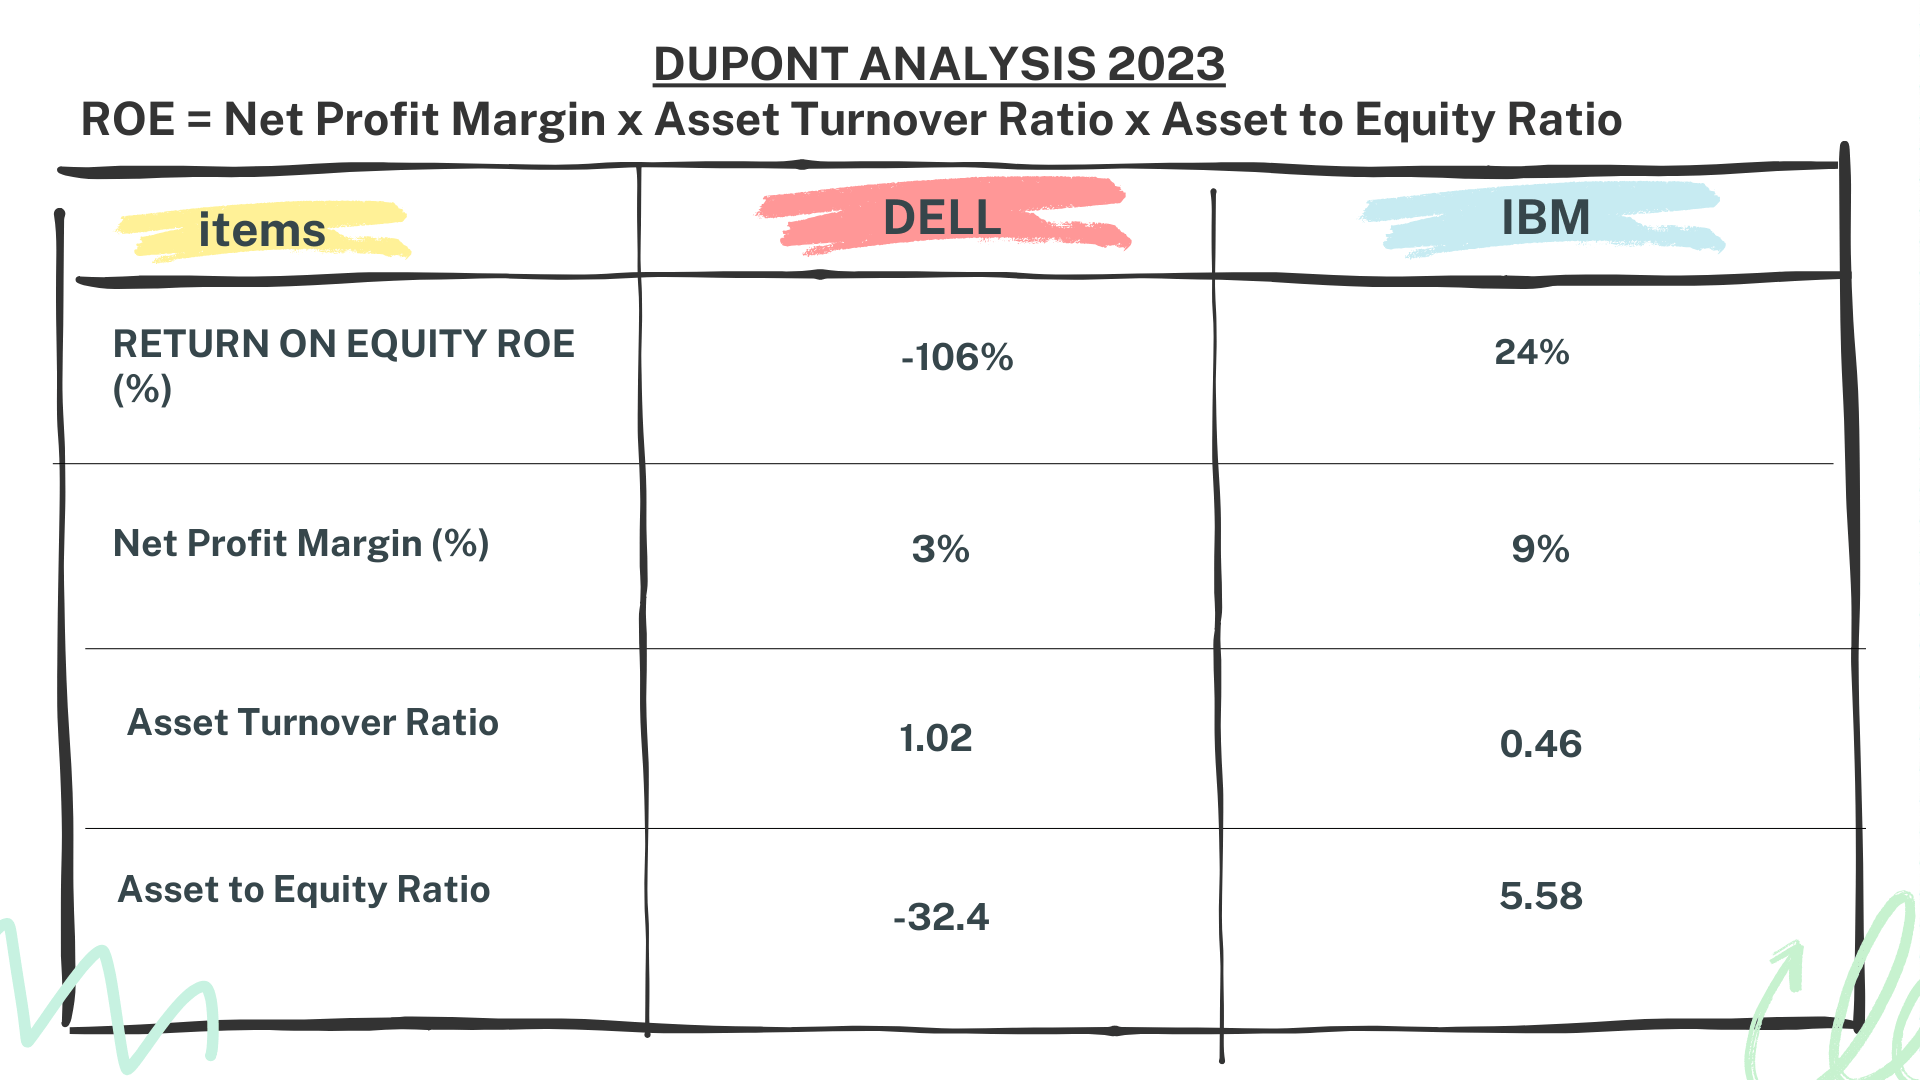
In the case of DELL, their ROE in Q3 2023 was -106%. This negative value stems from their net profit margin of 3%, asset turnover of 1.02, and a negative asset to equity ratio of -32.4.
Conversely, IBM’s ROE stood at 24%, backed by a net profit margin of 9%, asset turnover of 0.46, and an equity to total assets ratio of 5.58.
This comparison provides a comprehensive, data-driven insight into the financial standings of DELL and IBM. Stay tuned by subscribing to our channel for the latest updates. Feel free to suggest other businesses for analysis, and we’ll address them in our upcoming videos.
Author: investforcus.com
Follow us on Youtube: The Investors Community

