AMC vs Netflix Stock Analysis – Have you ever wondered how AMC’s financial performance stacks up against Netflix’s? Today, we’re delving deep into the financials of these two prominent entertainment companies in the United States. AMC, renowned for its extensive cinema chains, and Netflix, the powerhouse in streaming services, both wield significant influence in the entertainment sector. However, their financial journeys diverge.
In recent years, AMC has encountered growth challenges, notably during the Covid-19 pandemic in 2020 and 2021. Conversely, Netflix has maintained a consistent growth trajectory, boasting a compound annual growth rate of 17% over the past five years.
As we scrutinize their revenues, profits, assets, and operational efficiency, we’ll uncover the intricate factors driving these numbers.
Whether you’re an experienced investor or simply intrigued by the financial well-being of these entertainment giants, get ready for insights aplenty.
Join us as we delve into the financial landscapes of these two industry leaders.
Revenue Analysis – AMC vs Netflix Stock Analysis
Let’s delve into the revenue trends of both AMC and Netflix.
In the last three quarters of 2023, AMC recorded total revenues of $3.7 billion, while Netflix reported an impressive $25 billion.
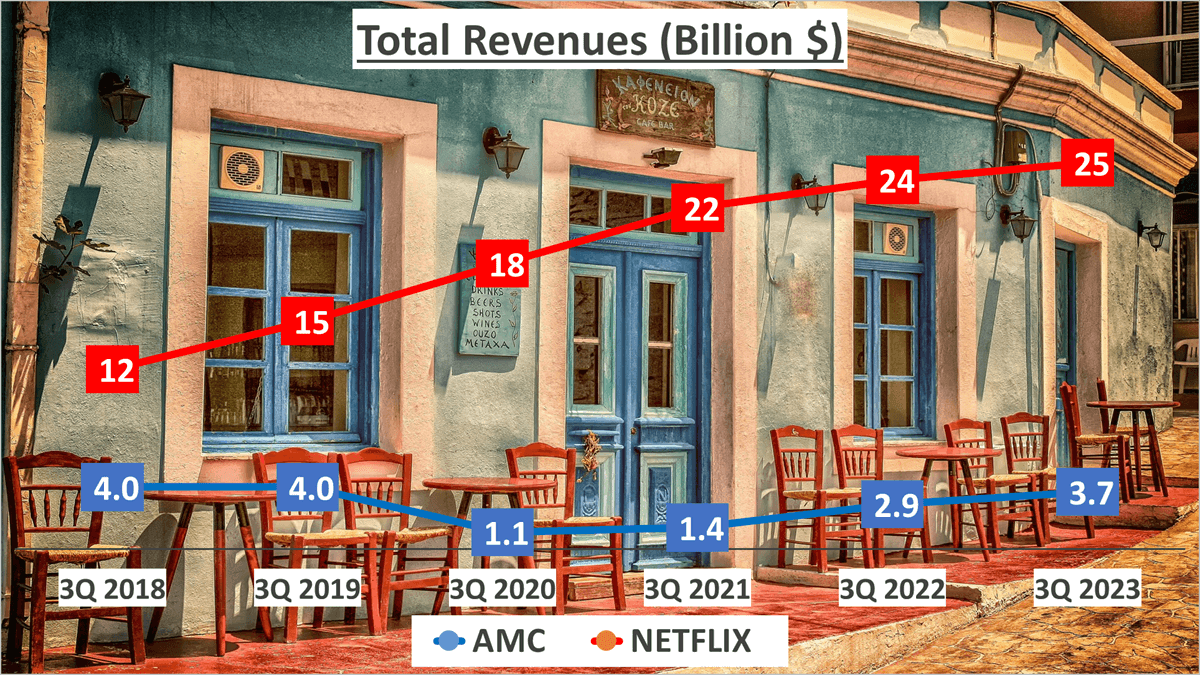
Now, let’s compare these figures to those from five years ago, in 2018. The Compound Annual Growth Rate (CAGR) provides valuable insights here. Over this five-year period, AMC’s revenues have declined at an average rate of 2% annually, while Netflix has witnessed a robust expansion at a rate of 17% per year. This stark contrast underscores the diverging paths of these two entertainment giants.
It’s important to note that the revenue trends weren’t always this disparate. Before the pandemic struck, both companies enjoyed relatively stable positions. However, the COVID-19 outbreak in 2020 and 2021 severely impacted AMC’s revenues, leading to ongoing challenges in recovery.
In contrast, Netflix’s digital streaming-focused business model proved resilient during the pandemic. With lockdowns and social distancing measures driving up demand for online entertainment, Netflix capitalized on its extensive content library, resulting in a substantial revenue surge. Despite the global turmoil, Netflix’s revenues have consistently expanded over the years, showcasing the adaptability and resilience of its business model.
On the other hand, AMC, reliant on physical movie theaters, faced significant setbacks due to the pandemic. Despite efforts to diversify revenue streams, the company struggled to sustain growth, highlighting the importance of adaptability in today’s ever-evolving entertainment landscape.
In conclusion, Netflix’s revenue has maintained steady growth over the years, whereas AMC has encountered challenges in sustaining growth, particularly amidst the COVID-19 pandemic in 2020 and 2021.
Breakdown of Revenue Sources – AMC vs Netflix Stock Analysis
Let’s analyze the revenue compositions of both AMC and Netflix.
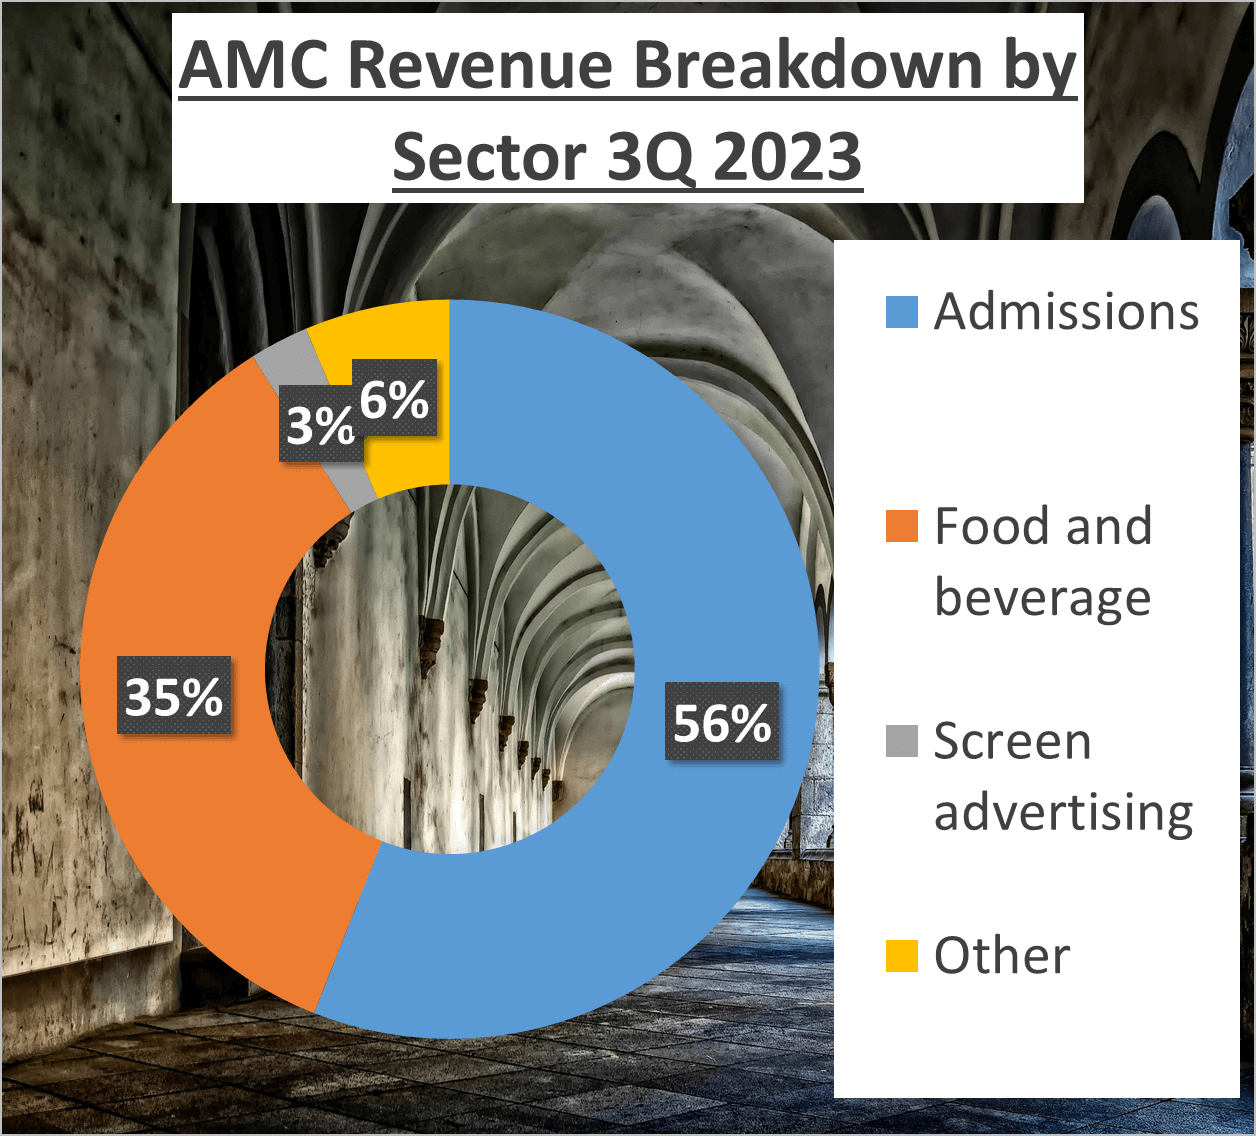
Starting with AMC, their revenue is segmented into four primary streams. The majority, a substantial 56%, originates from admissions, representing the payments made by patrons to watch movies in their theaters. Following closely, 35% is derived from food and beverage sales, encompassing items like popcorn and soda. Screen advertising, accounting for a minor 3%, comprises the ads displayed before the movie screening. The remaining 6% falls under ‘other,’ encompassing various sources such as merchandise sales and special events.
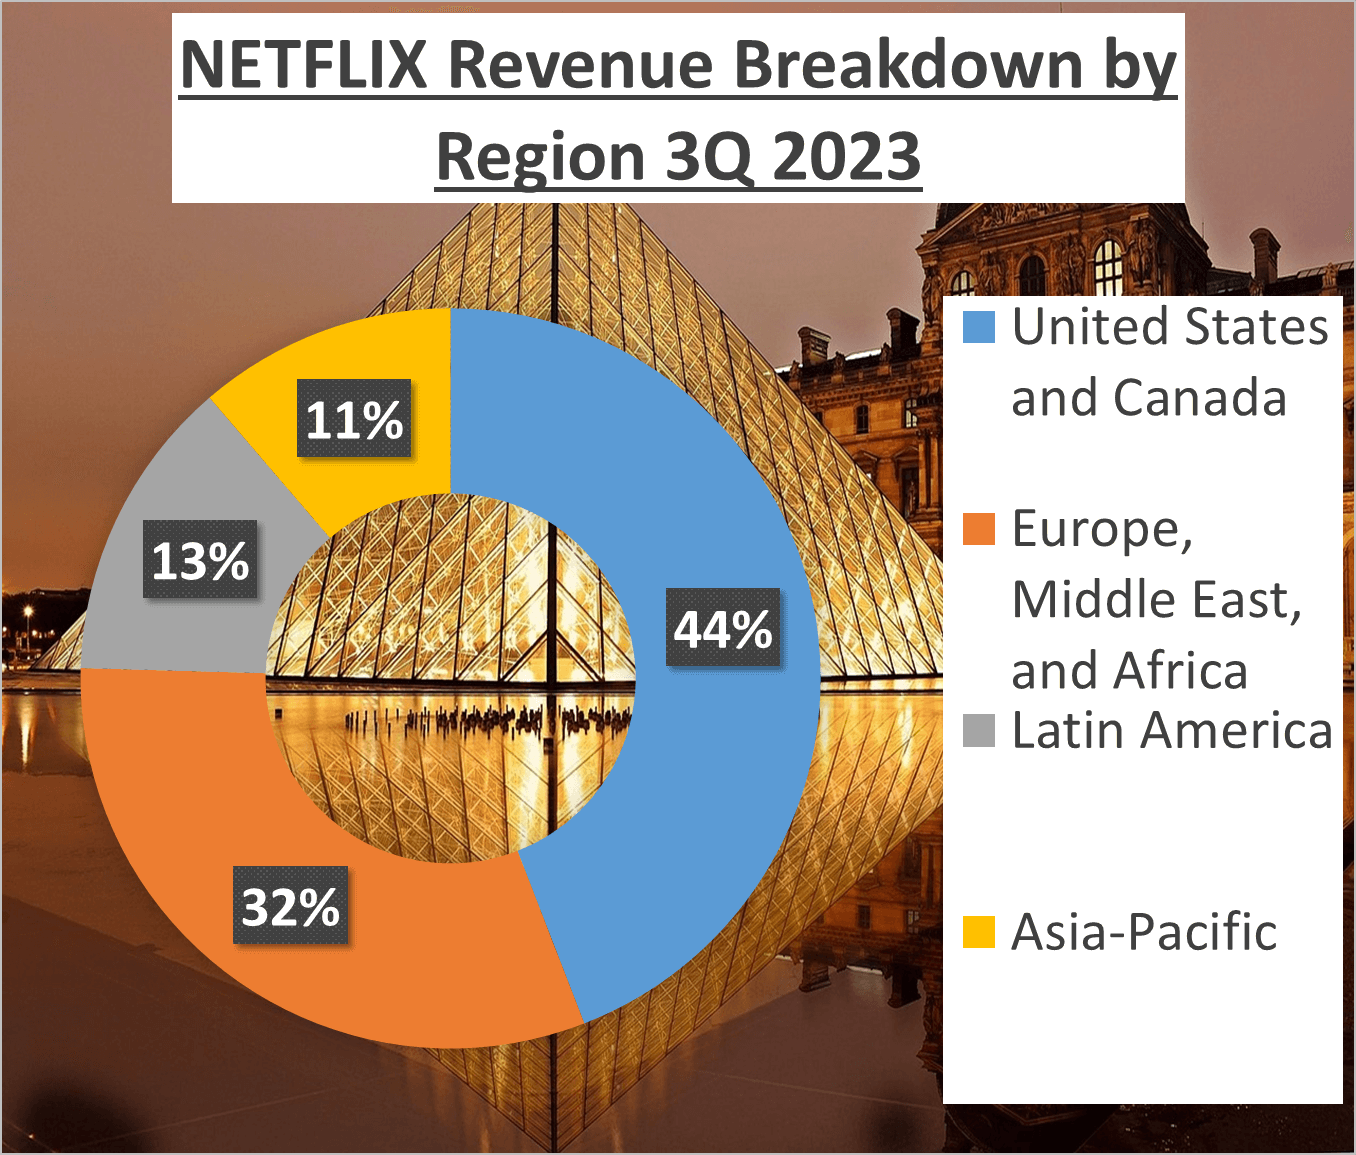
In contrast, Netflix’s revenue structure is geographical. A significant 44% of their total revenue is derived from the United States and Canada, with Europe, the Middle East, and Africa contributing 32%. Latin America contributes 13%, while the Asia-Pacific region accounts for the remaining 11%. It’s worth noting the global distribution of Netflix’s revenue, underscoring the platform’s broad international presence.
Upon comparison, a stark contrast emerges. AMC’s revenue heavily relies on physical, in-person experiences, particularly people attending theaters and purchasing concessions. This model faced considerable vulnerability during the Covid-19 pandemic, contributing to a negative 2% Compound Annual Growth Rate (CAGR) over the past five years.
Conversely, Netflix operates in the digital realm, with revenue primarily driven by subscription-based models across diverse geographic regions. This diversified approach has likely bolstered their resilience to localized disruptions, contributing to an impressive 17% CAGR over the same period.
In summary, AMC’s revenue streams are largely dependent on traditional cinema experiences, while Netflix’s revenue is diversified across global regions. These distinct revenue structures align with their respective business models – one grounded in physical cinema experiences and the other in digital, on-demand streaming.
As evident, the revenue structures of AMC and Netflix differ significantly, reflecting the unique characteristics of their business models.
Profit Analysis – AMC vs Netflix Stock Analysis
Let’s now assess the net profit margins of both AMC and Netflix, a critical metric showcasing a company’s profitability by revealing the portion of each earned dollar that translates into profits.
AMC’s net profit margin for the last three quarters of 2023 stood at -6%, a significant deviation from the -73% average over the preceding five years. This indicates AMC’s persistent operational losses, where expenses outweigh revenues.
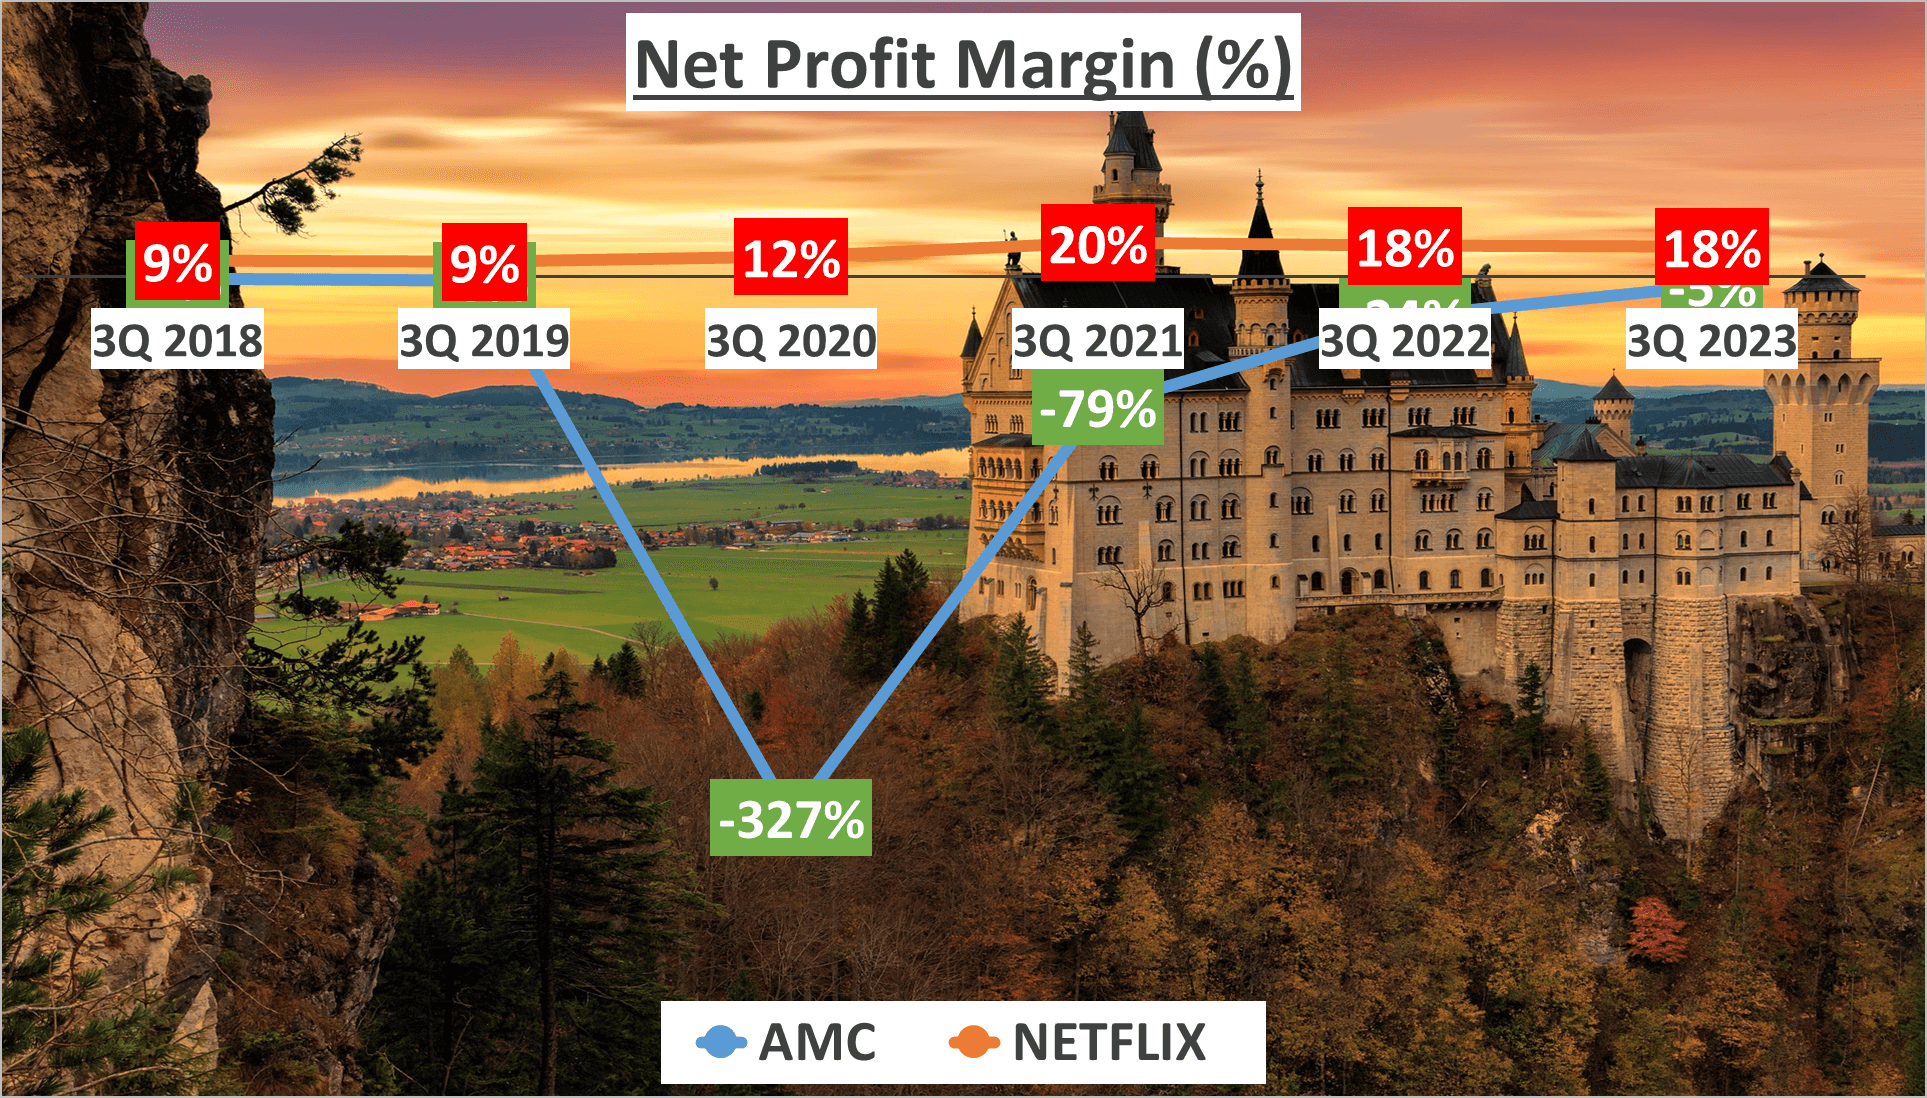
In contrast, Netflix’s net profit margin during the same period was 18%, slightly surpassing its five-year average of 15%. This suggests Netflix’s adeptness in cost management, enabling profit generation from each dollar of revenue.
Delving into the net profit figures, AMC reported a net loss of $200 million for the last three quarters of 2023, continuing its trend of negative profitability over the past five years.
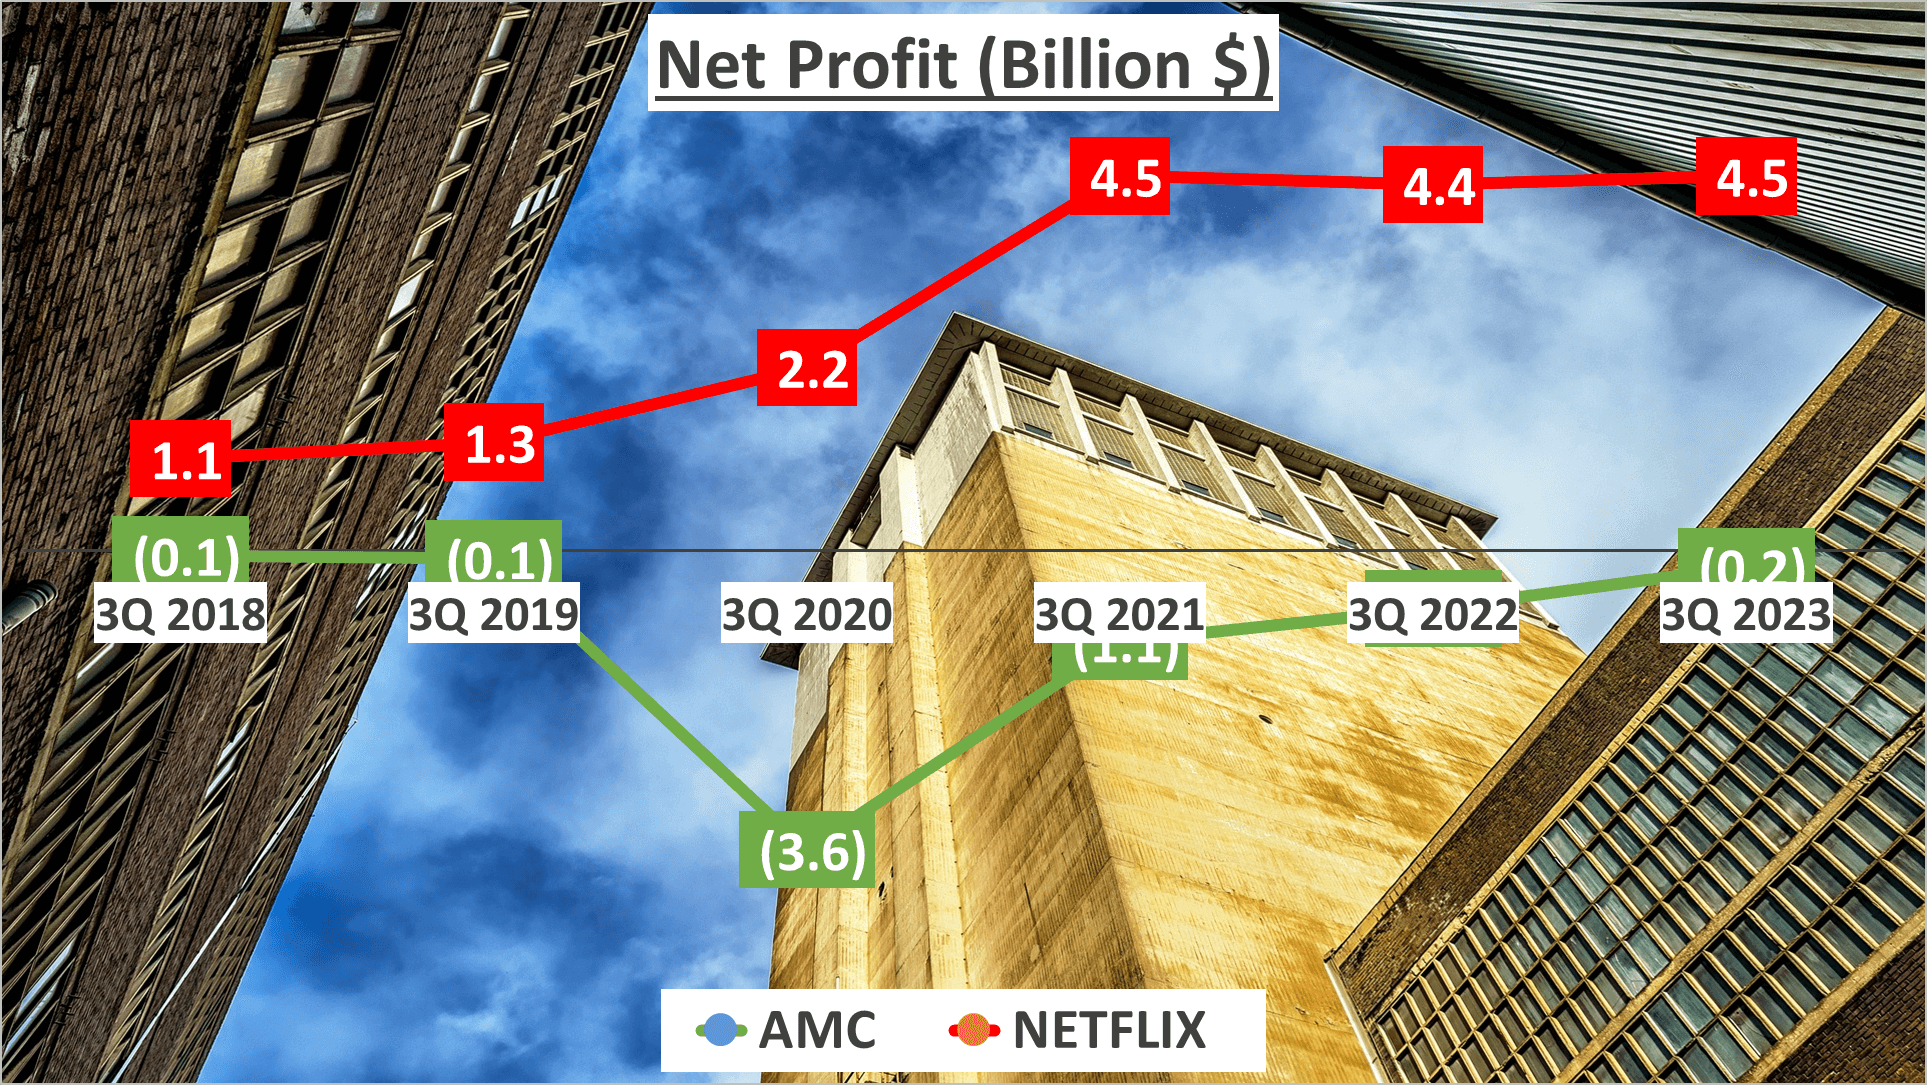
On the flip side, Netflix boasted a net profit of $4.5 billion for the same period. Since 2018, Netflix’s net profit has consistently risen, registering a compound annual growth rate (CAGR) of 33%. This sustained profit growth underscores the resilience of Netflix’s business model in navigating market fluctuations effectively.
In summary, despite operating within the entertainment industry, AMC and Netflix exhibit starkly contrasting financial performances. AMC struggles with persistently negative net profit margins, indicative of its challenges in translating revenues into profits. Conversely, Netflix has maintained consistent profitability, with a gradual uptick in net profit margin over the past five years.
While AMC grapples with negative net profit margins, Netflix’s ability to steadily improve its net profit margin underscores its financial robustness amidst industry challenges.
Operational Efficiency – AMC vs Netflix Stock Analysis
In terms of operational efficiency, let’s assess how AMC and Netflix stack up against each other.
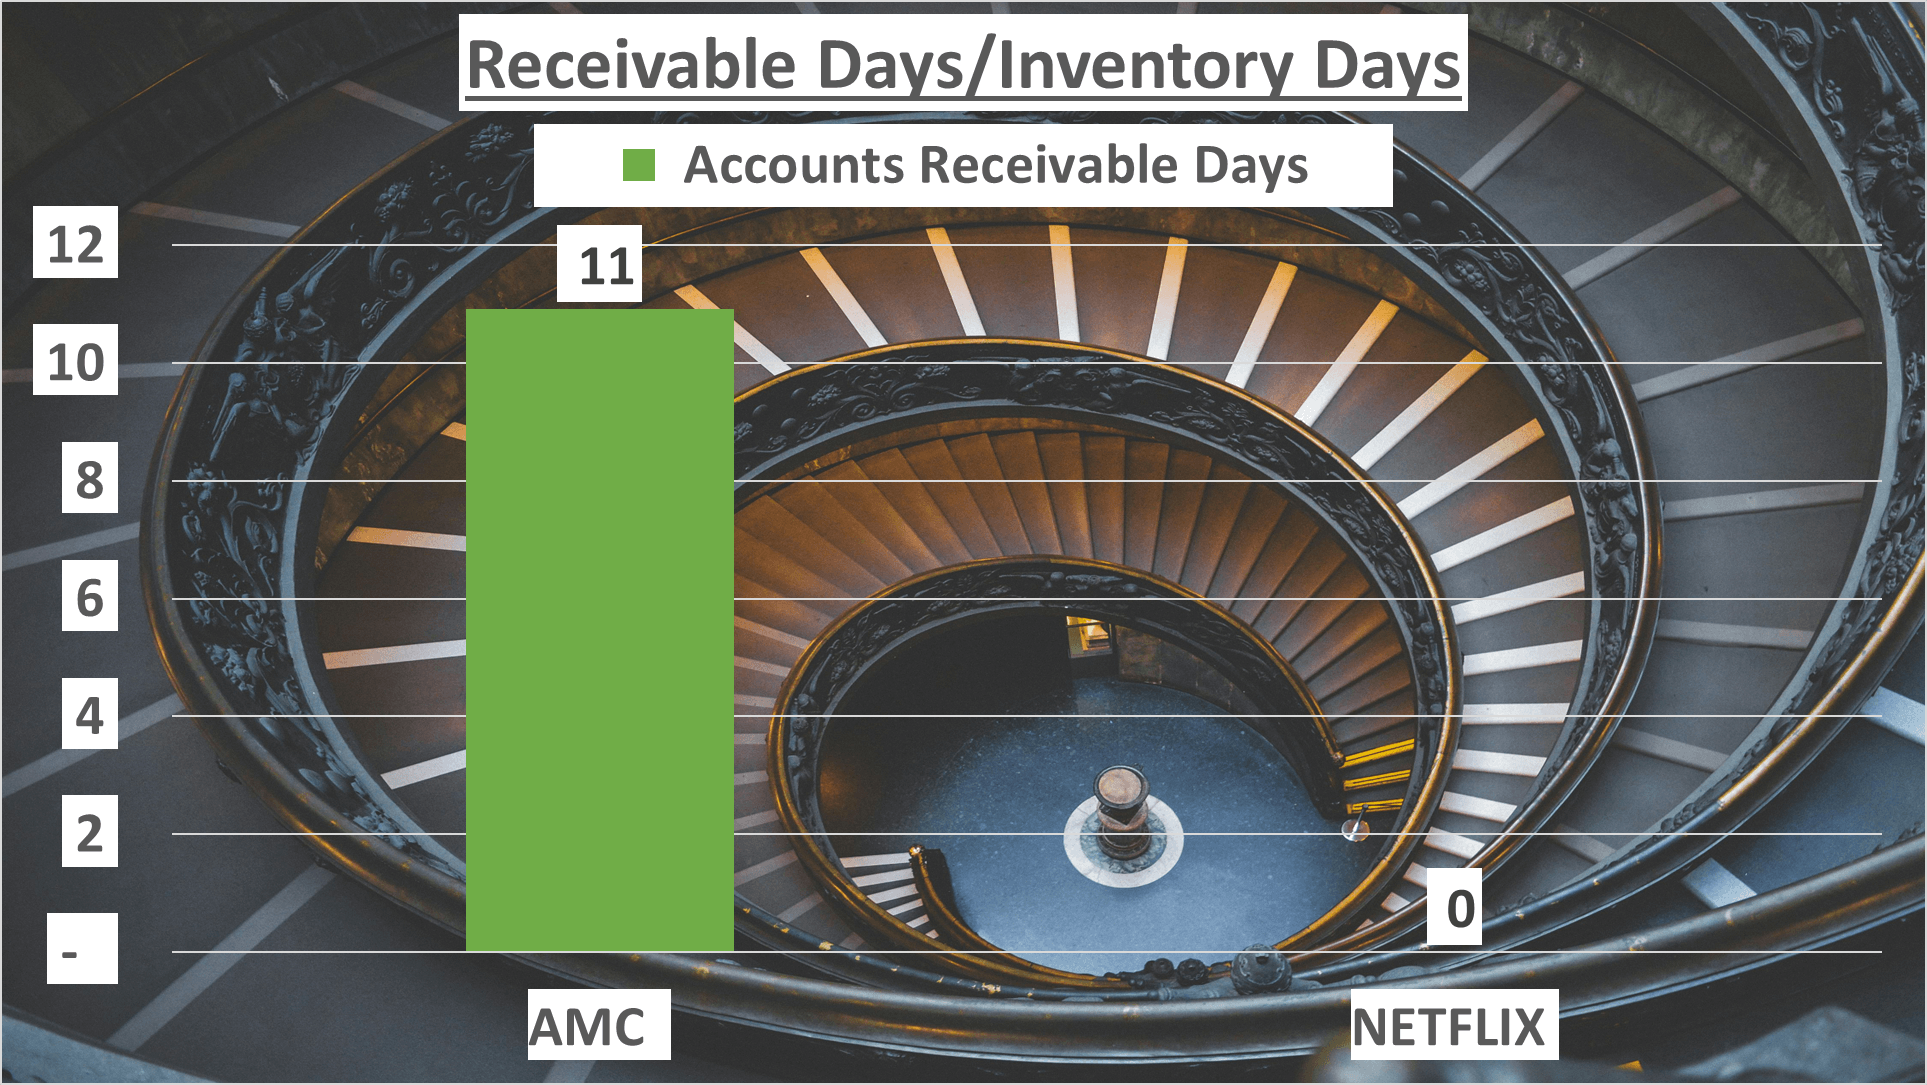
Starting with receivable days, which signifies the average duration taken by a company to collect payment after a sale, AMC records 11 days. Now, the surprising part is Netflix, with a receivable days count of 0, owing to its business model that excludes accounts receivable.
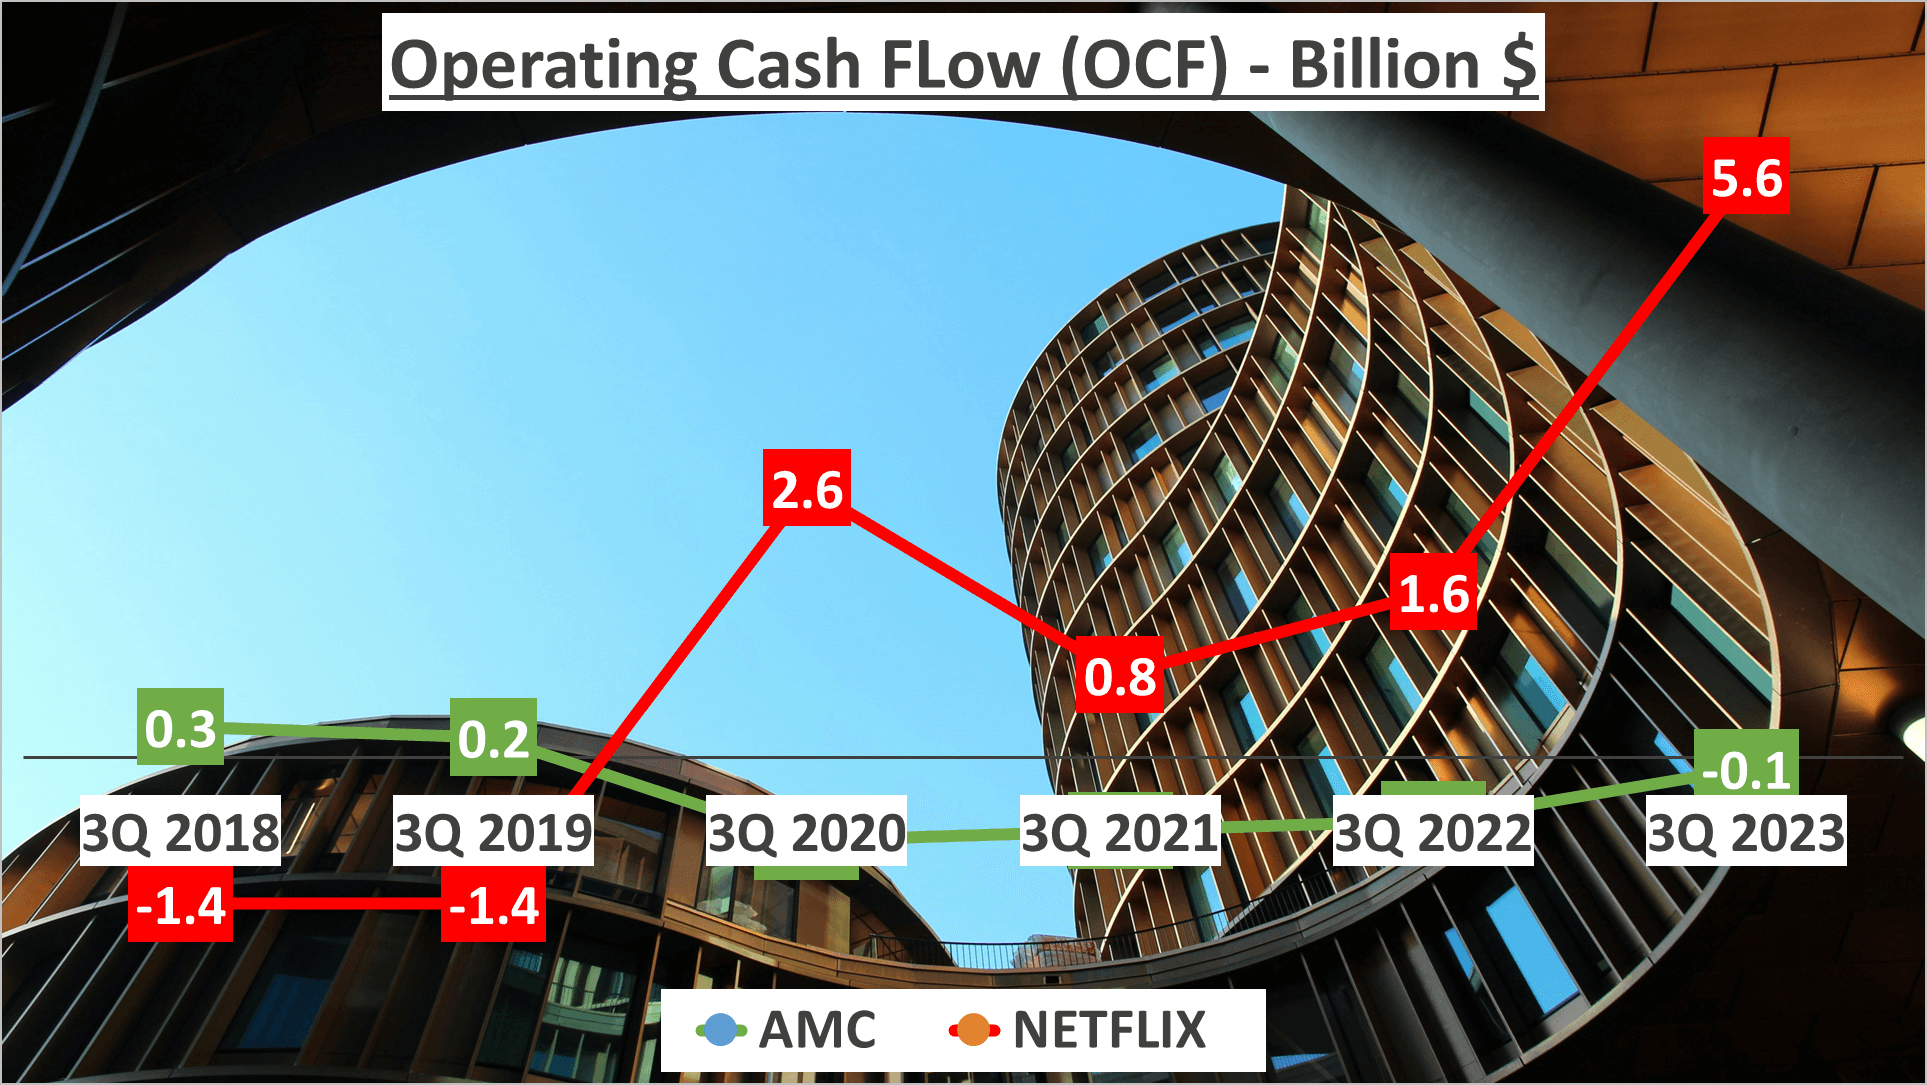
Moving on to operating cash flow, which gauges the cash generated from a company’s regular operational activities, AMC reports a negative $100 million. This indicates AMC’s struggle in generating cash from its core operations. Conversely, Netflix boasts an impressive operating cash flow of $5.6 billion, highlighting its efficient cash generation capability.
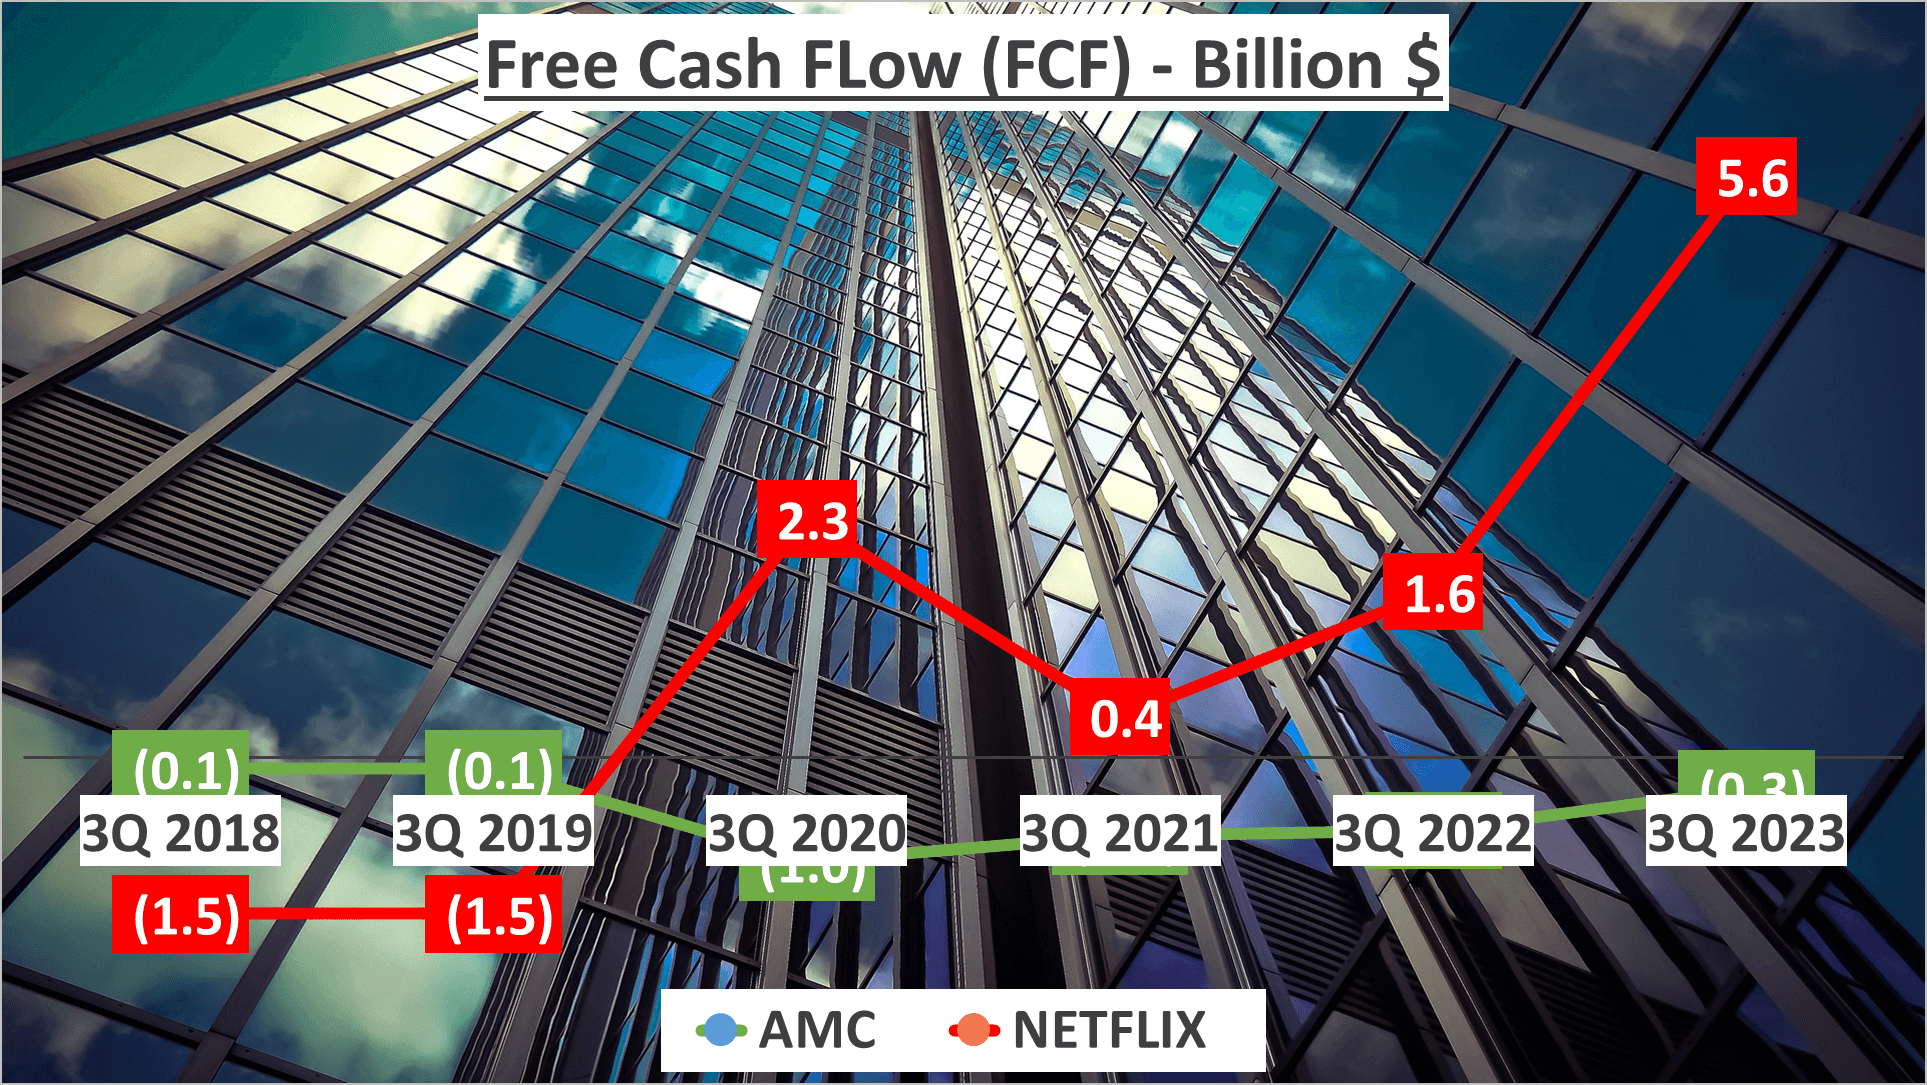
Now, let’s delve into free cash flow, representing the cash remaining after accounting for outflows to support operations and maintain assets. Once again, AMC shows negative numbers, with a free cash flow of -$300 million. On the contrary, Netflix exhibits a robust free cash flow of $5.6 billion, mirroring its strong operating cash flow.
Lastly, examining the ratio of operating cash flow to net income sheds light on a company’s ability to convert reported profits into operational cash. AMC’s ratio is 0.5, while Netflix’s stands at a solid 1.2, suggesting Netflix’s superior efficiency in converting net income into operational cash.
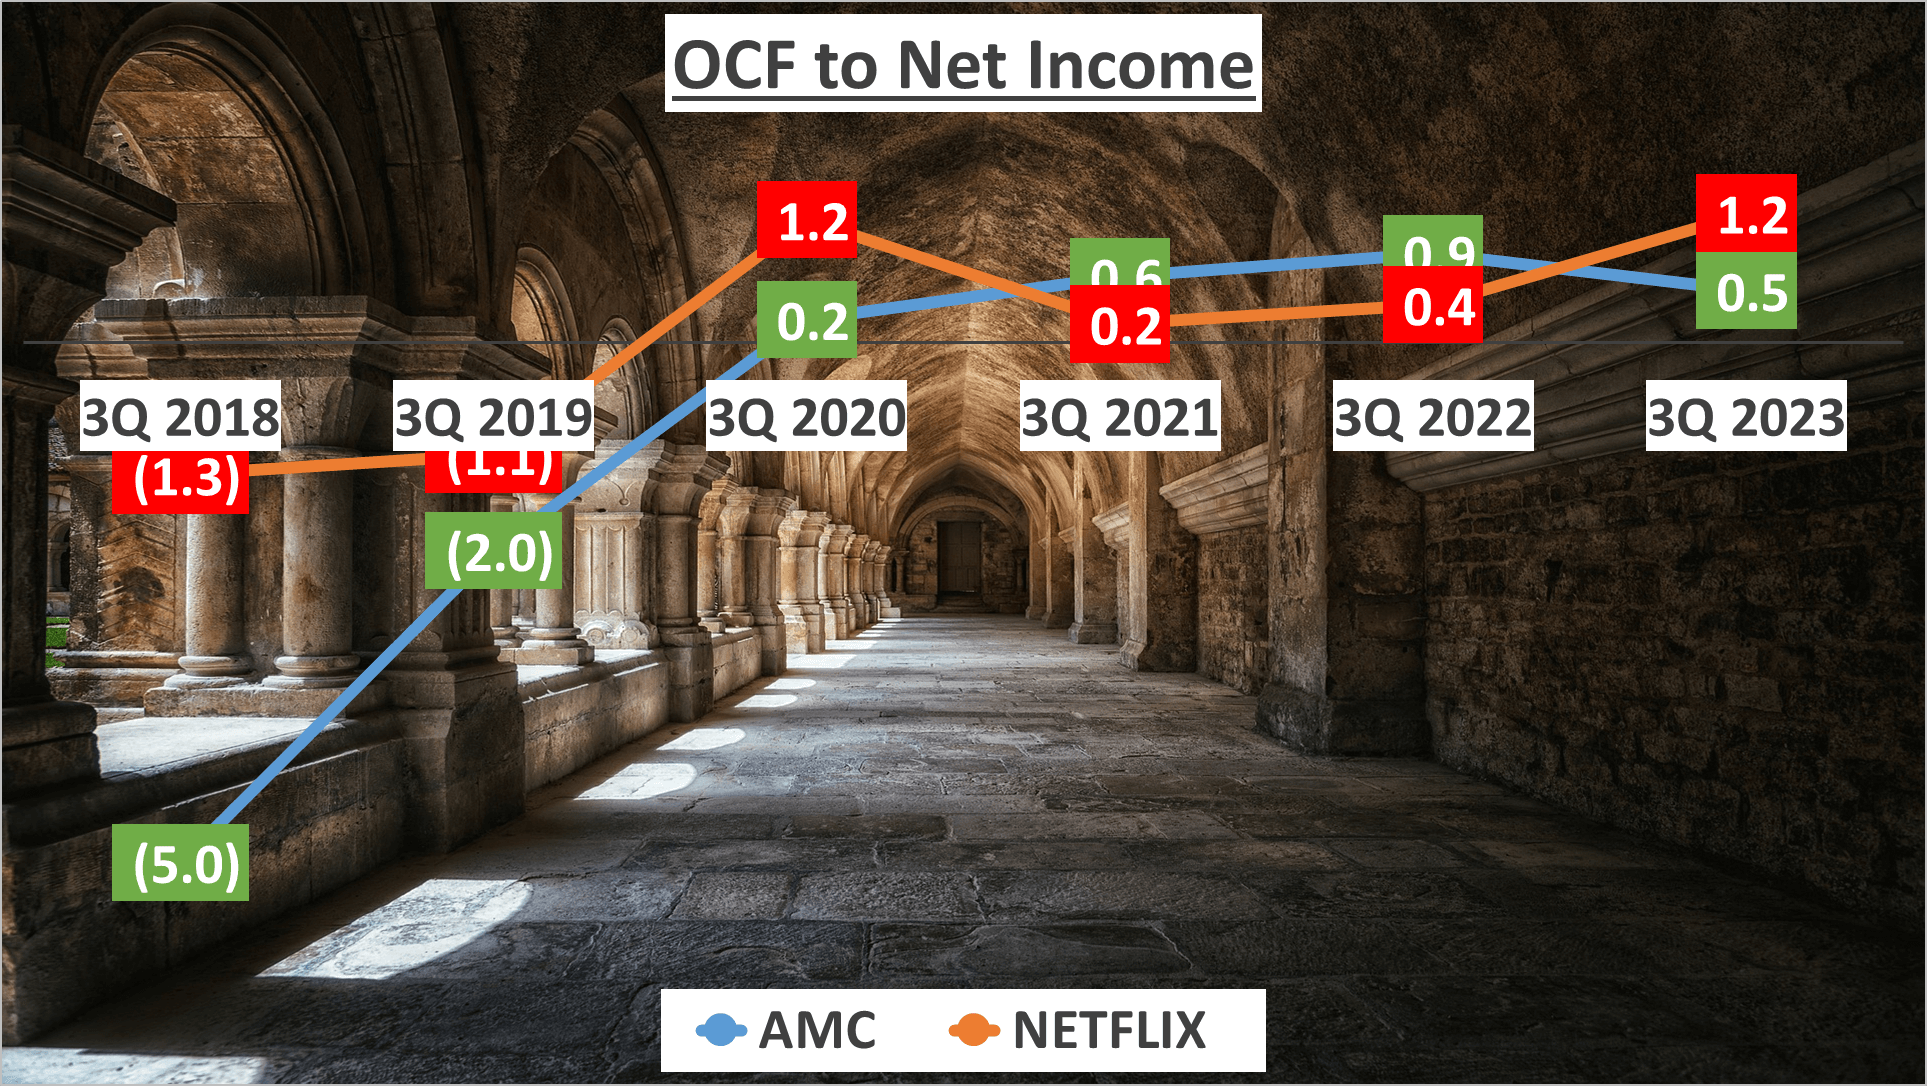
The stark contrast between Netflix’s robust cash flow growth and AMC’s negative cash flow underscores a notable difference in operational efficiency. This contrast might significantly influence the financial performance of both companies. Hence, it’s a crucial consideration for investors when contemplating an investment decision.
Return on Equity (ROE) Analysis and Conclusion – AMC vs Netflix Stock Analysis
Now, let’s delve into the Return on Equity (ROE) for both AMC and Netflix. ROE is calculated by dissecting it into three components: net profit margin, asset turnover, and equity to total assets.
In the third quarter of 2023, AMC recorded a negative 13% ROE, a negative 6% net profit margin, a 0.55 asset turnover, and a 4.11 equity to total assets ratio.
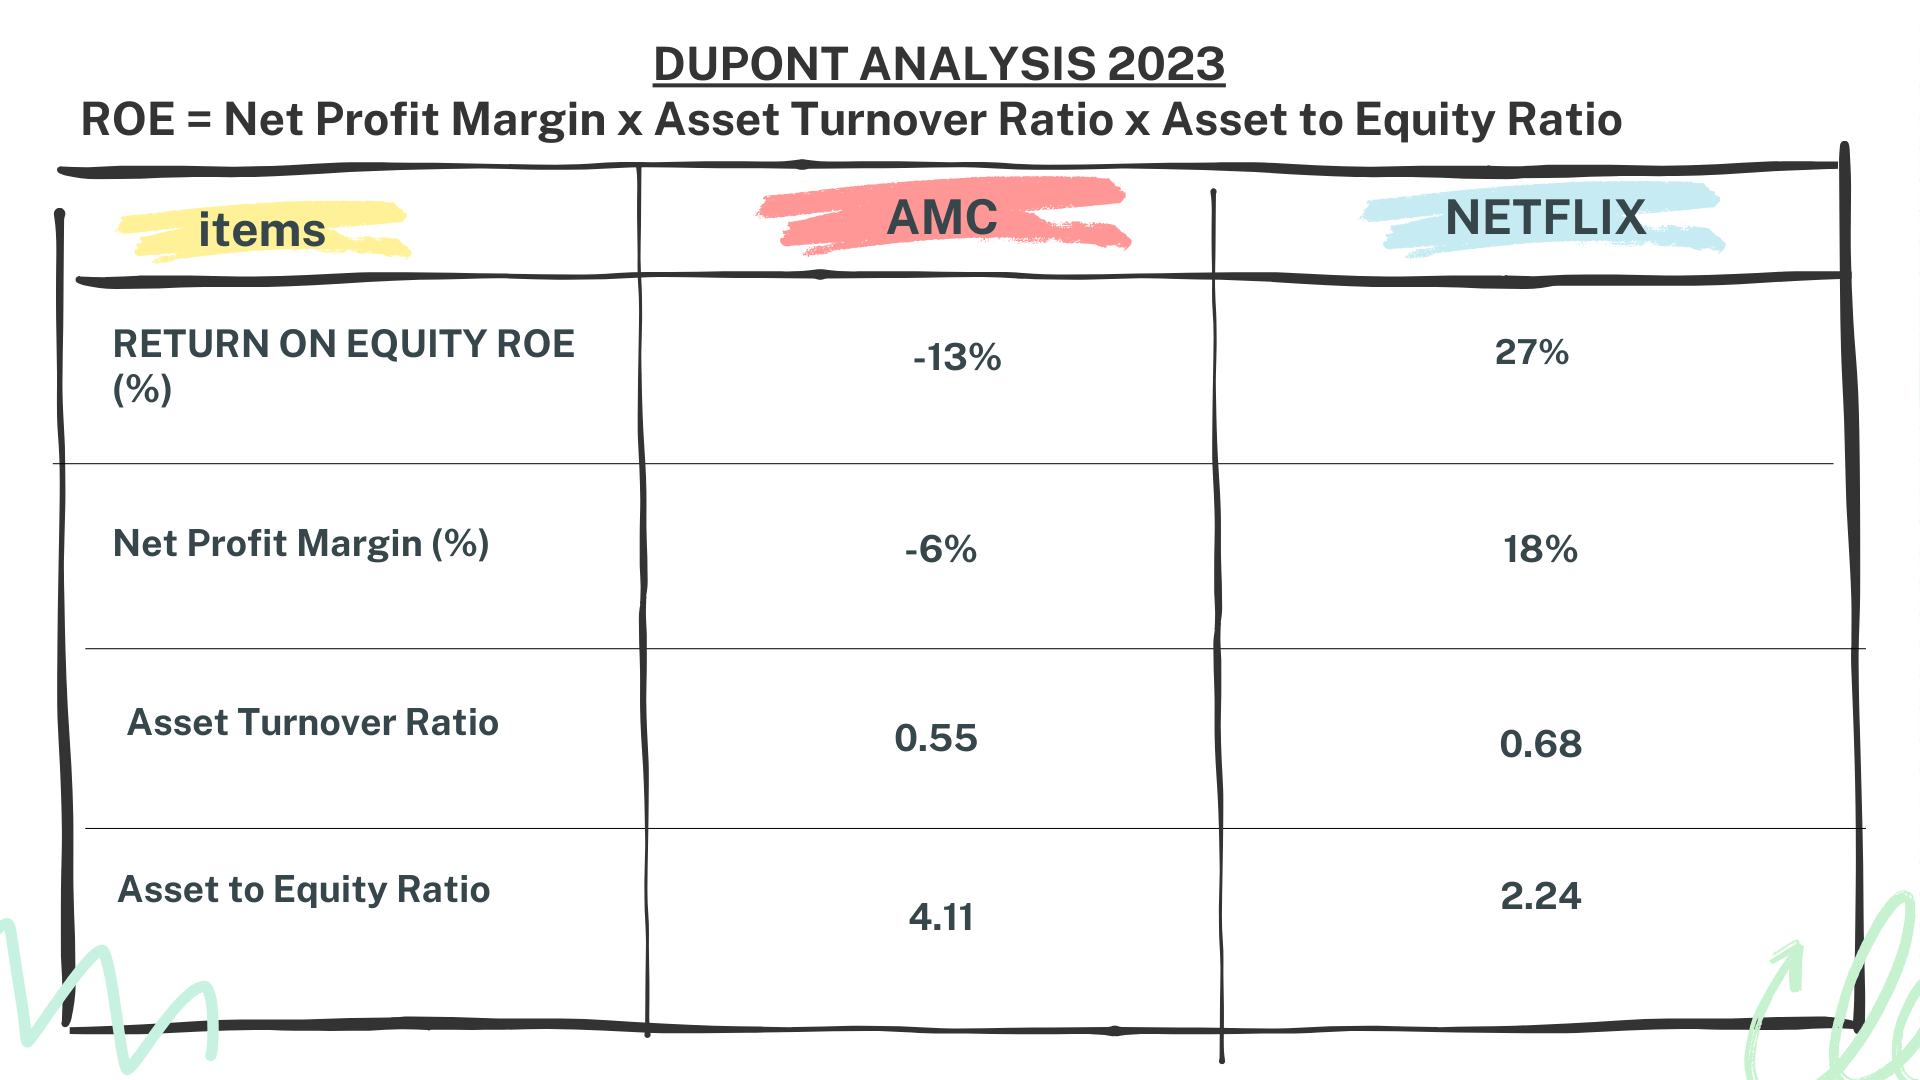
In contrast, Netflix showcased a 27% ROE, an 18% net profit margin, a 0.68 asset turnover, and a 2.24 equity to total assets ratio.
These metrics clearly demonstrate that Netflix surpasses AMC in terms of return on equity. This aspect is crucial for investors, as it reflects how efficiently both companies utilize their shareholders’ equity to generate profits.
In conclusion, this wraps up our financial comparison between AMC and Netflix. Don’t forget to subscribe to our channel for the latest updates. Feel free to comment with the businesses you’d like us to analyze in our upcoming videos.
Author: investforcus.com
Follow us on Youtube: The Investors Community

