Walt Disney vs Comcast Stock Analysis – Curious about how Walt Disney stacks up against Comcast in terms of financial performance? You’re in the right place. Walt Disney and Comcast stand as two formidable entertainment and media conglomerates in the United States, each with its distinctive strengths and focus areas.
Delving into their financial performance in 2023, we uncover intriguing figures. Walt Disney raked in a total revenue of $89 billion, while Comcast surged ahead with an impressive $122 billion.
But what significance do these numbers hold? And how do they shape the overall financial robustness and growth prospects of these entertainment giants? That’s precisely what we aim to unravel. We’ll dissect these revenues, scrutinize profit margins, evaluate assets and liquidity, and much more.
In this video, we embark on a comprehensive journey into the financial performance of these entertainment powerhouses. Stay tuned for valuable insights and analysis.
Revenue Breakdown: Walt Disney vs Comcast Stock Analysis
Let’s delve into how these industry giants generate their revenue. In 2023, Walt Disney amassed $89B in total revenue, while Comcast surged ahead with an impressive $122B.
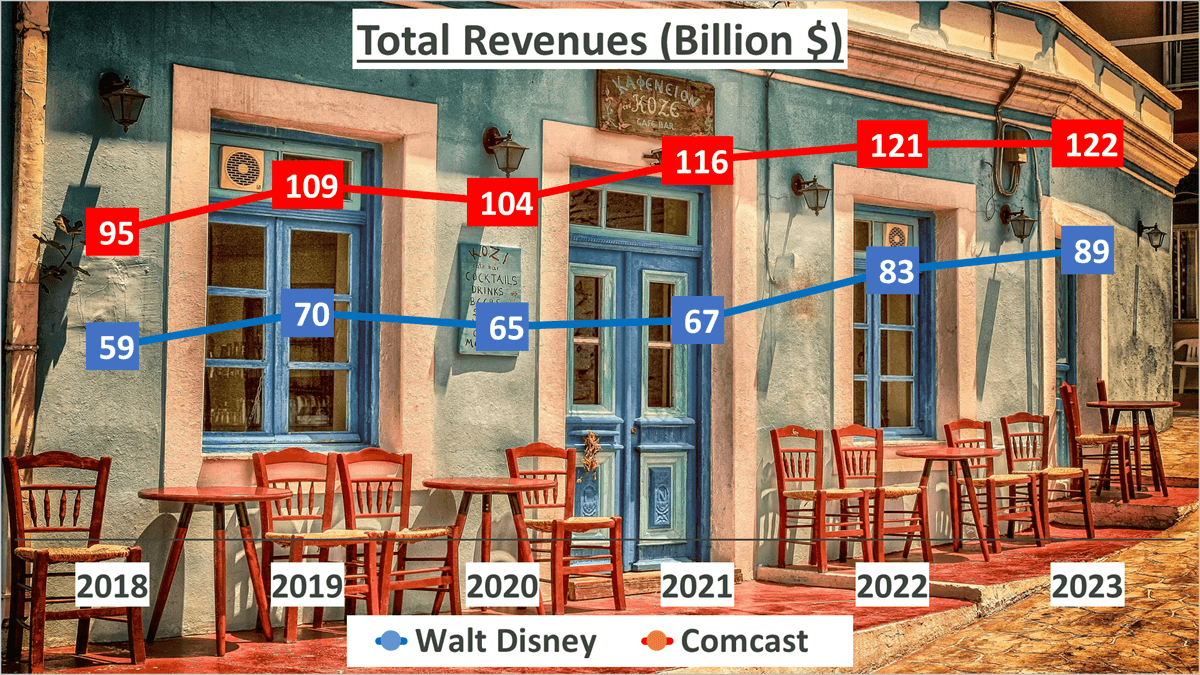
Comparing these figures with those from 2018, Disney’s revenue witnessed a compound annual growth rate (CAGR) of 8%, whereas Comcast’s revenue saw a 5% CAGR over the same five-year period.
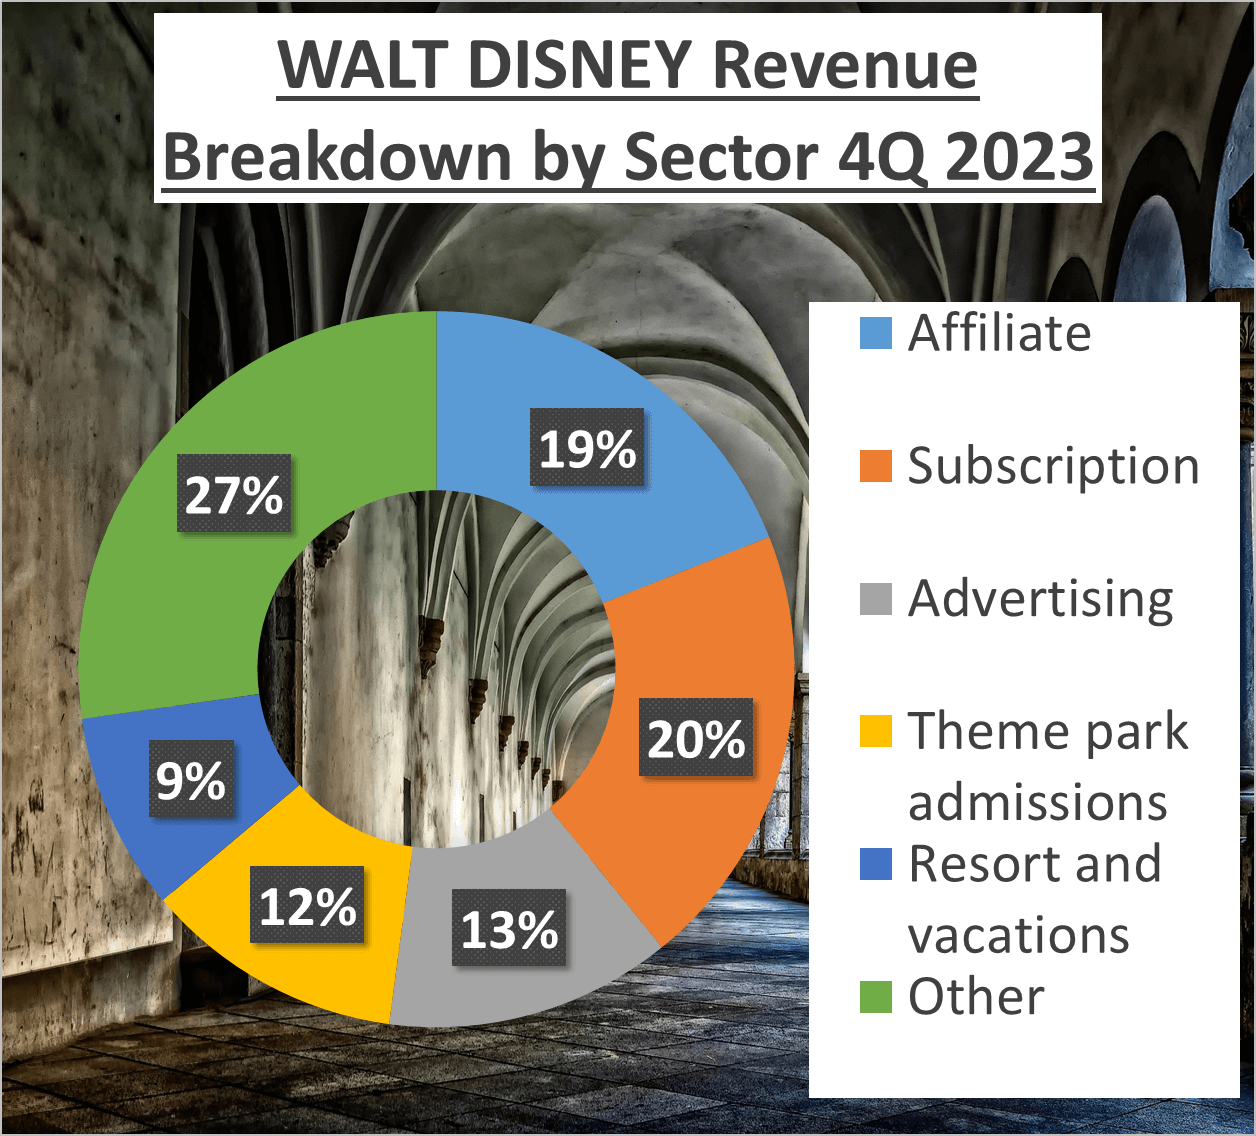
Walt Disney’s revenue diversification is notable, with 19% from affiliate fees, 20% from subscription fees, 13% from advertising, 12% from theme park admissions, 9% from resorts and vacations, and the remaining 27% from other operations.
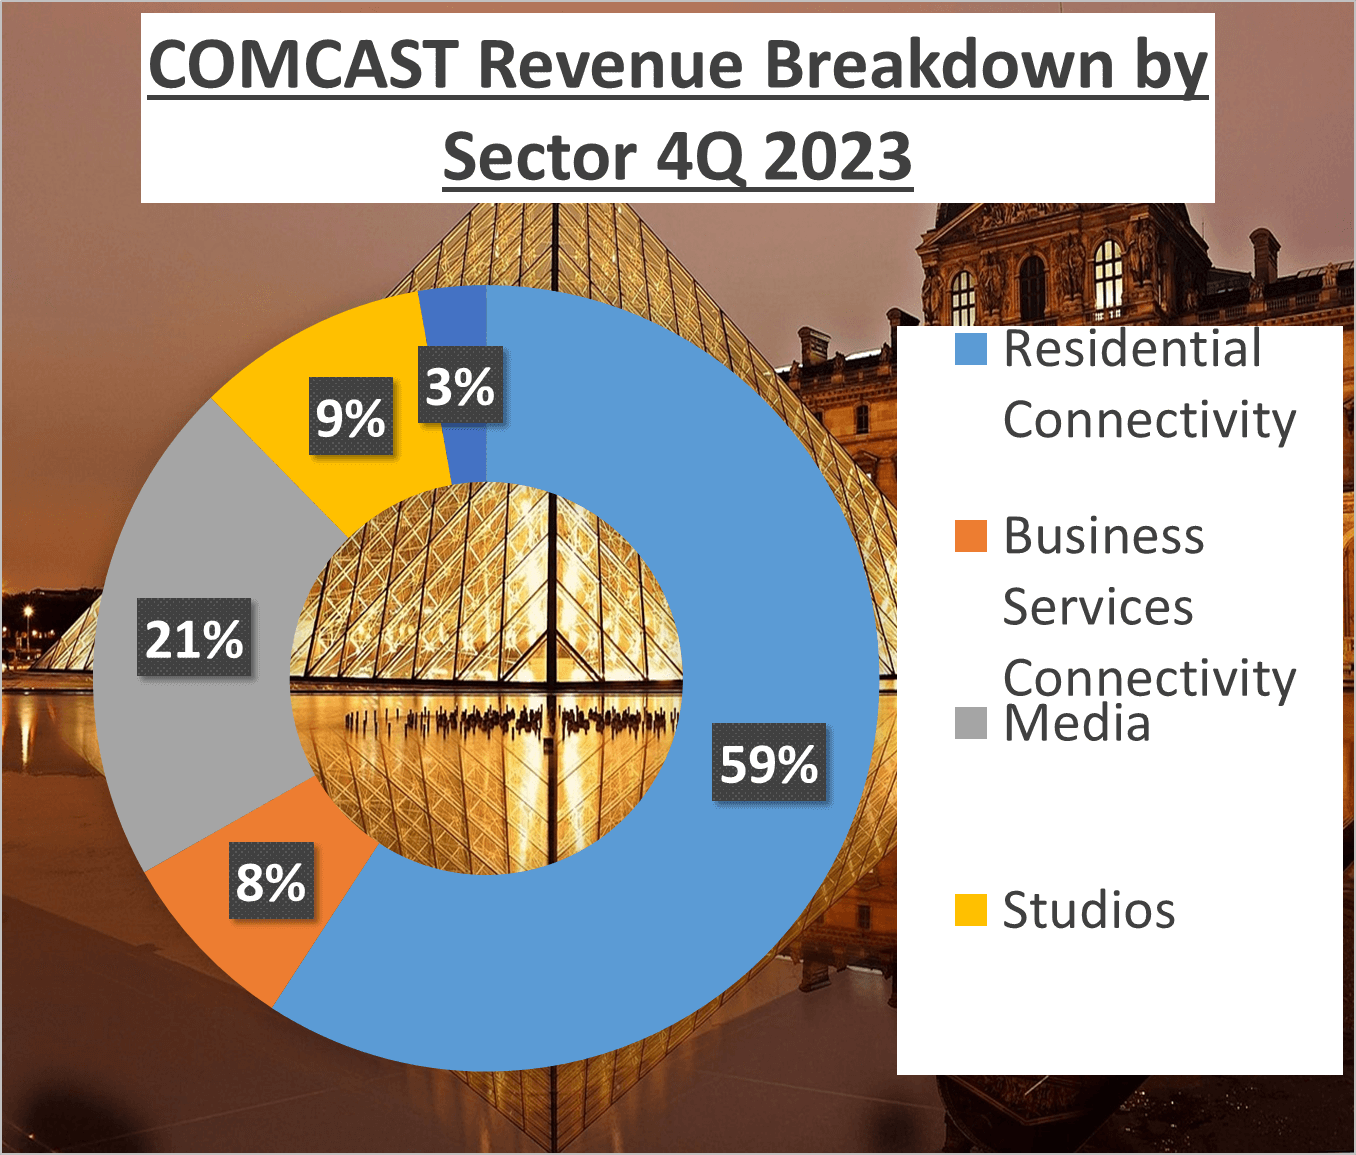
On the other hand, Comcast’s revenue structure is more concentrated, with 59% from residential connectivity and platforms, 8% from business services connectivity, 21% from media, 9% from studios, and a mere 3% from other sources.
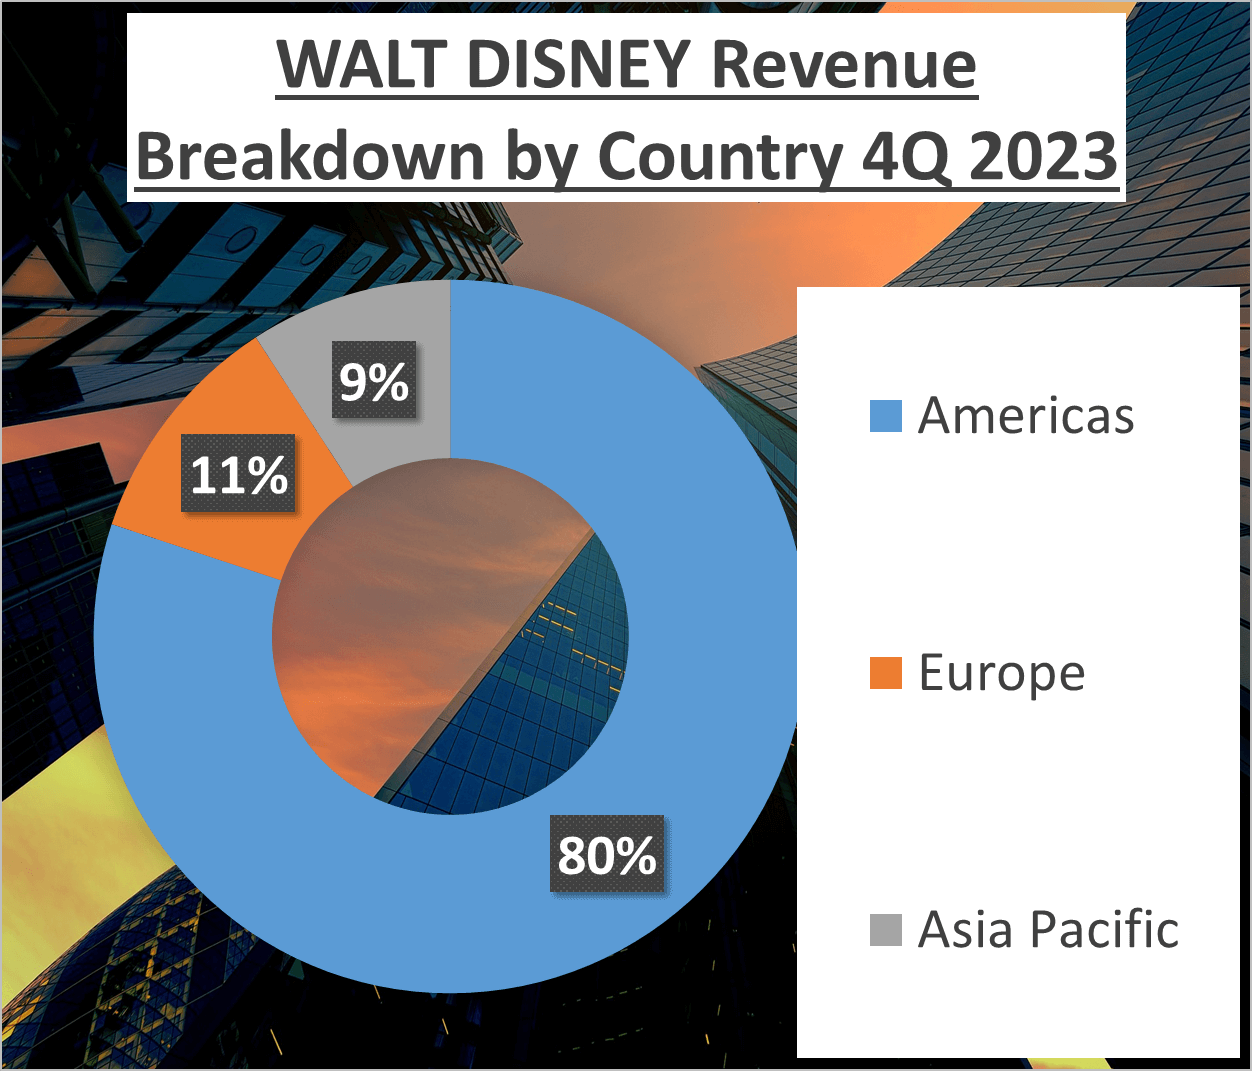
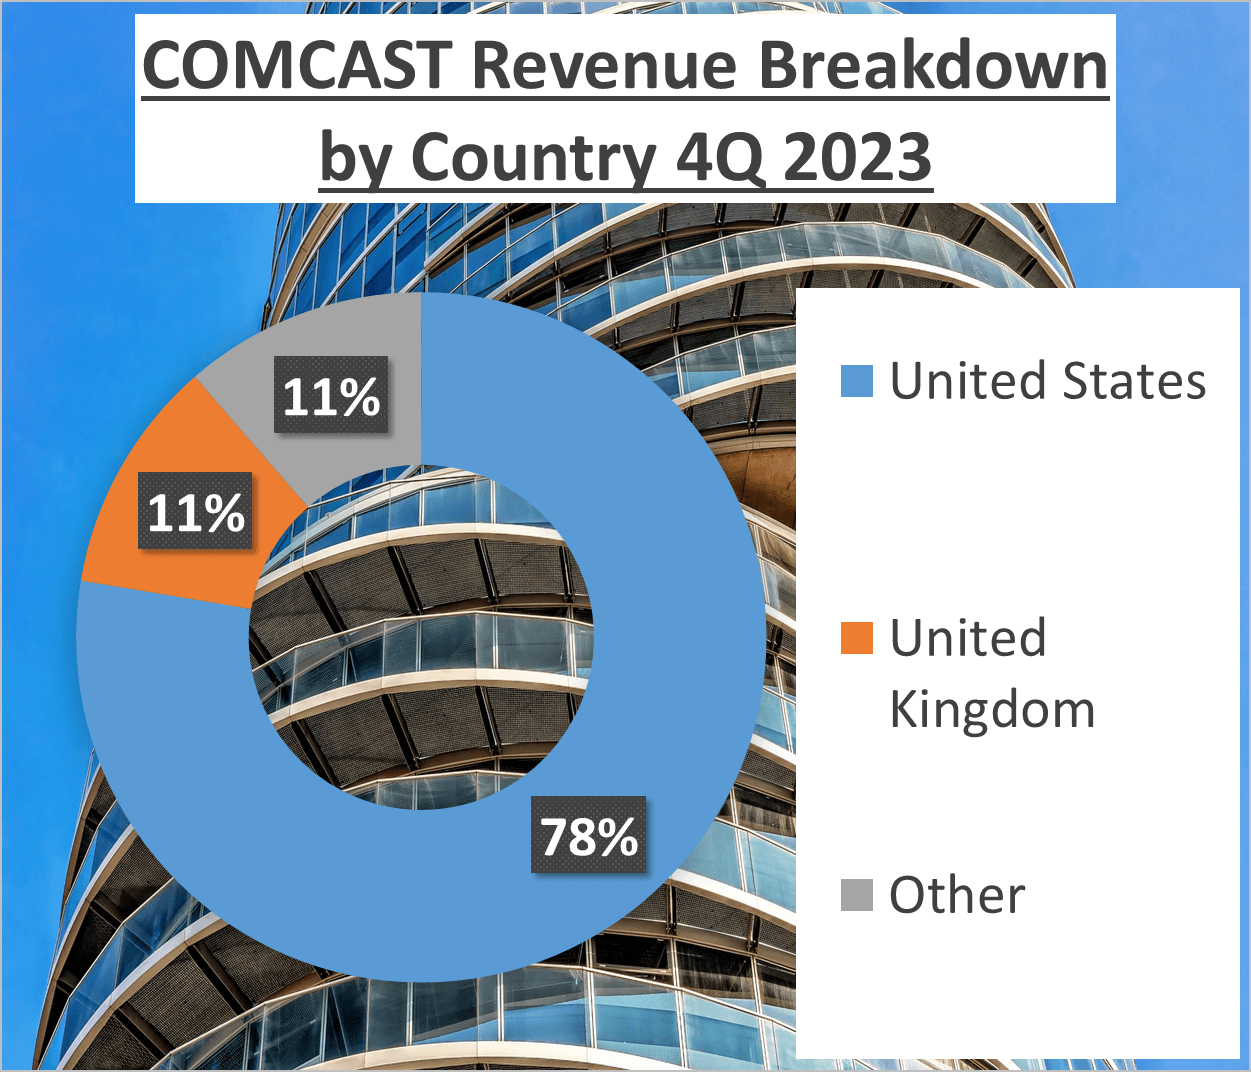
Geographically, Walt Disney derives 80% of its revenue from the Americas, 11% from Europe, and 9% from the Asia Pacific region. In contrast, Comcast garners 78% of its revenue from the United States, 11% from the United Kingdom, and the remaining 11% from other global regions.
These revenue streams significantly influence the financial well-being of both companies. Stay tuned as we further explore the profit margins and net profits of Walt Disney and Comcast in the next segment.
Profit Margins and Net Profit: Walt Disney vs Comcast Stock Analysis
Let’s delve into profit margins and net profits, crucial indicators of financial performance.
Profit margins offer insight into a company’s earnings relative to its revenue, serving as a key gauge of financial health. Walt Disney and Comcast present intriguing comparisons in this aspect.
Over the past five years, Walt Disney’s net profit margin fluctuated, averaging at 7%. However, by 2023, it dropped to 3%, indicating a disparity between revenue growth and net income.
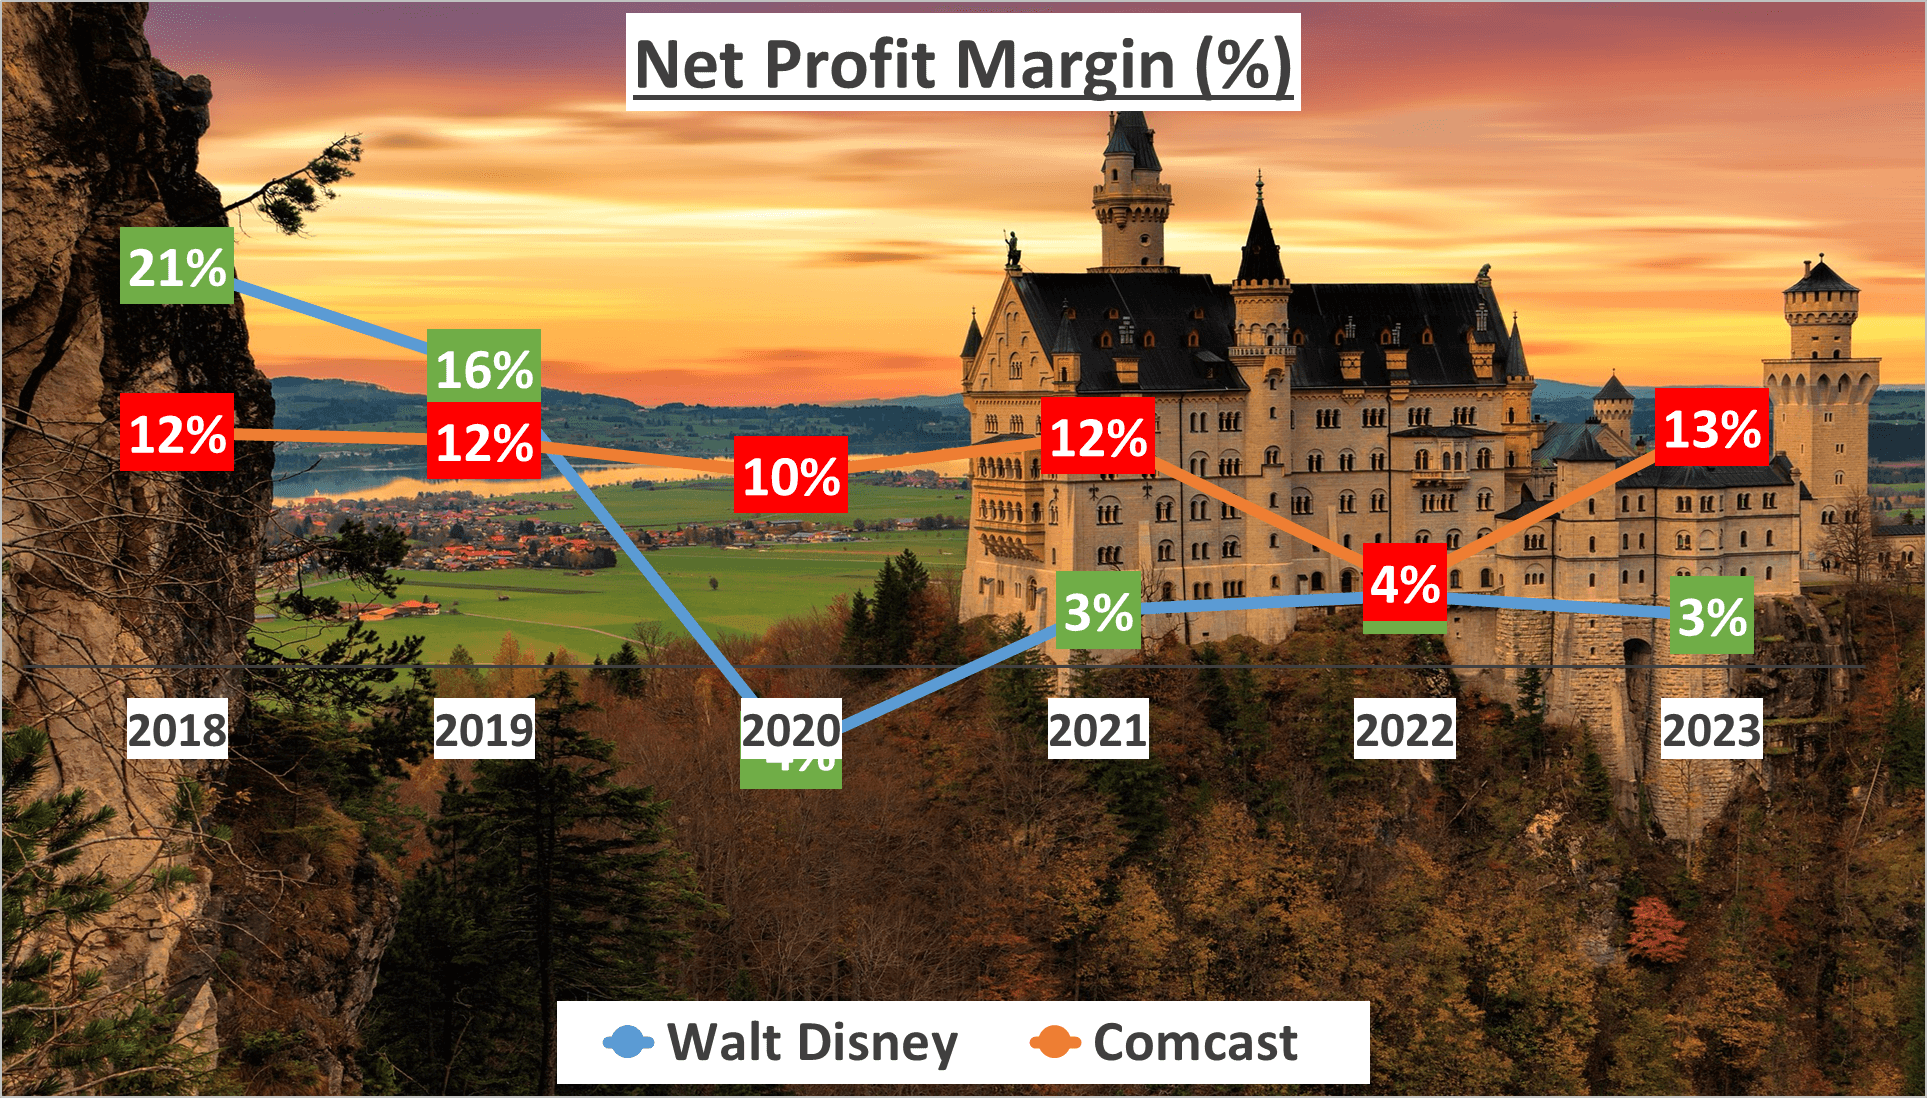
Conversely, Comcast maintained a steady net profit margin, averaging 11% over the same period and peaking at 13% in 2023. This consistency underscores Comcast’s adeptness in cost management alongside revenue growth.
Turning to net profits, Walt Disney recorded a respectable $2.4B in 2023. Nonetheless, Comcast surpassed this with a substantial $15.4B in net profit, showcasing a notable discrepancy in profitability between the two.
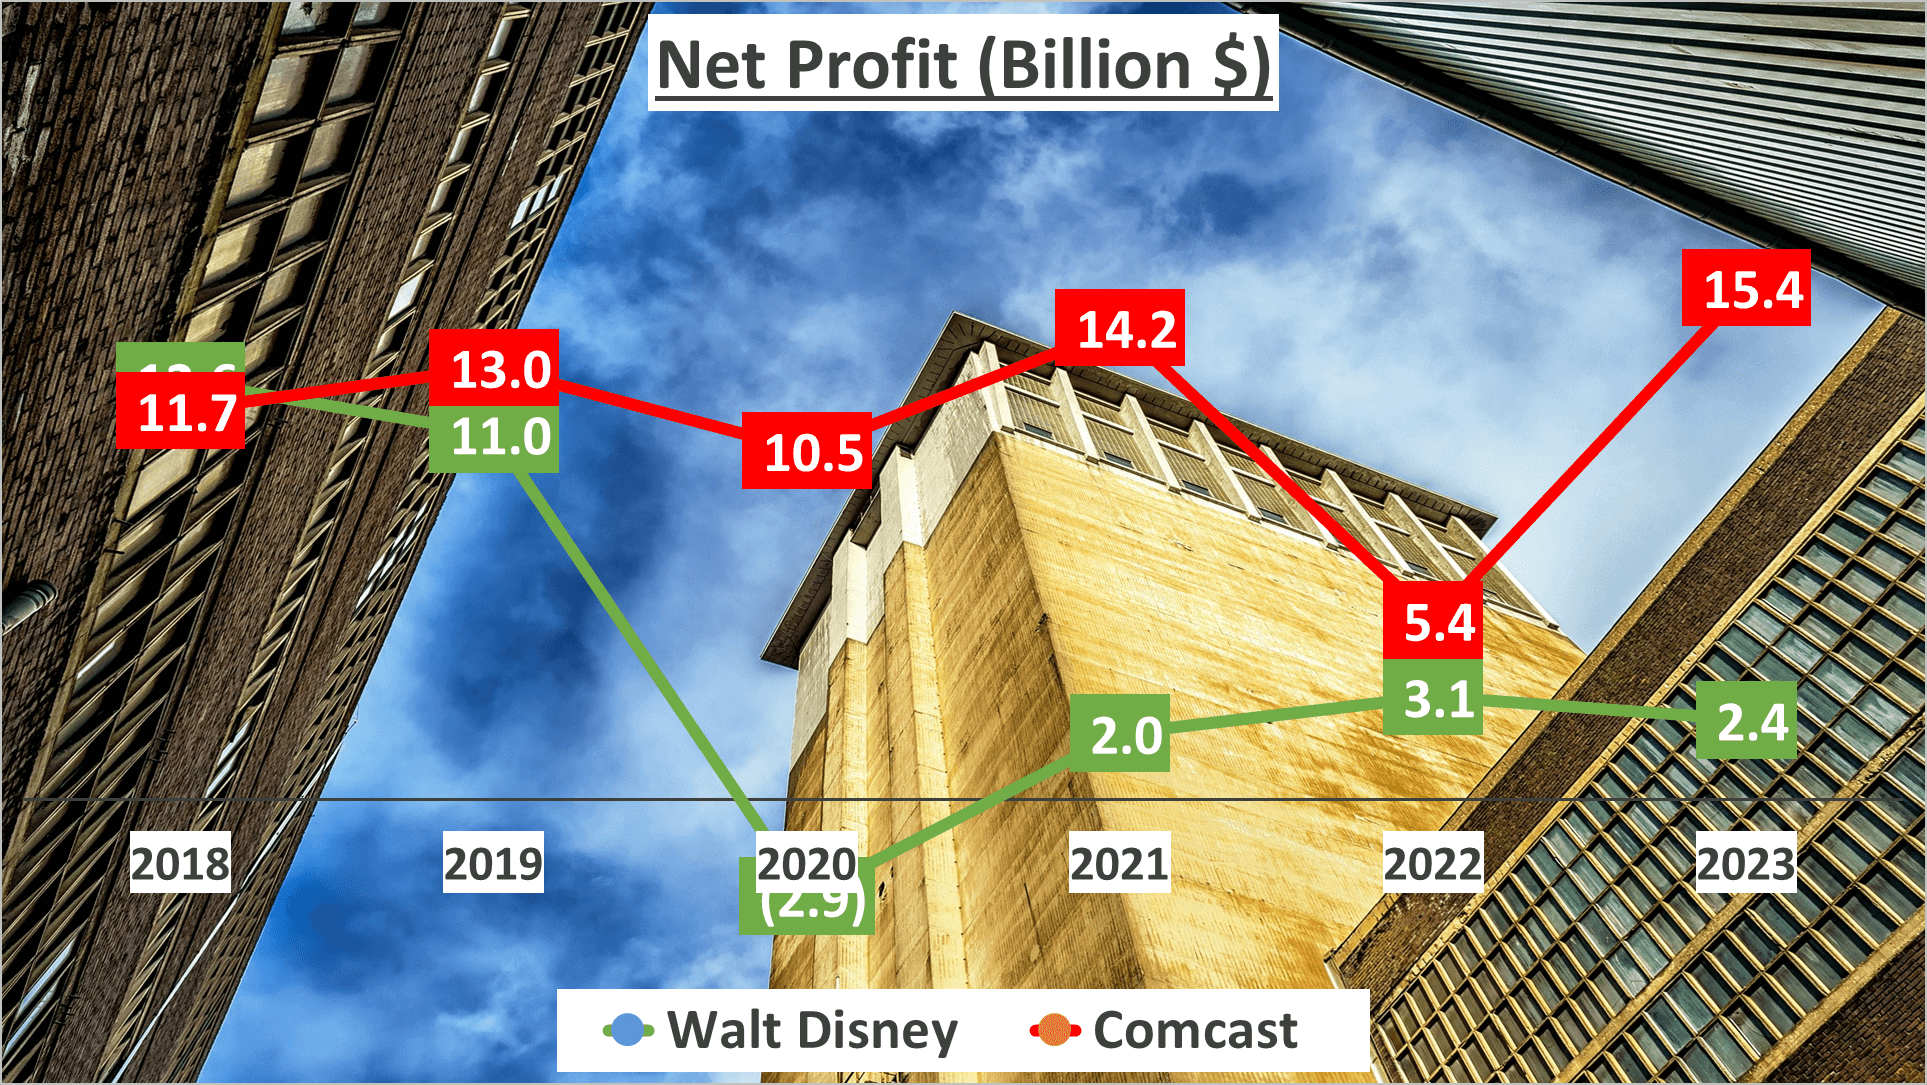
These figures underscore significant differences in profitability. Net profit isn’t merely about numbers; it reflects a company’s efficiency, strategy, and competitive advantage. Walt Disney’s net profit witnessed a negative compound annual growth rate (CAGR) of -28% over the past five years, while Comcast’s net profit grew at a 6% CAGR during the same period.
In conclusion, Comcast holds an edge in profitability. However, investment decisions should encompass more than numbers; understanding the narrative behind the figures is paramount. A healthy profit margin remains a pivotal indicator of a company’s financial robustness.
Assets and Liquidity: Walt Disney vs Comcast Stock Analysis
Assets and liquidity play pivotal roles in evaluating the financial strength of businesses. Let’s examine how Walt Disney and Comcast fare in these aspects.
Starting with total assets, as of the end of 2023, Walt Disney boasts total assets valued at $206B, while Comcast stands at $265B. However, total assets alone do not provide the complete picture. It’s essential to consider net assets as well.
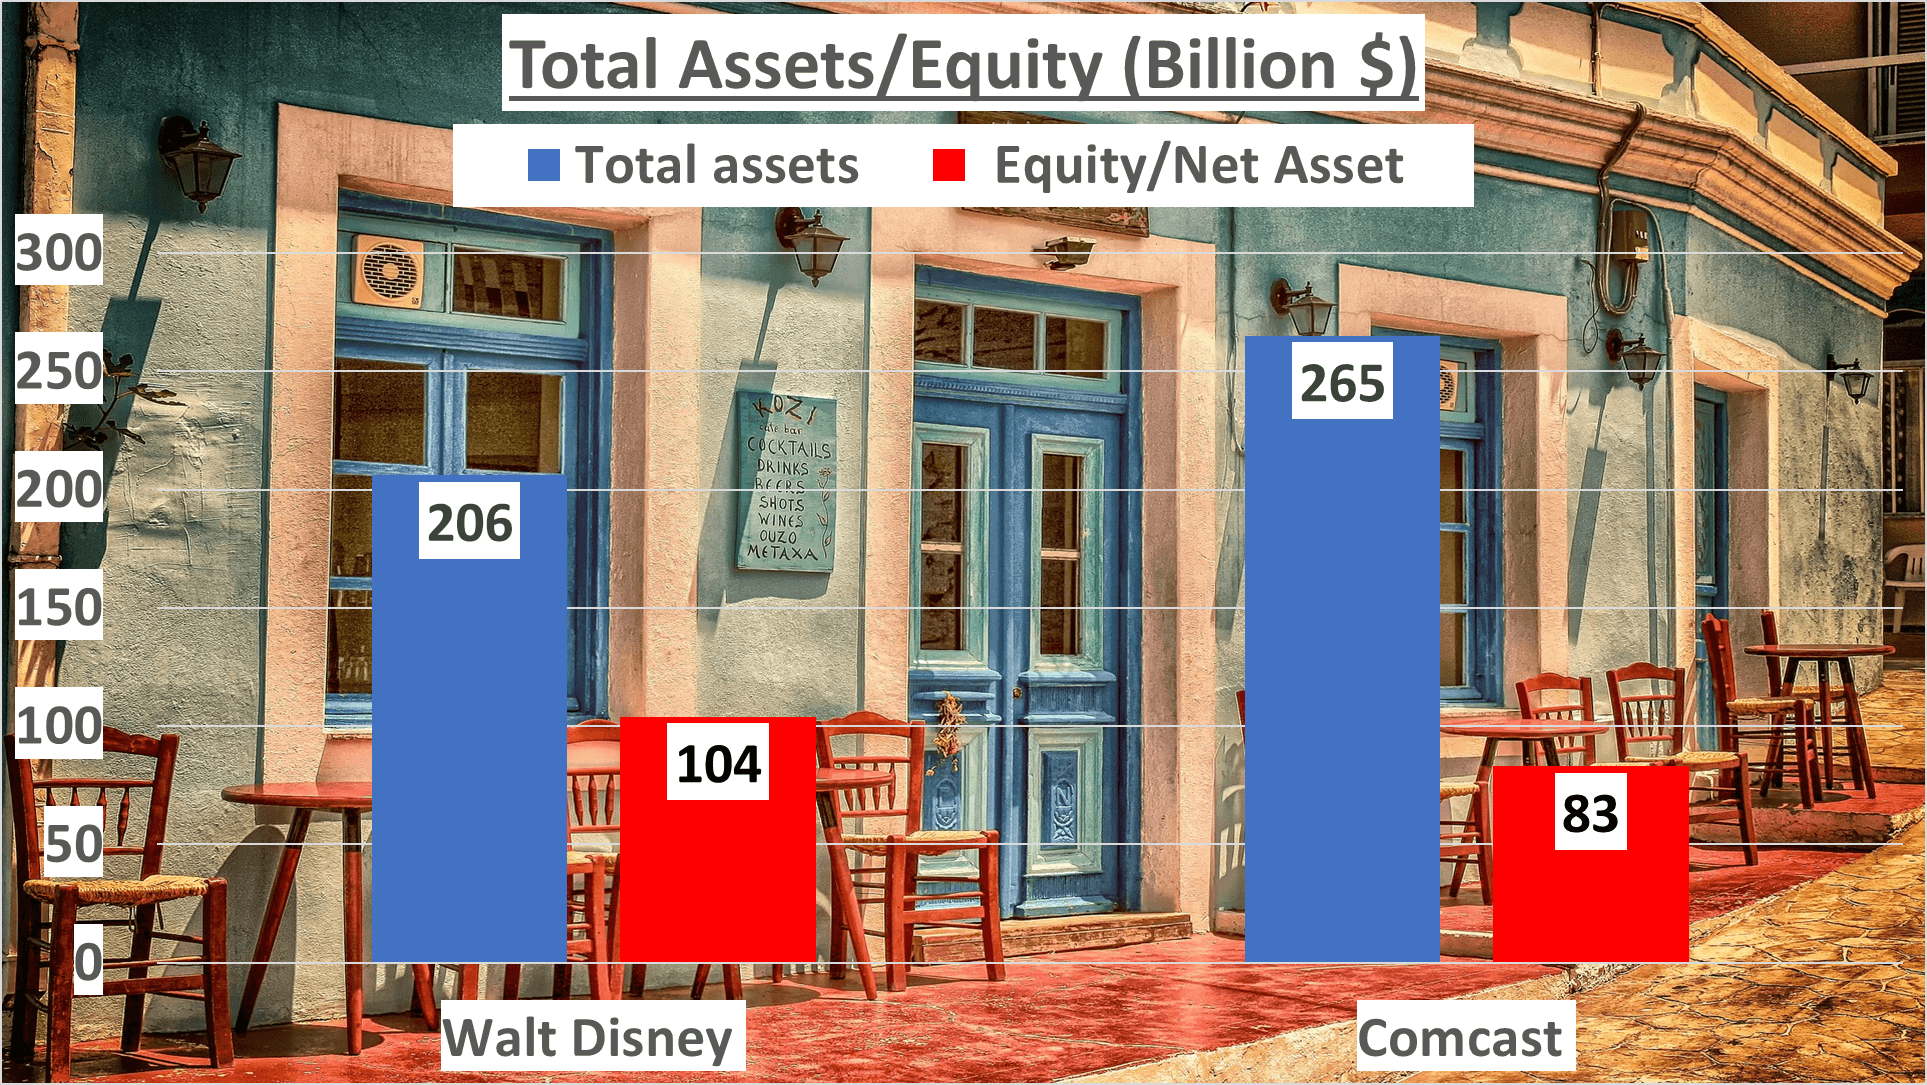
Walt Disney’s net assets amount to $104B, whereas Comcast’s net assets stand at $83B. Now, let’s analyze the equity to total assets ratio, which assesses the proportion of a company’s assets financed by shareholders’ equity.
For Walt Disney, this ratio sits at 51%, compared to Comcast’s 31%, indicating a larger proportion of Disney’s assets financed by equity.
Moving on to liquidity, indicated by the current ratio, Walt Disney posts a ratio of 1.05, while Comcast reports 0.6. This implies Walt Disney’s better capability to cover short-term liabilities.
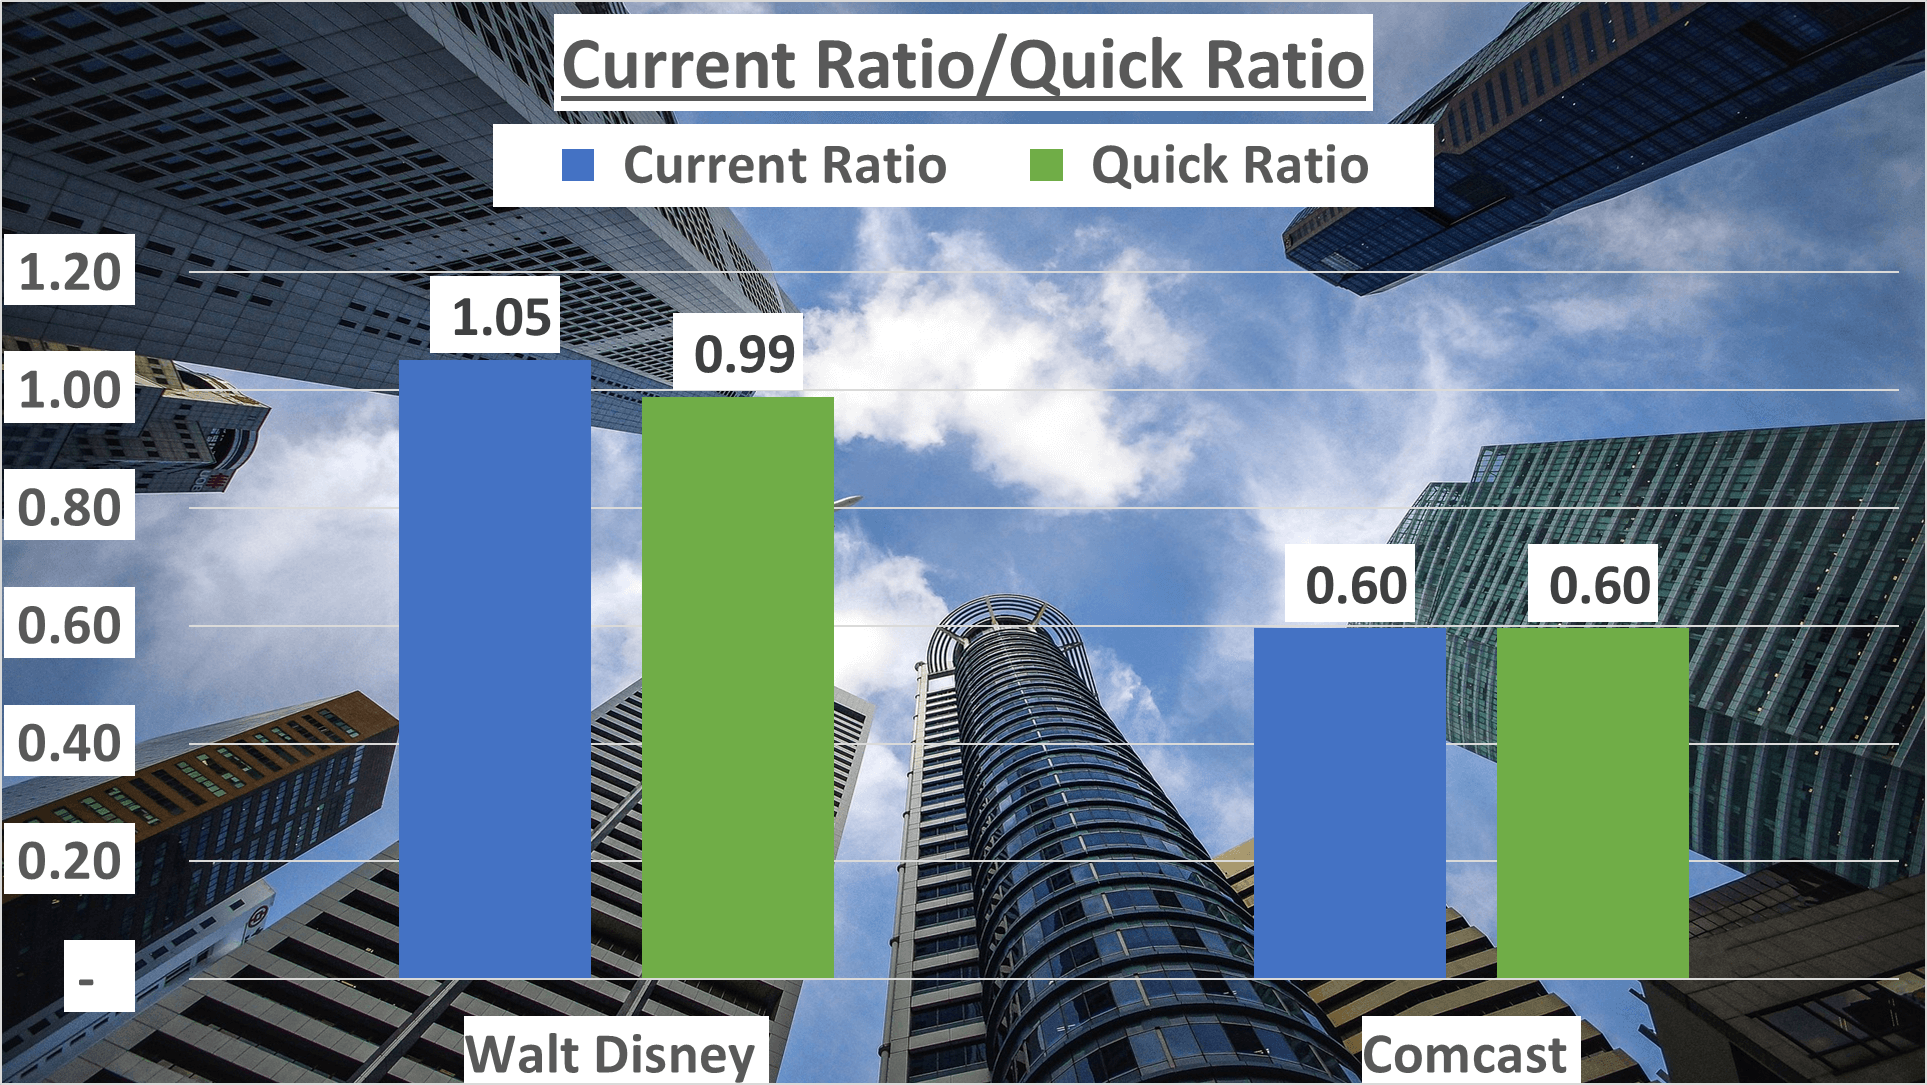
However, the current ratio’s inclusion of inventory poses limitations. Hence, we also consider the quick ratio, excluding inventory from current assets.
For Walt Disney, the quick ratio mirrors its current ratio at 0.99. Similarly, Comcast’s quick ratio matches its current ratio at 0.6, suggesting minimal reliance on inventory for both companies.
In summary, both Walt Disney and Comcast possess significant assets, with Disney having a higher proportion of equity-financed assets. In terms of liquidity, Walt Disney appears better positioned to cover short-term liabilities, as indicated by both current and quick ratios. These metrics provide valuable insights into the financial stability of both entities.
Operational Efficiency and Cash Flow: Walt Disney vs Comcast Stock Analysis
Operational efficiency and cash flow serve as critical metrics for assessing a company’s financial performance.
Beginning with inventory management, Disney takes approximately 11 days to sell its inventory, while Comcast boasts a zero inventory day count. This signifies Comcast’s robust operational efficiency, swiftly converting inventory into sales.
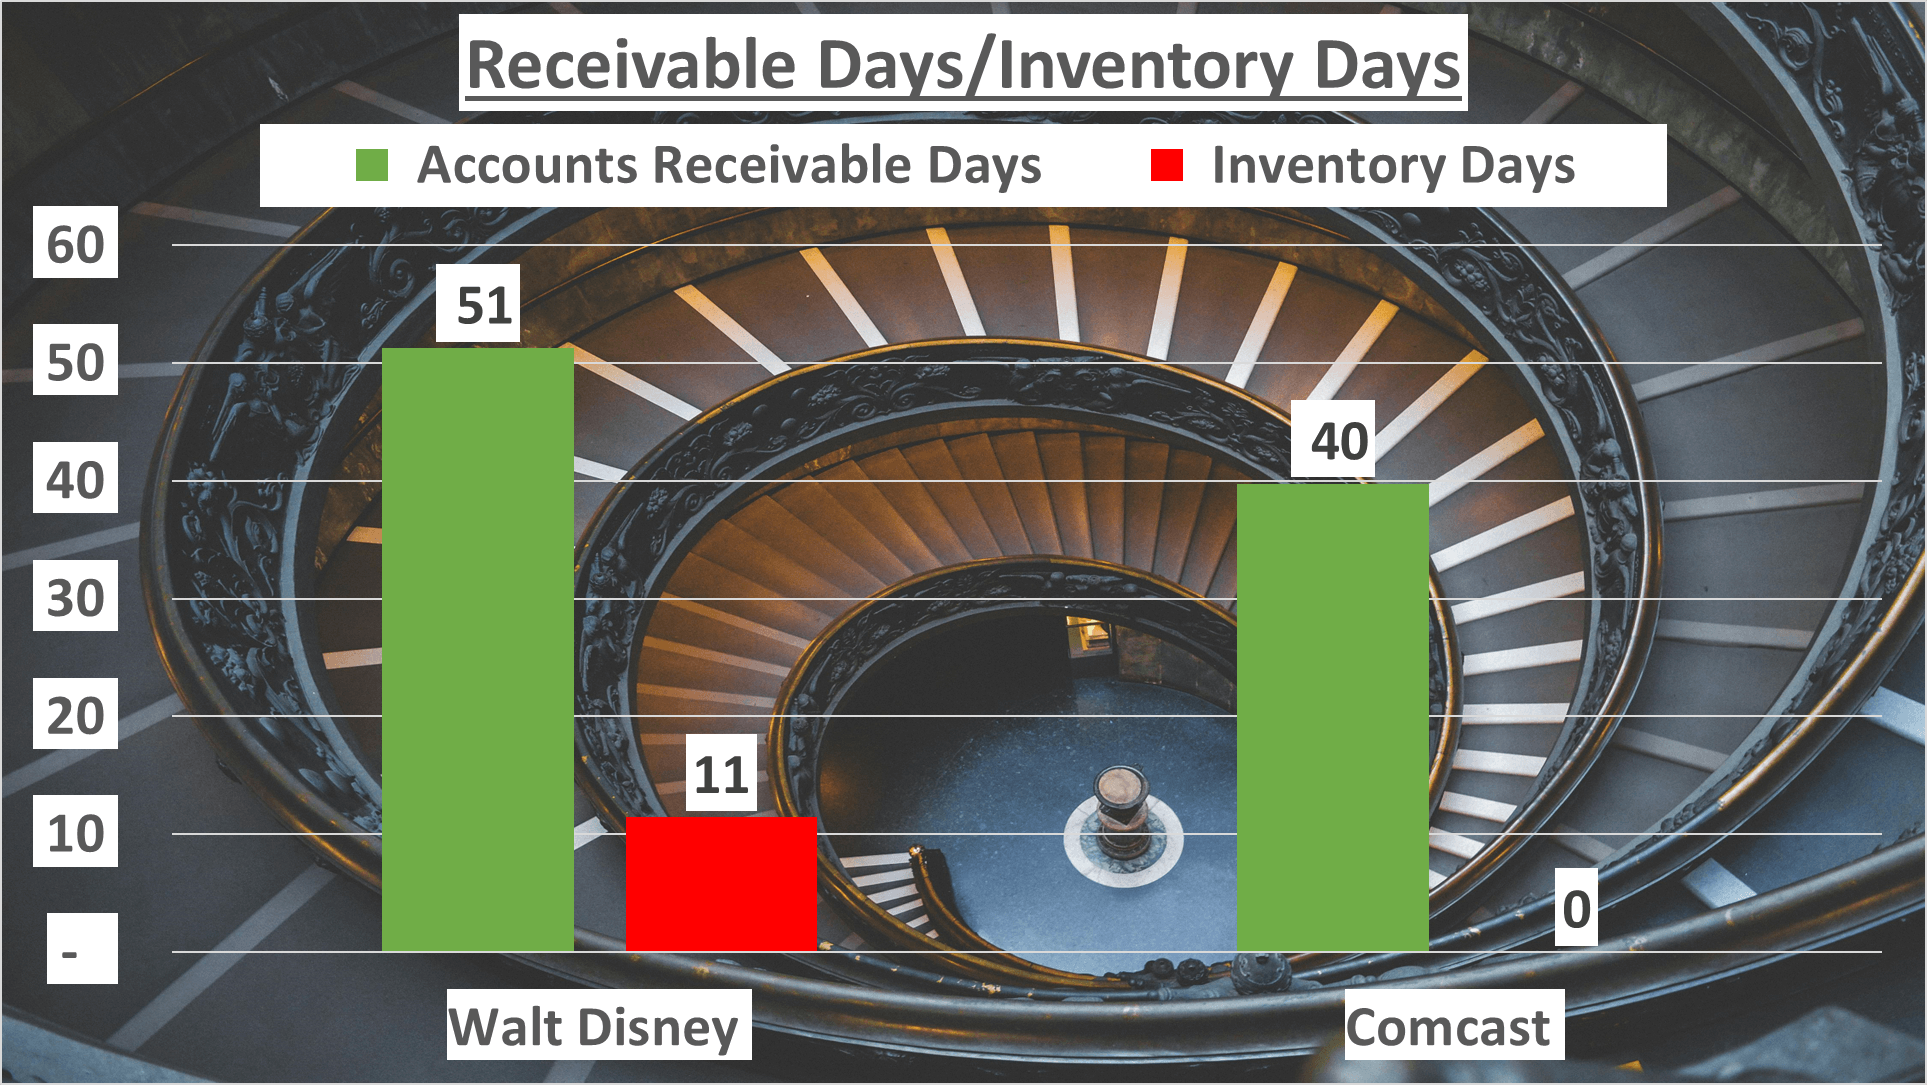
Another significant metric is accounts receivable days, representing the average time taken by a company to collect payment after a sale. Disney’s figure stands at 51 days, whereas Comcast efficiently collects dues in 40 days, indicating superior cash flow management.
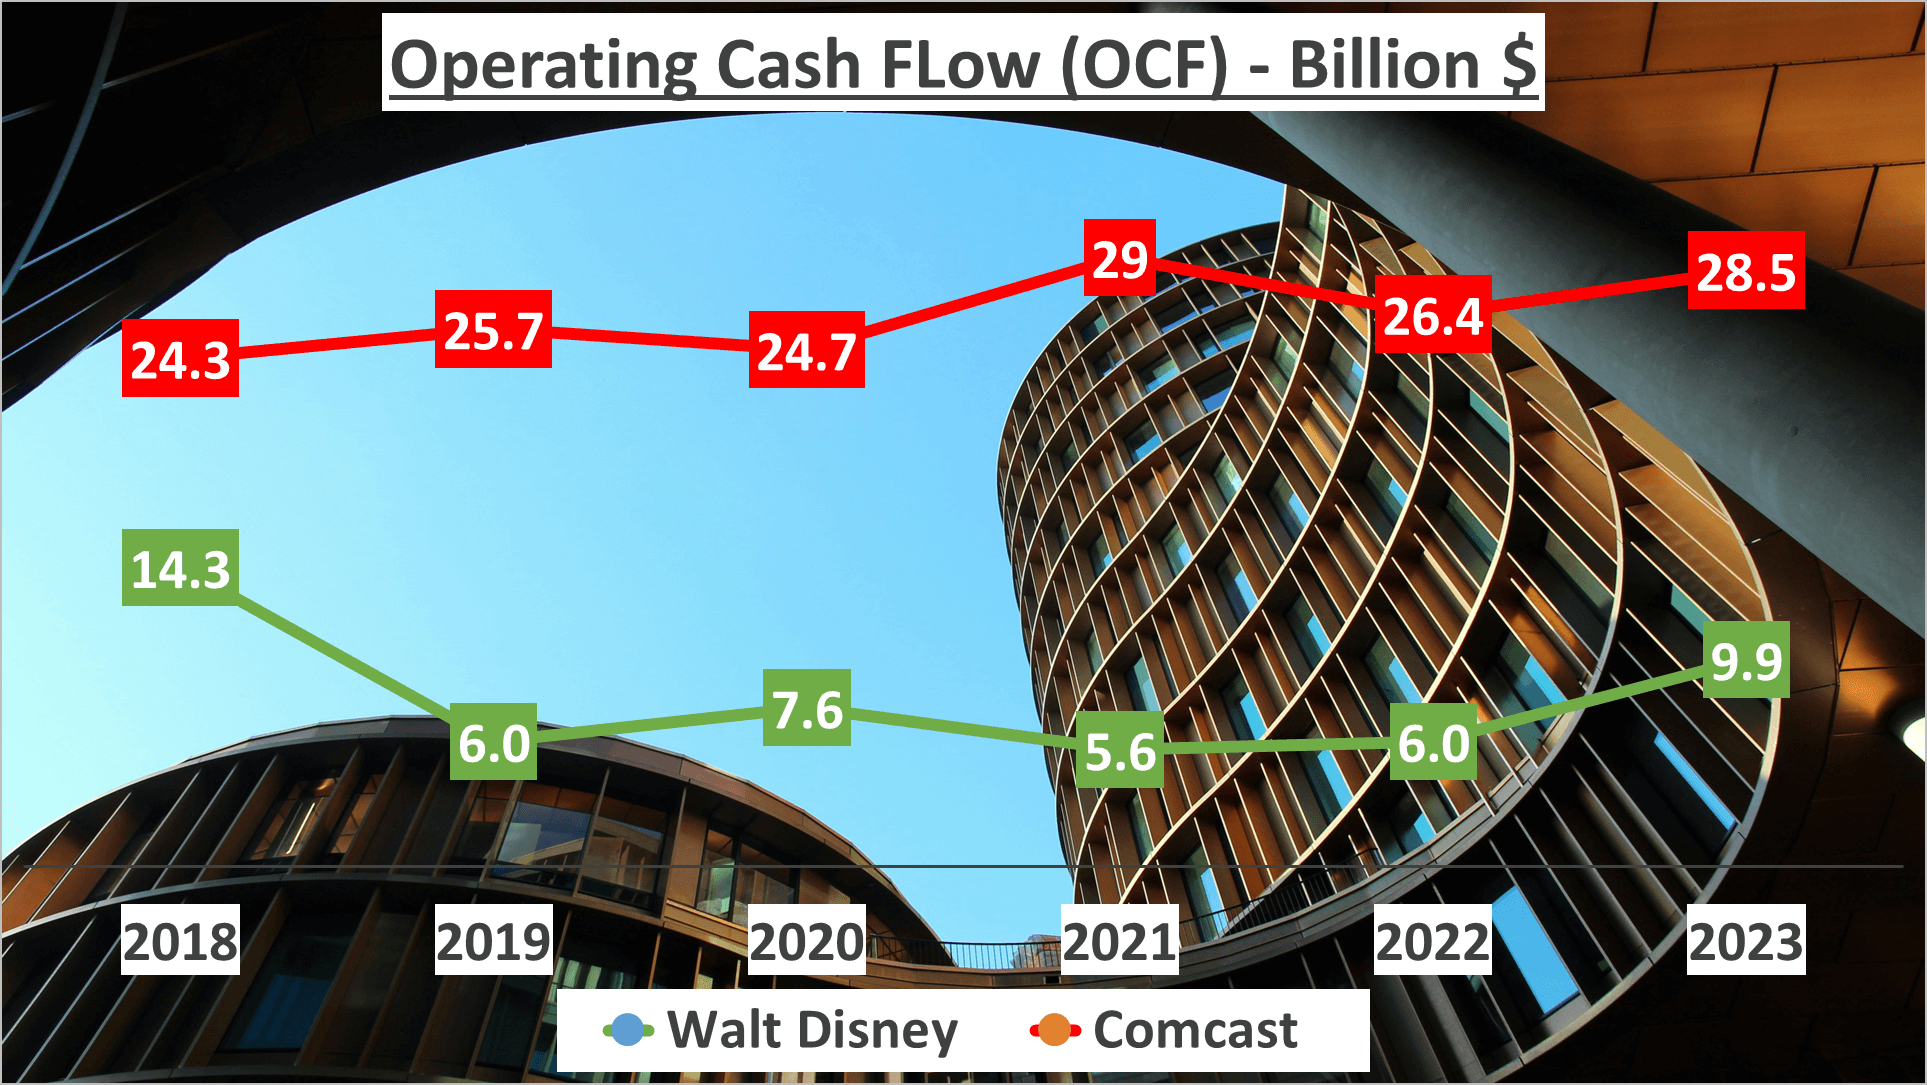
Next, let’s delve into operating cash flow, revealing the cash generated from core business operations. Disney records $9.9 billion in operating cash flow, whereas Comcast impressively generates $28.5 billion.
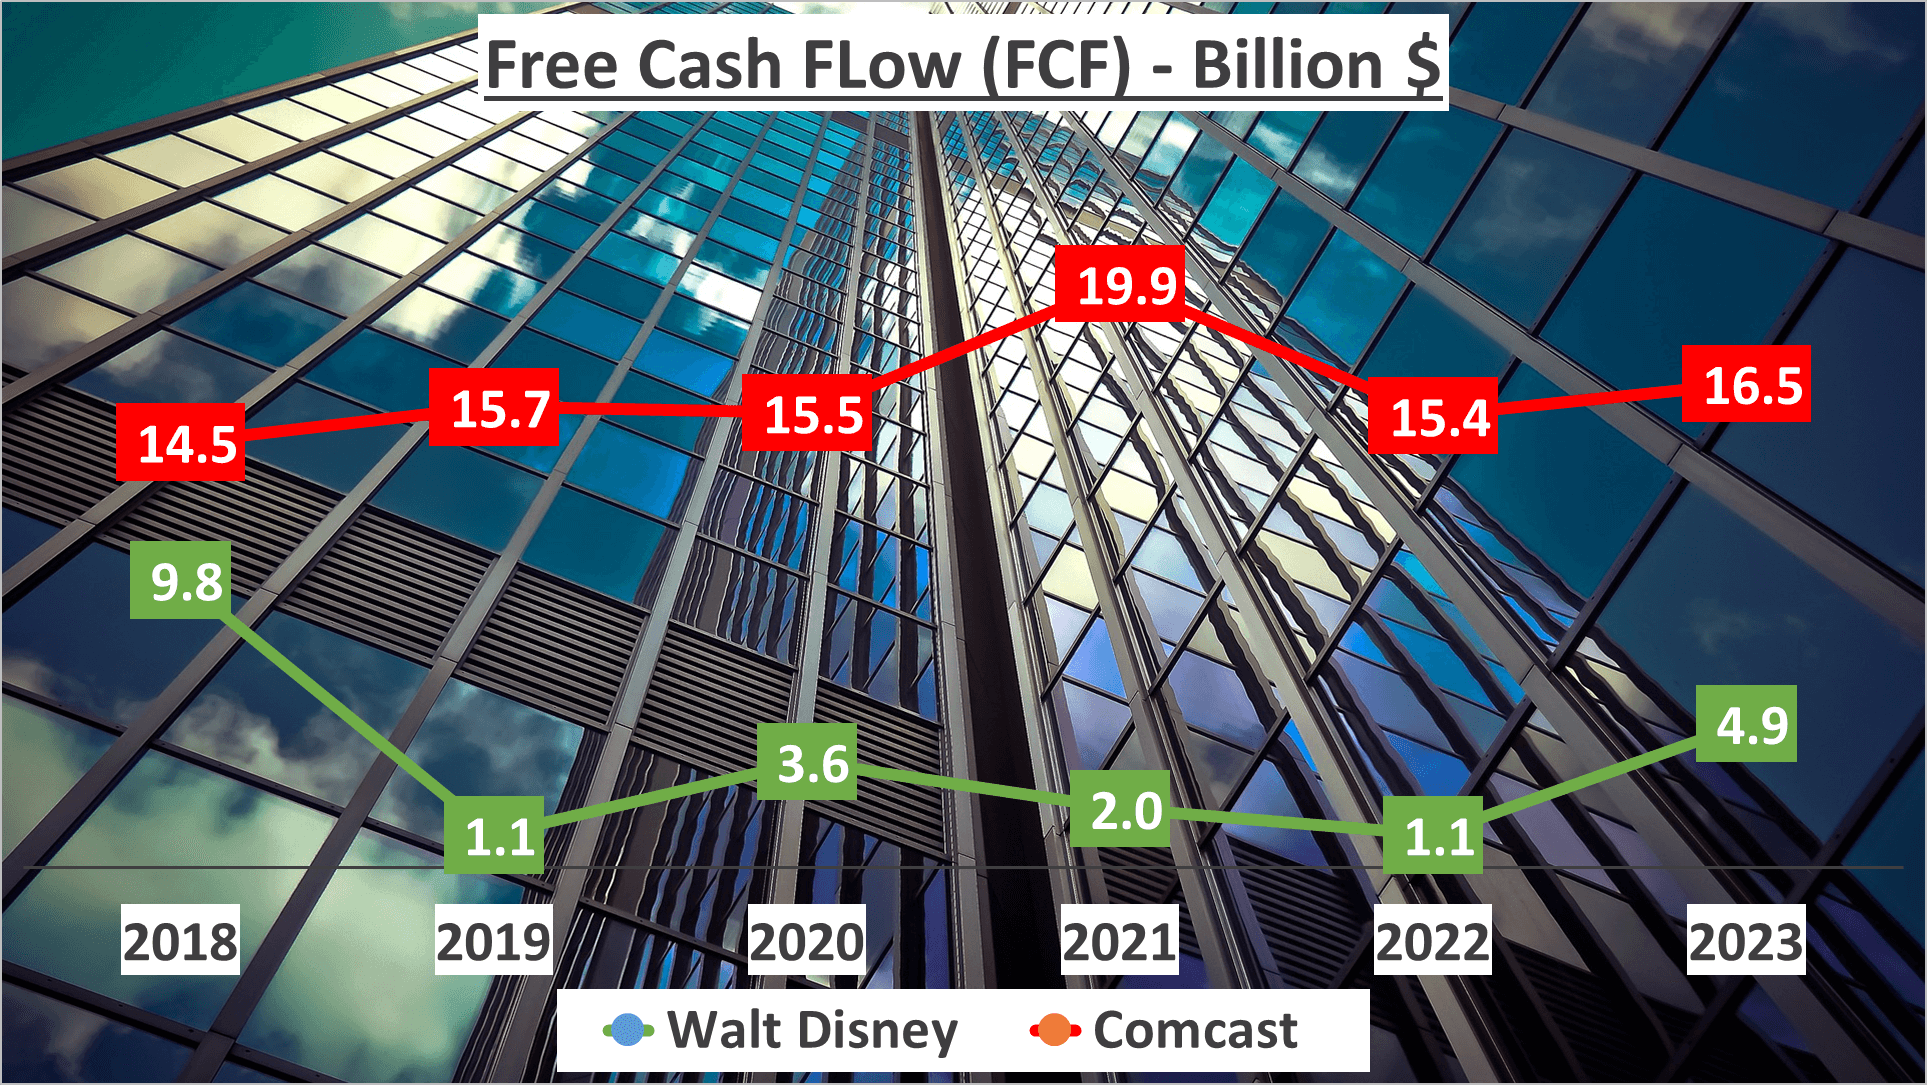
However, the cash flow narrative extends to free cash flow, representing cash generated after essential expenditures. Disney’s free cash flow amounts to $4.9 billion, while Comcast’s notably surpasses at $16.5 billion.
Lastly, comparing the ratio of operating cash flow to net income provides insight into cash generation efficiency. Disney boasts a ratio of 4.1, indicating it generates 4.1 times more cash from operations than net income. Comcast’s ratio of 1.9 signifies nearly double the cash generation compared to net income.
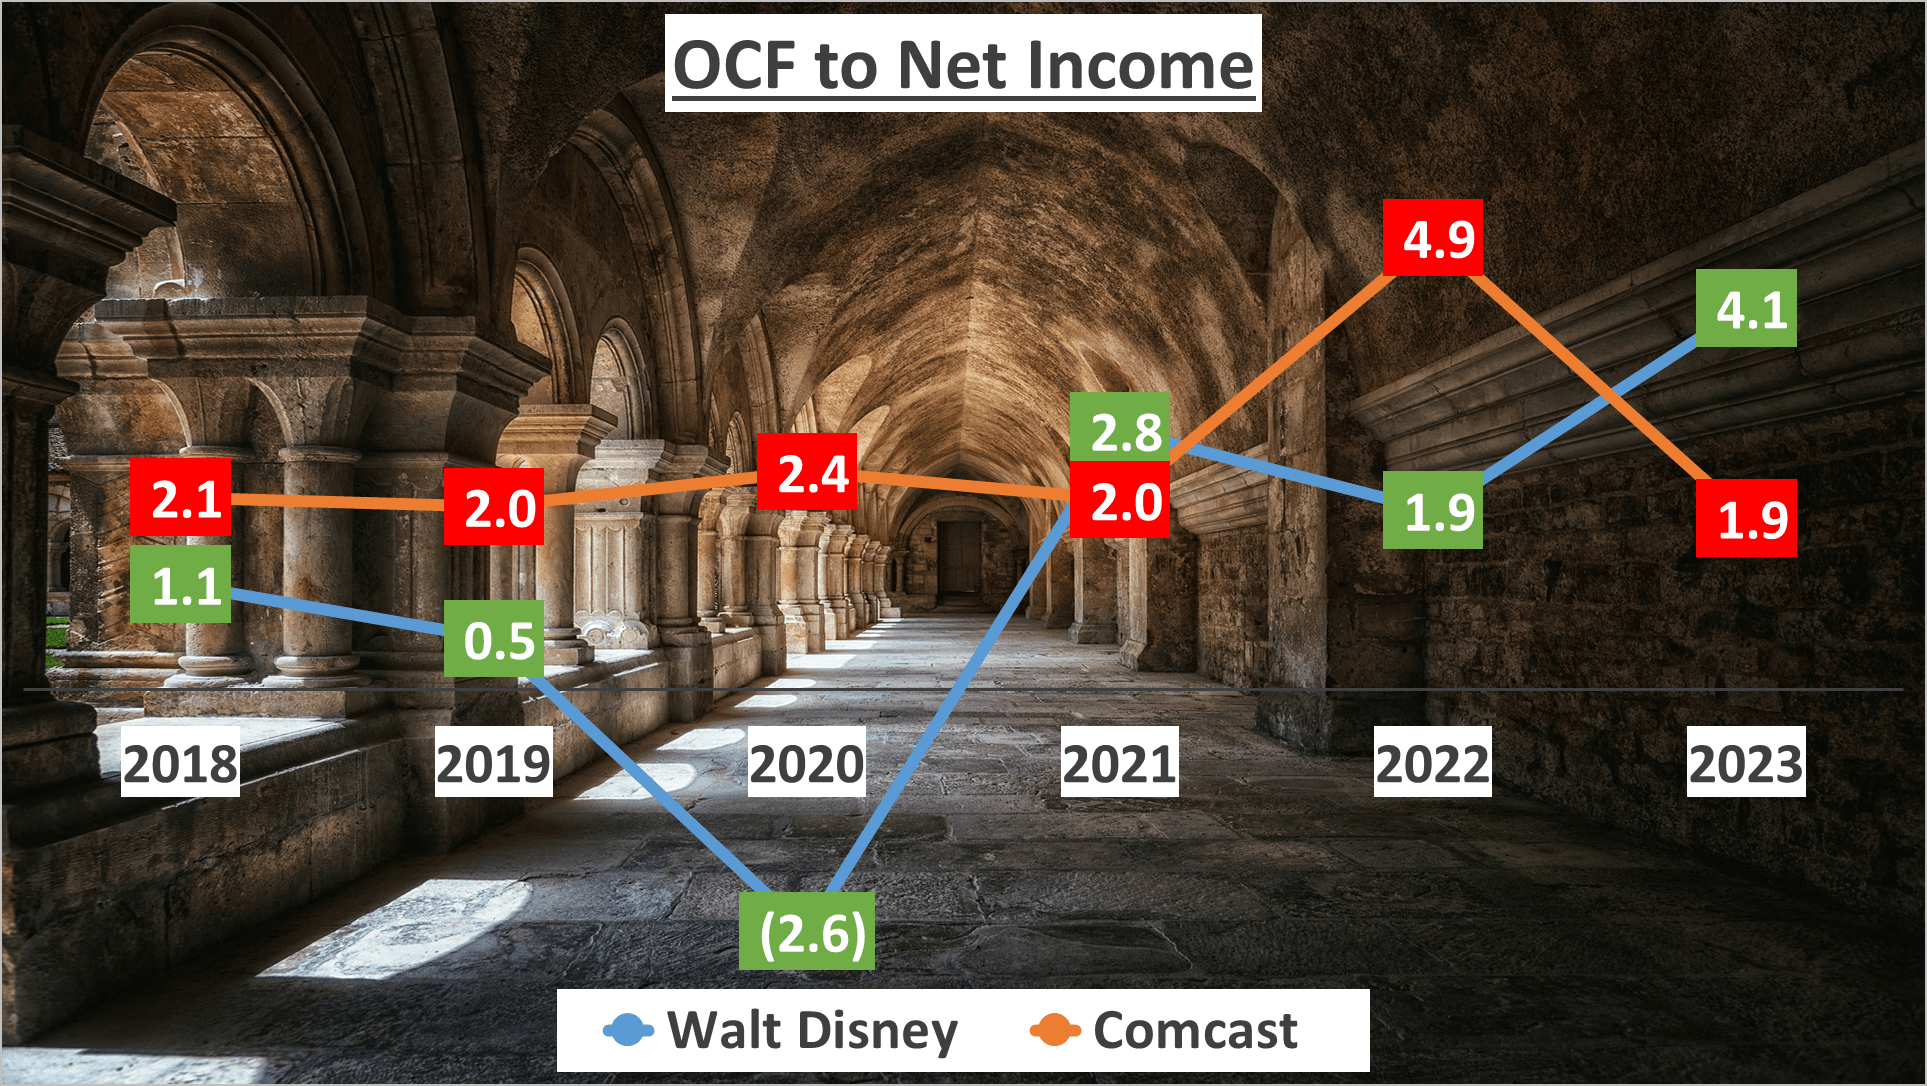
These figures illuminate each company’s adeptness in operational management and cash flow optimization.
Dupont Analysis and Final Thoughts: Walt Disney vs Comcast Stock Analysis
To gain a comprehensive perspective on their financial performance, let’s delve into the Dupont analysis. In 2023, Walt Disney’s return on equity (ROE) stands at 2%, accompanied by a net profit margin of 3%. Their asset turnover ratio is 0.43, with an asset to equity ratio of 1.98.
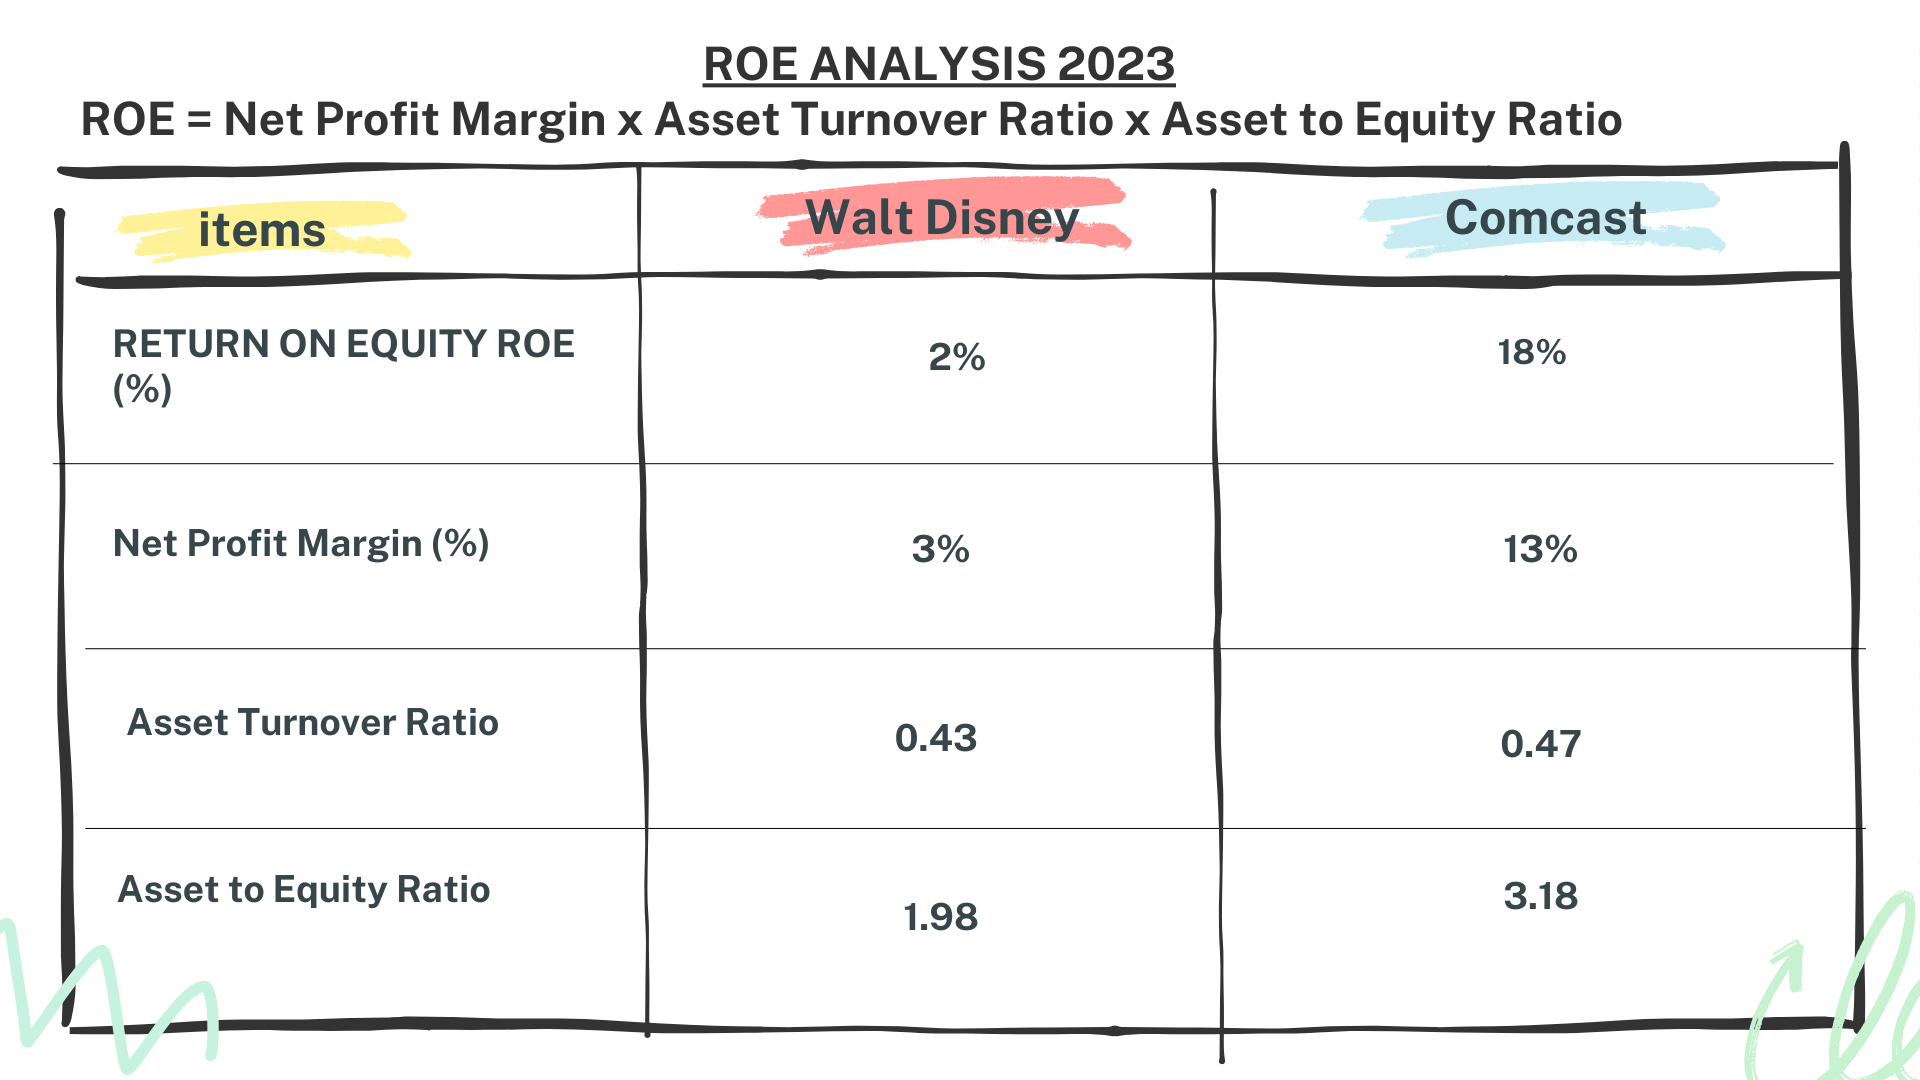
Conversely, Comcast showcases an impressive ROE of 18%, with a net profit margin of 13%. Their asset turnover ratio stands at 0.47, and their asset to equity ratio is 3.18.
Evidently, Comcast surpasses Walt Disney in terms of ROE and net profit margin.
This analysis offers a nuanced insight into each company’s return-generating capabilities and relative efficiencies.
And with that, we conclude our financial comparison of Walt Disney and Comcast.
Which company do you believe is a superior investment? Share your thoughts in the comments below.
Author: investforcus.com
Follow us on Youtube: The Investors Community

