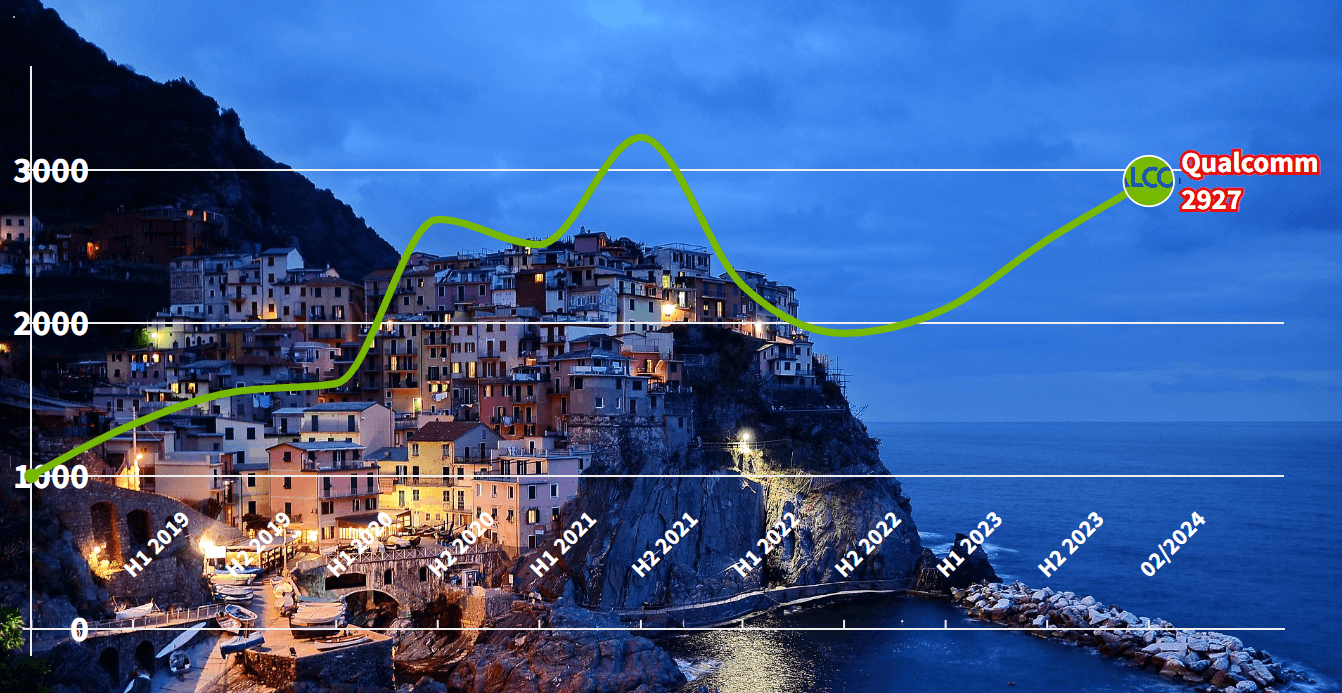
Qualcomm Stock Analysis – Picture this: investing $1000 in Qualcomm back in 2018. Ever wondered what that investment would amount to today, in 2024?
It’s a compelling inquiry, isn’t it? It propels us into the realm of potentialities, openings, and the profound implications of astute investment choices.
As of March 2024, your Qualcomm investment would have burgeoned to $2927, marking a 193% surge or an annualized return of 24%. Now, let’s delve into the reasons behind this growth.
Revenue Analysis – Qualcomm Stock Analysis
In 2023, Qualcomm’s revenue reached $35.8B, reflecting a Compound Annual Growth Rate (CAGR) of 10% from 2018.
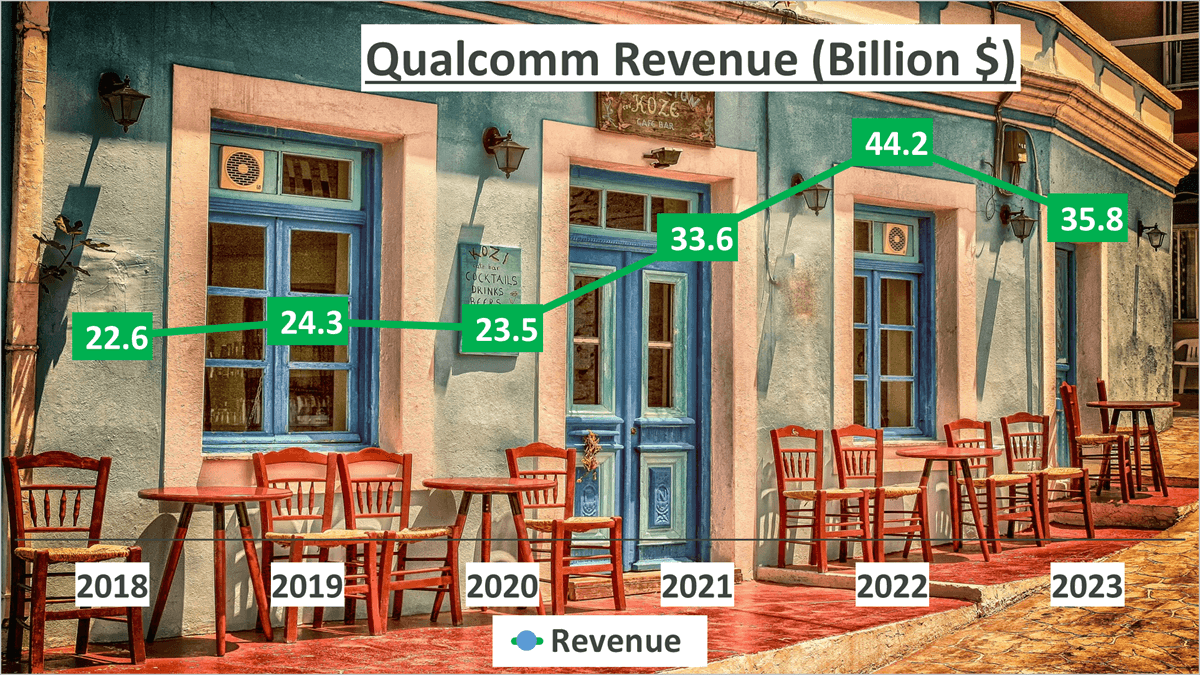
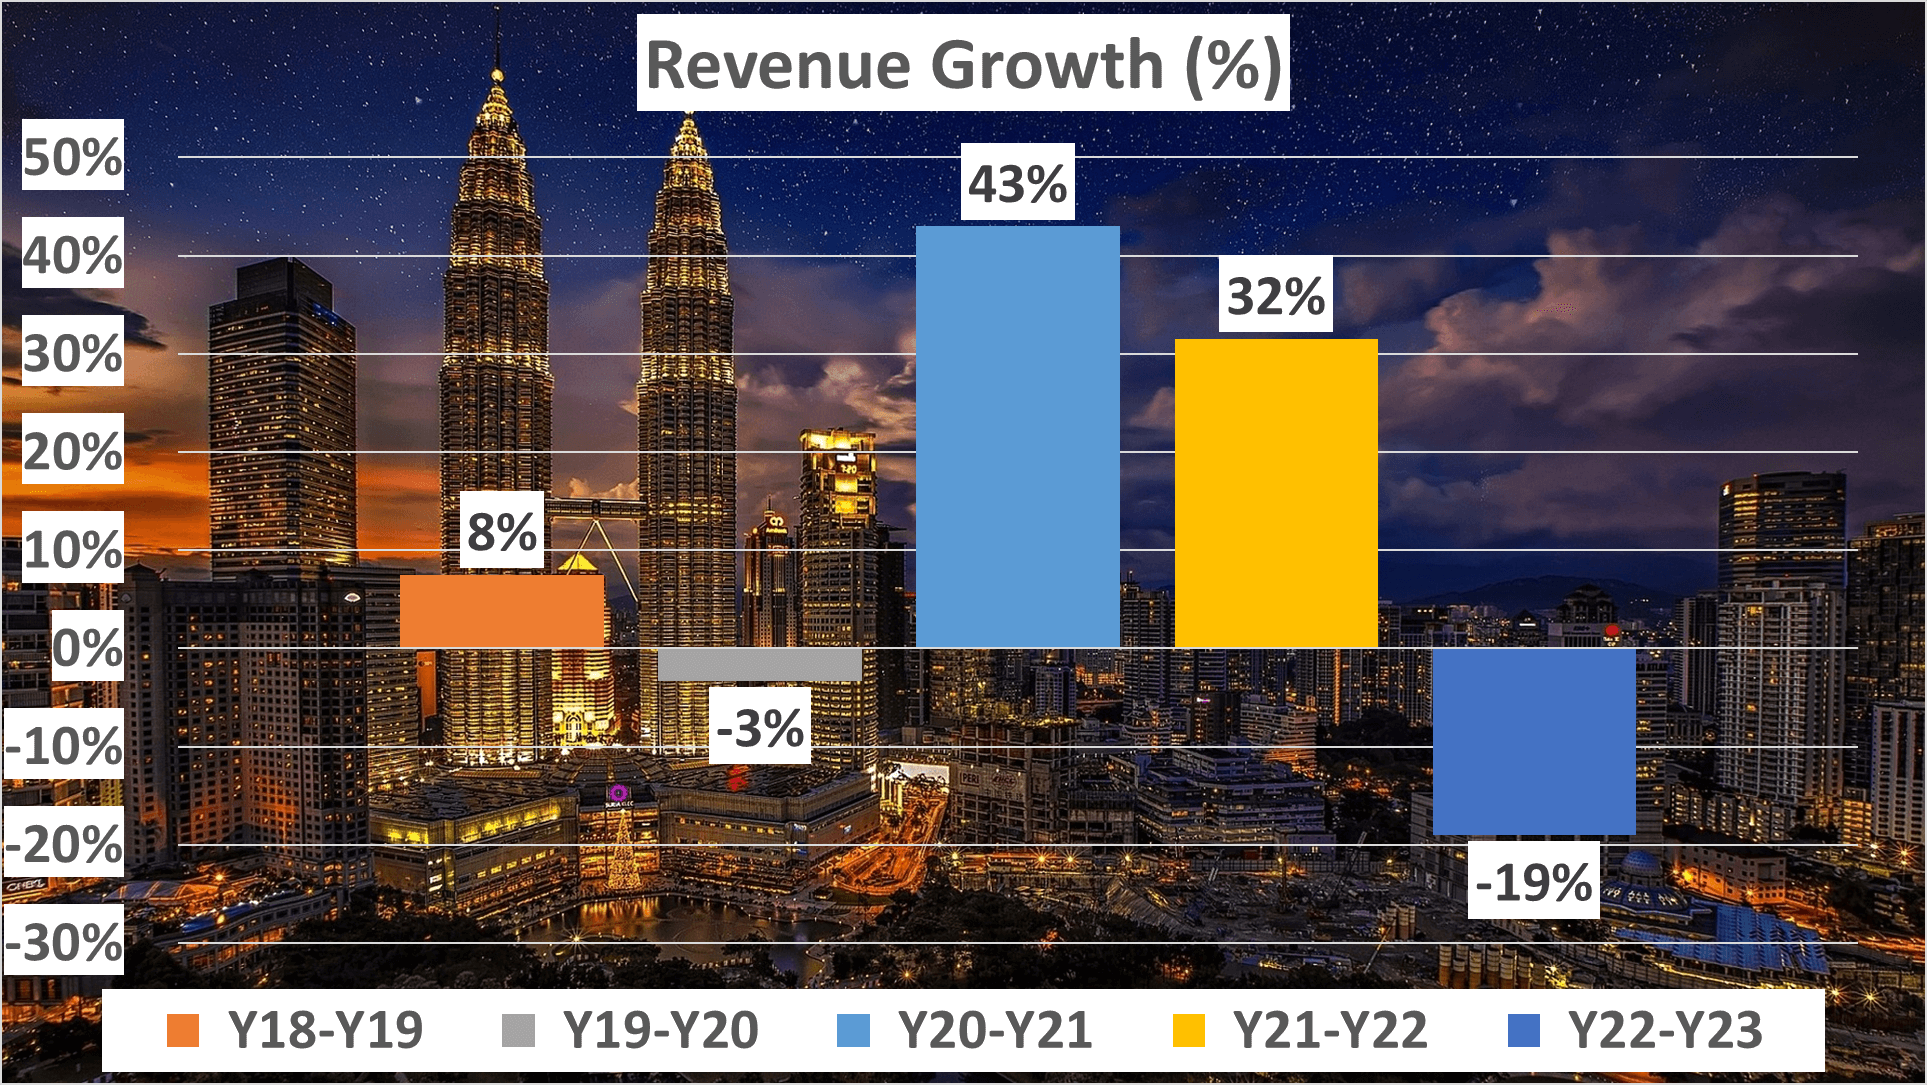
The journey to this milestone witnessed a series of fluctuations. From 2018 to 2019, Qualcomm experienced an 8% revenue growth, followed by a slight 3% decline the subsequent year. However, Qualcomm swiftly rebounded, with a remarkable 43% surge between 2020 and 2021, and a further 32% increase in the succeeding year. Despite a 19% decrease in 2023, the overall growth trajectory remained upward.
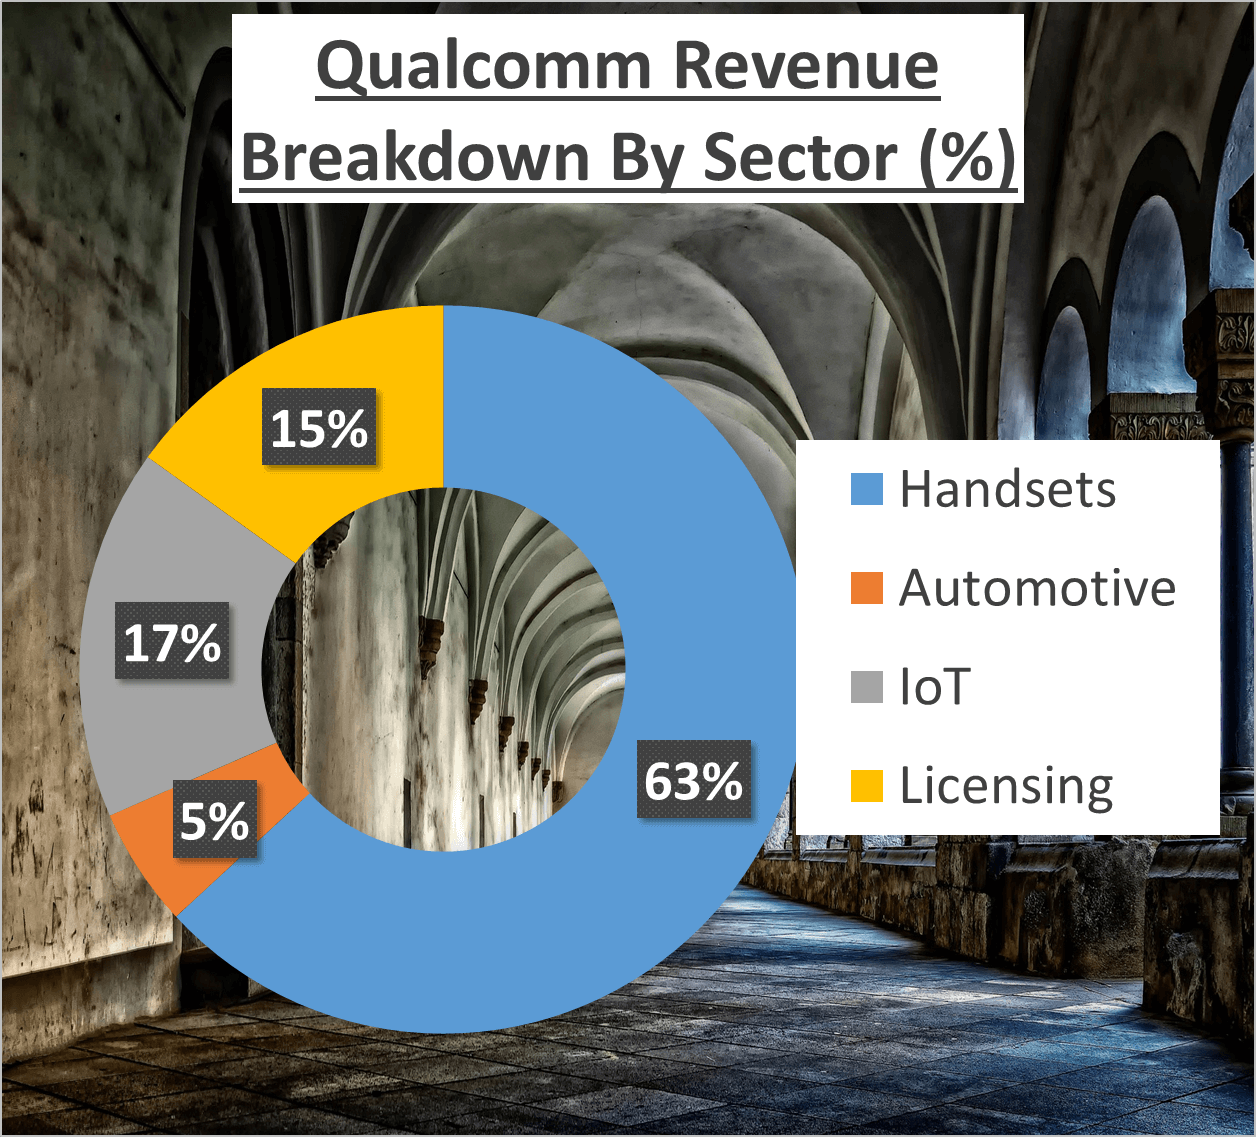
Further dissecting the revenue composition, Handsets dominated, contributing 63% of the total revenue. Automotive and Licensing added 5% and 15% respectively, while IoT accounted for 17% of the revenue.
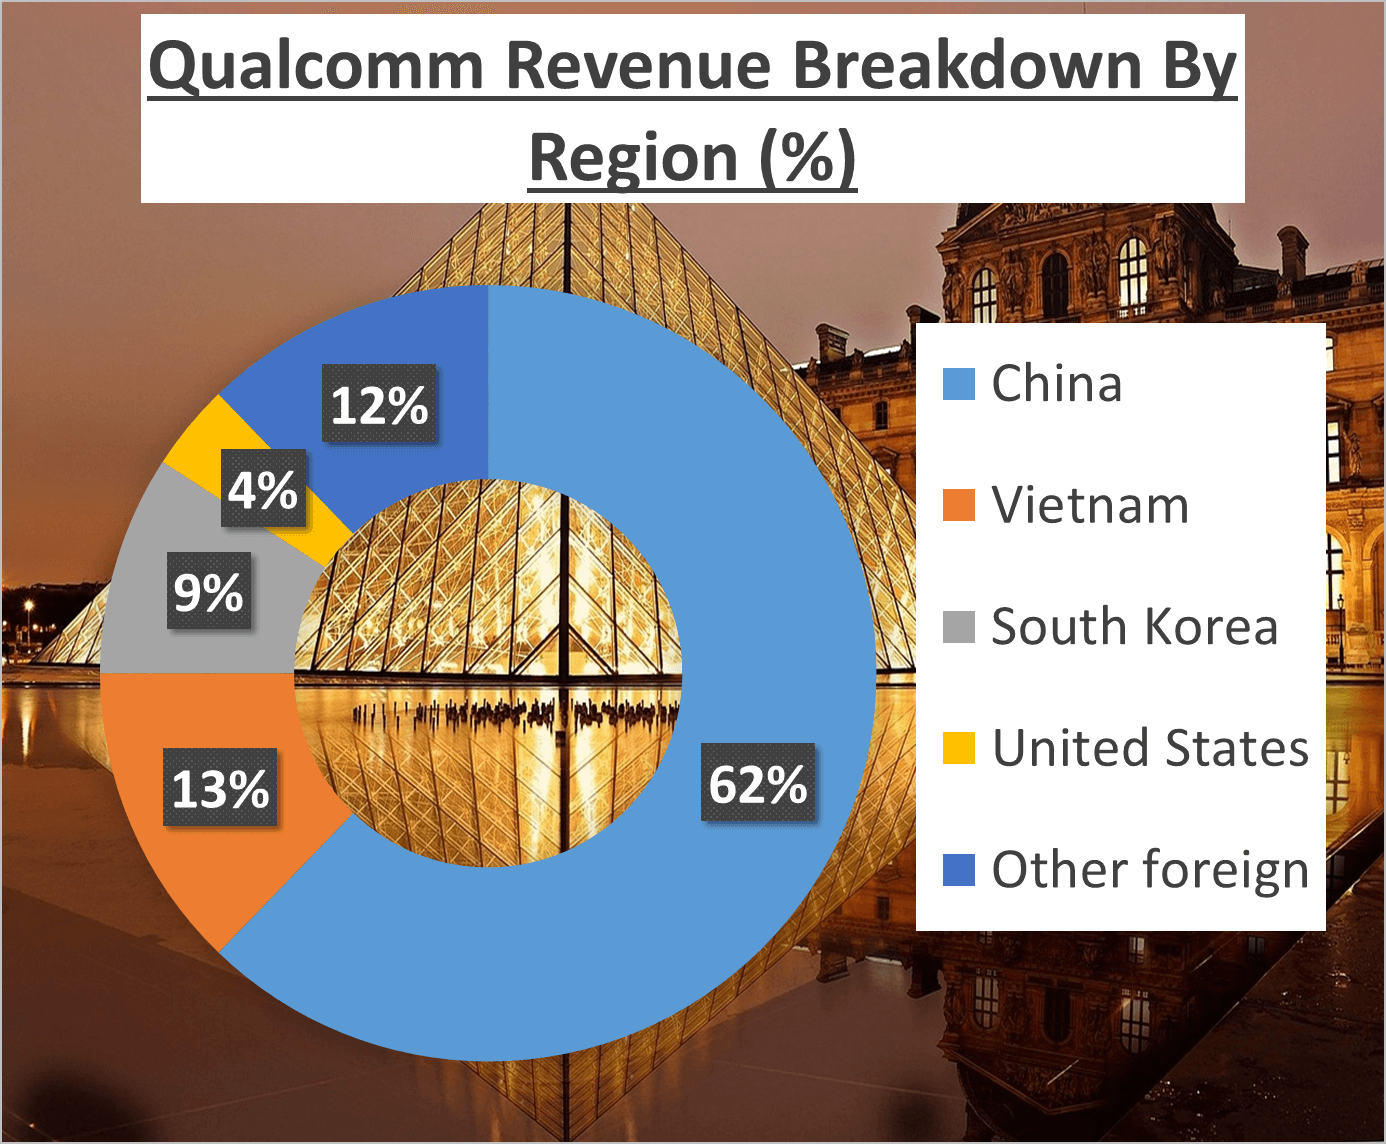
Geographically, China emerged as the primary contributor, contributing 62% of the total revenue. Vietnam followed distantly with 13%, South Korea with 9%, and the United States at 4%. The remaining 12% hailed from other international markets.
Despite varied growth rates, Qualcomm significantly expanded its revenue base over the years. Each year brought its set of challenges and opportunities, yet Qualcomm demonstrated resilience by maintaining a steady growth trajectory. This comprehensive revenue analysis underscores Qualcomm’s dynamic and robust nature, capable of navigating challenges and seizing opportunities effectively.
Profit Margin and Cost Structure – Qualcomm Stock Analysis
In 2023, Qualcomm’s gross profit margin stood at 56%, slightly below its five-year average of 58%. This decline can be attributed to intensified competition, resulting in price reductions for products in the market.
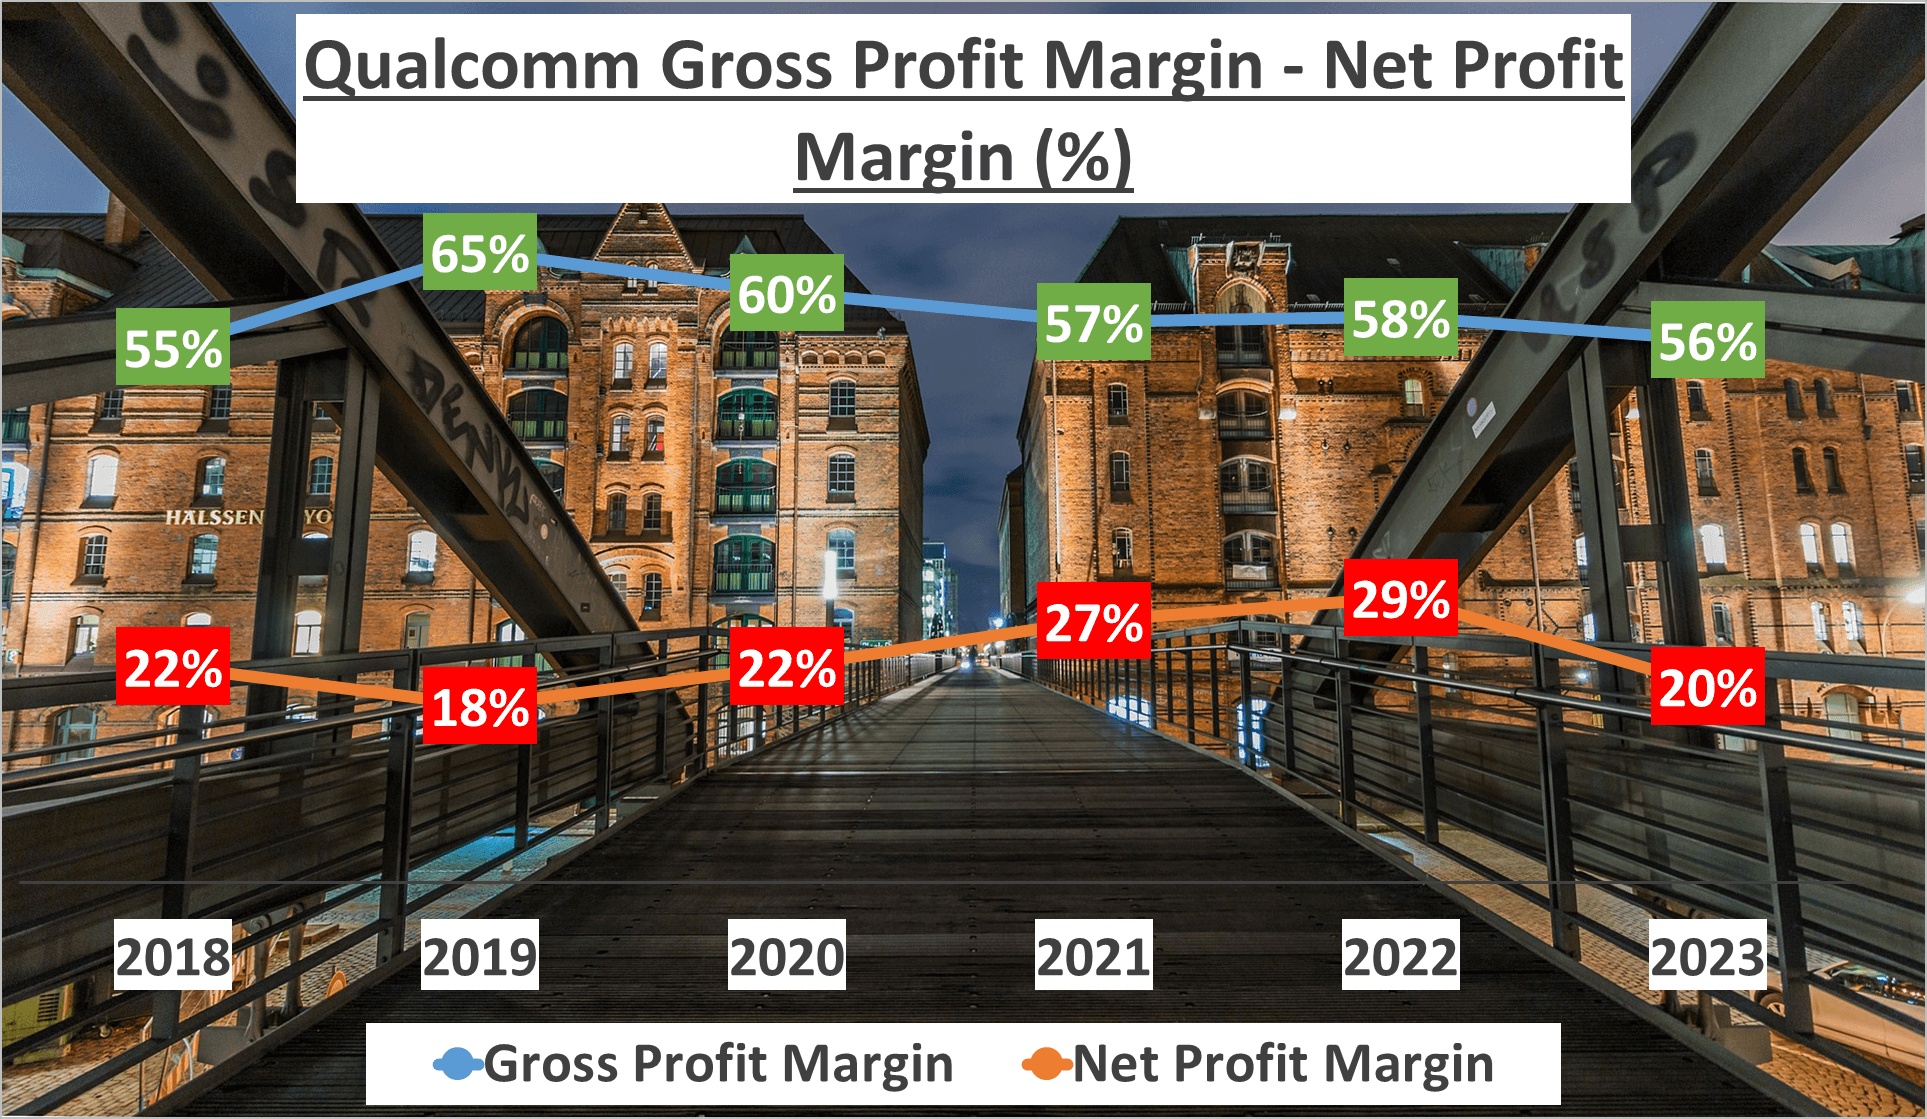
However, Qualcomm’s net profit margin remained at 20%, albeit slightly lower than the five-year average of 23%. This decrease was driven by rising research and development costs aimed at bolstering competitiveness within the industry.
Now, let’s explore Qualcomm’s cost structure. Besides the cost of revenue, the two significant expenses as a percentage of revenue in 2023 were research and development, accounting for 25%, and sales, general, and administrative expenses, representing 7%. Interestingly, these costs have been on a downward trajectory since 2018, showcasing Qualcomm’s adeptness in cost management strategies.
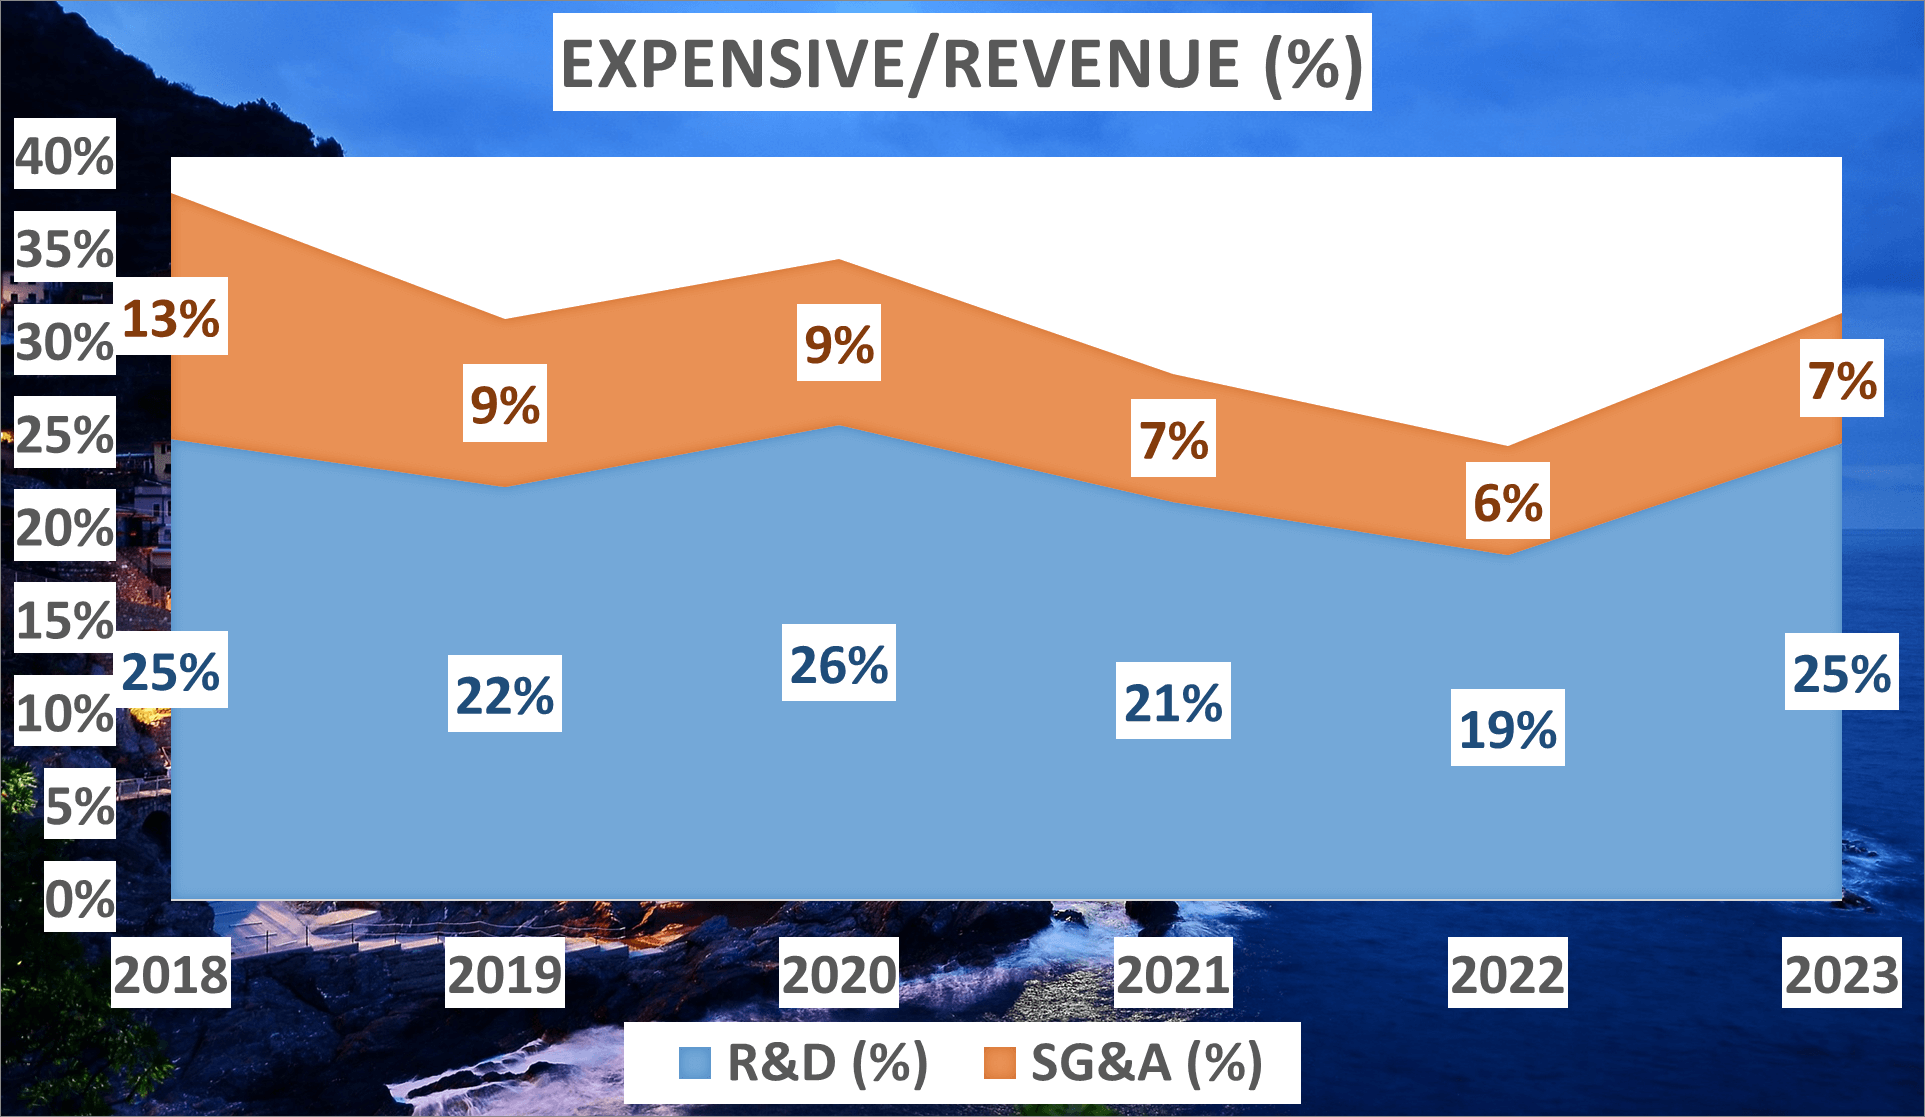
The substantial investment in research and development is an encouraging indicator. It underscores Qualcomm’s commitment to sustaining its competitive edge in the industry, which is paramount in the rapidly evolving realm of technology. Thus, despite a slightly diminished gross profit margin, Qualcomm has effectively managed its costs, contributing to a robust net profit margin. This underscores the company’s financial robustness and its ability to navigate the competitive landscape, rendering it an attractive prospect for investors.
Profit and Assets – Qualcomm Stock Analysis
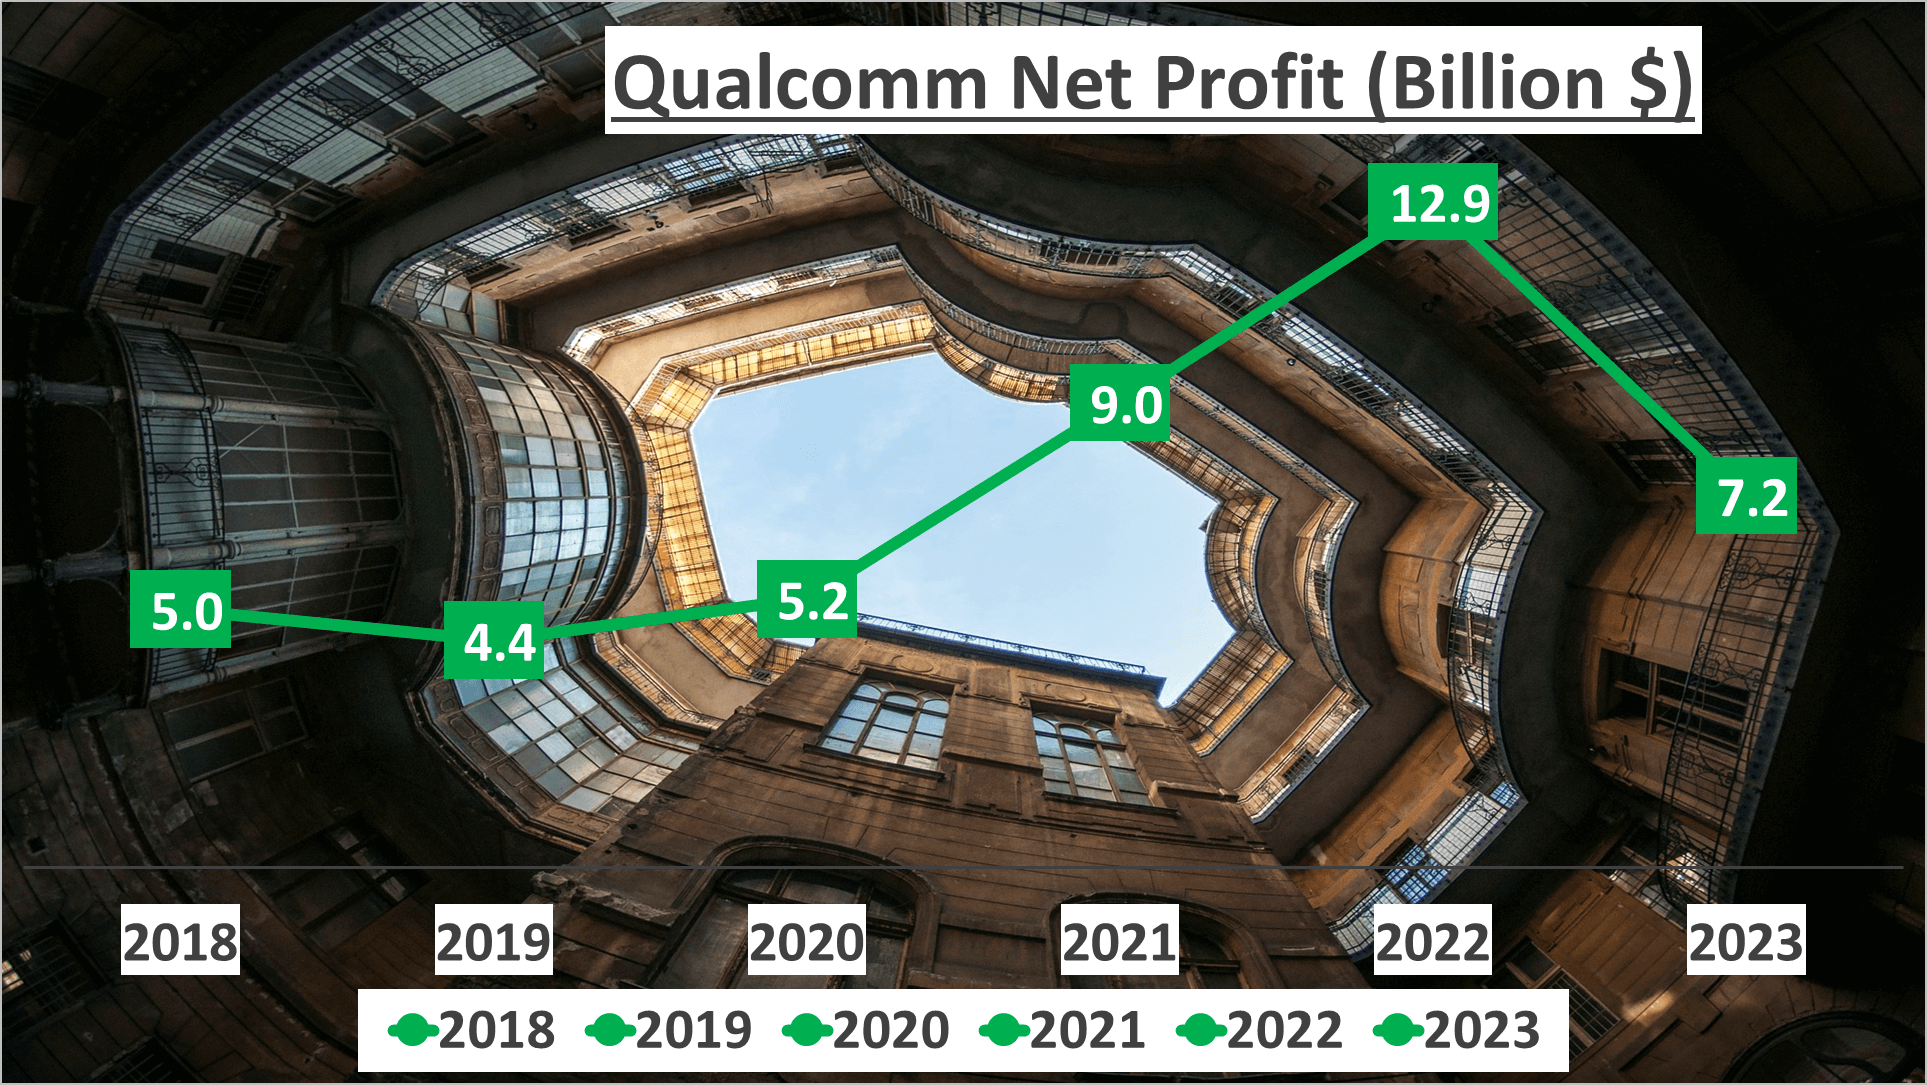
In 2023, Qualcomm’s net profit amounted to $7.2 billion, growing at a compound annual growth rate (CAGR) of 8% since 2018. However, this growth trajectory wasn’t consistently upward. The peak of net profit was reached in 2022, at $12.9 billion. Currently, Qualcomm faces the challenge of boosting revenue to enhance net profit.
Shifting focus to assets, Qualcomm’s total assets in 2023 totaled $51 billion, slightly up from $49 billion in 2022. Net assets for 2023 stood at $21.6 billion, a rise from $18 billion the previous year. This indicates a consistent expansion in the company’s asset base over time.
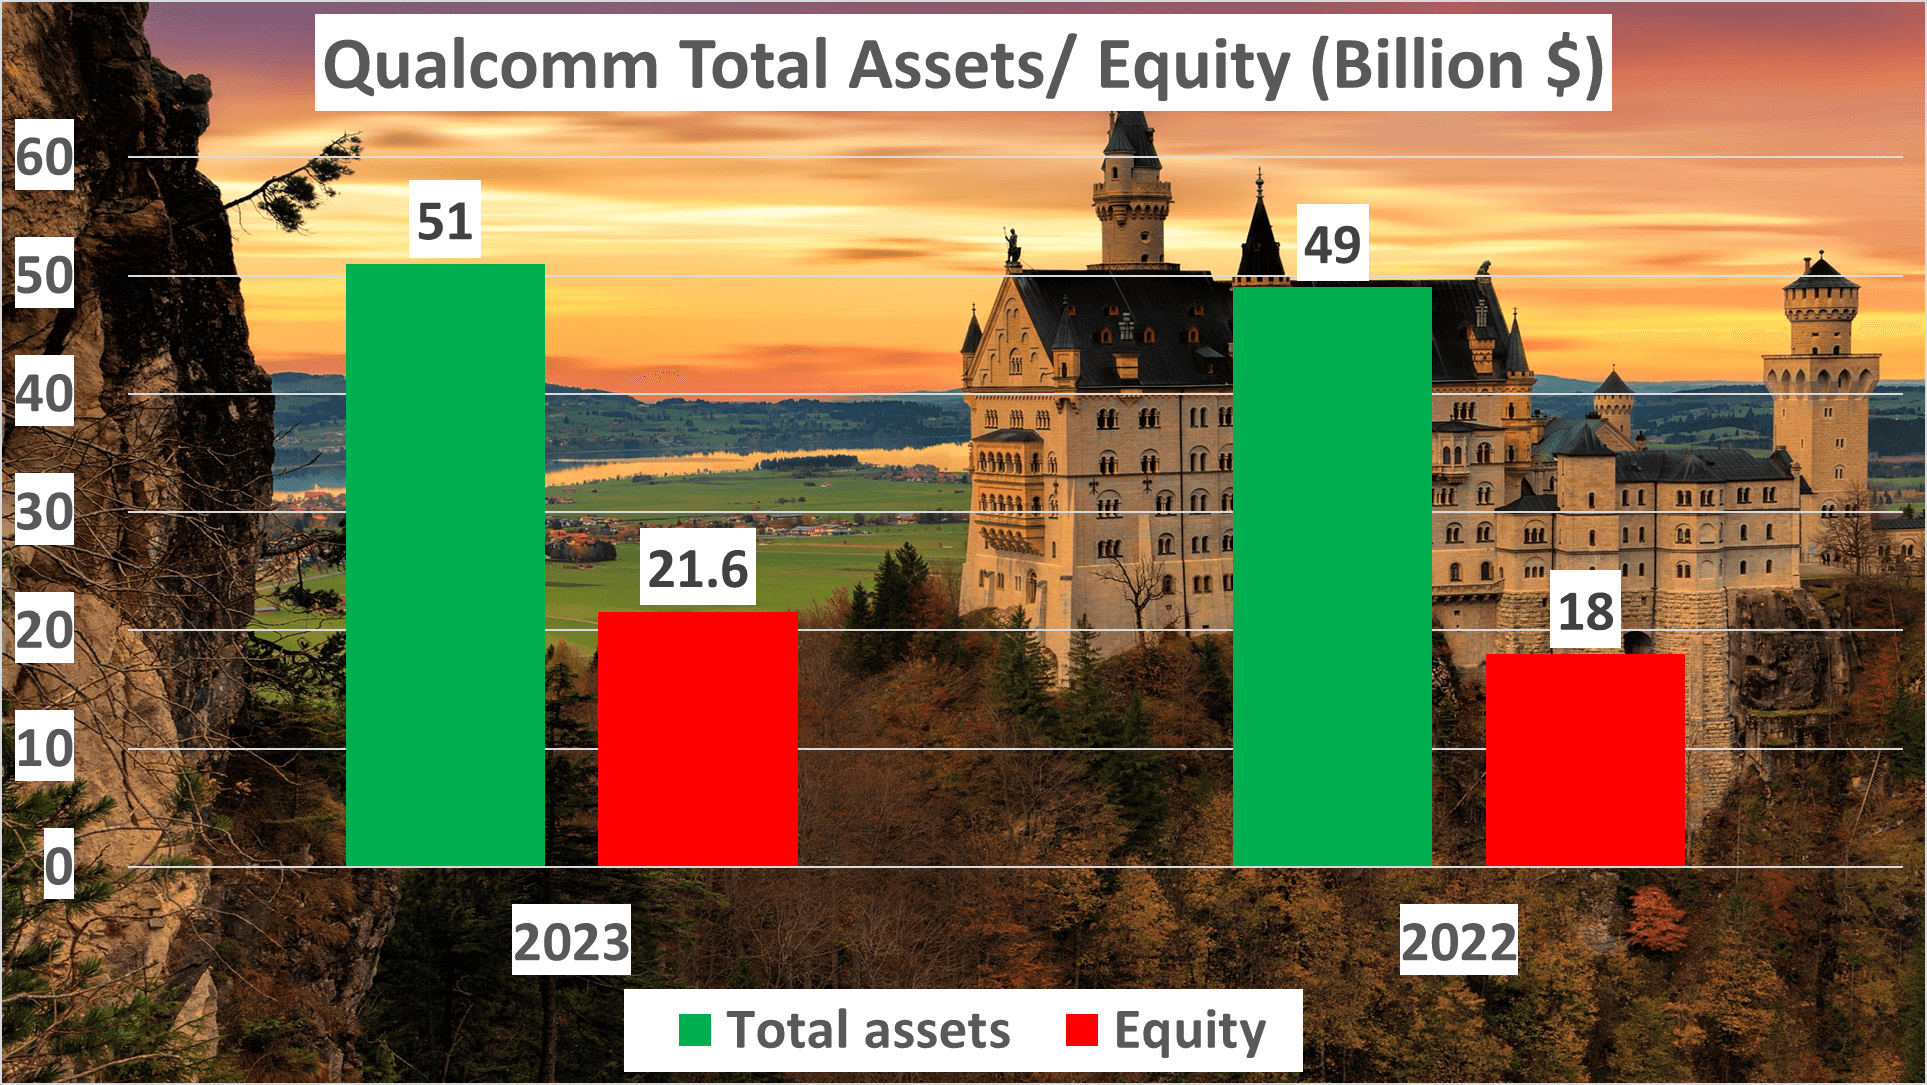
Moreover, the equity to total assets ratio in 2023 was 42%, an improvement from 37% in 2022. This signifies an enhanced capital structure for Qualcomm, suggesting reduced reliance on debt and increased dependence on equity for asset financing.
In summary, Qualcomm has showcased steady growth in both net profit and assets across the years. Despite fluctuations, the overall trend remains positive, underscoring Qualcomm’s capacity to create value for its shareholders. It will be intriguing to observe how Qualcomm addresses forthcoming challenges and opportunities, and how these factors influence its future profit and asset growth. Qualcomm’s consistent progression in net profit and assets underscores its prowess in generating shareholder value.
Liquidity and Efficiency Analysis – Qualcomm Stock Analysis
Qualcomm’s current ratio in 2023 stood at 2.34, an increase from 1.74 in 2022, indicating a robust liquidity position. This ratio serves as a crucial gauge of the company’s capability to fulfill its short-term obligations using its short-term assets. A ratio exceeding 2 generally signifies the company’s ability to settle its debts as they become due.
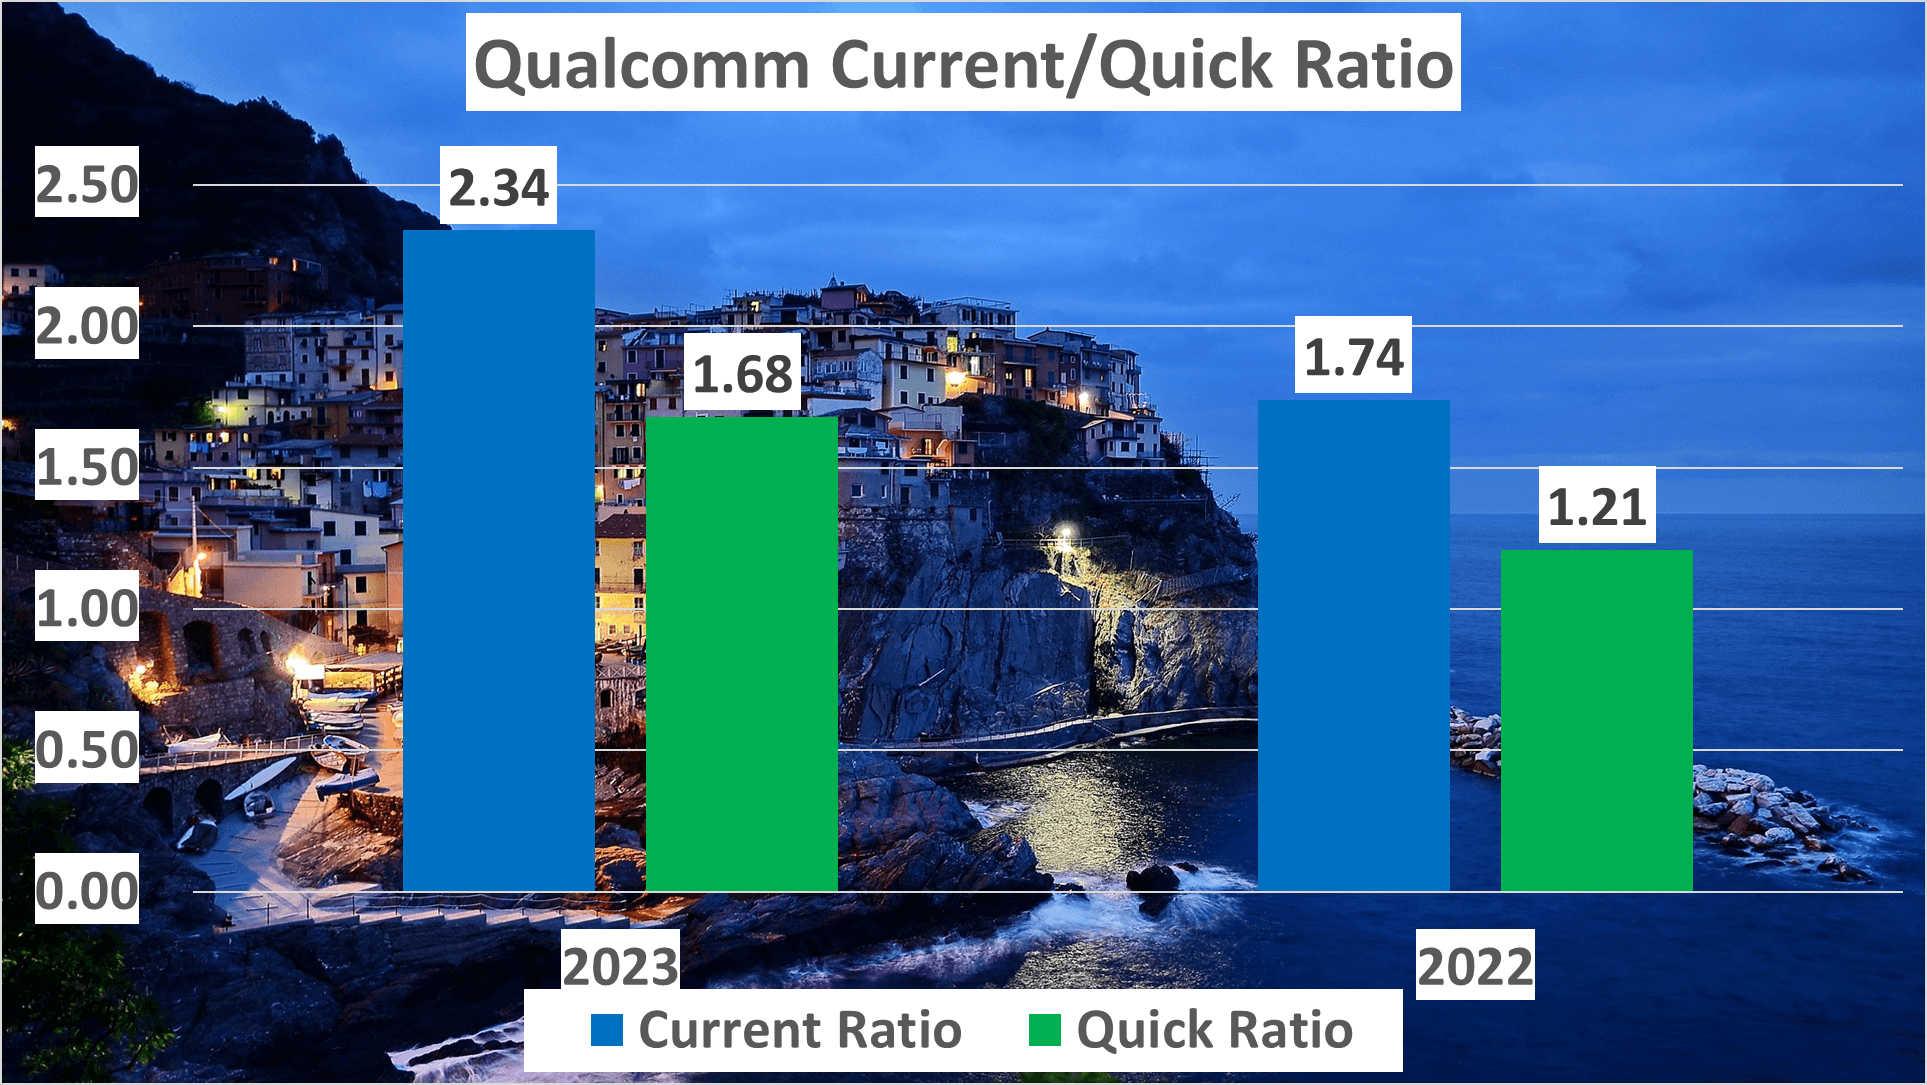
However, the current ratio doesn’t provide the complete picture. It’s essential to also assess the quick ratio, which excludes inventory from current assets. In 2023, Qualcomm’s quick ratio rose to 1.68 from 1.21 in 2022. This uptick indicates an enhancement in the company’s liquidity position, showcasing its ability to address immediate liabilities even without liquidating inventory.
Now, let’s delve into efficiency. We’ll examine inventory days, which represent the average duration inventory is held before being sold. Qualcomm’s inventory days in 2023 amounted to 146, up from 124 in 2022. This rise might raise concerns as it could suggest sluggish sales or inventory surplus.
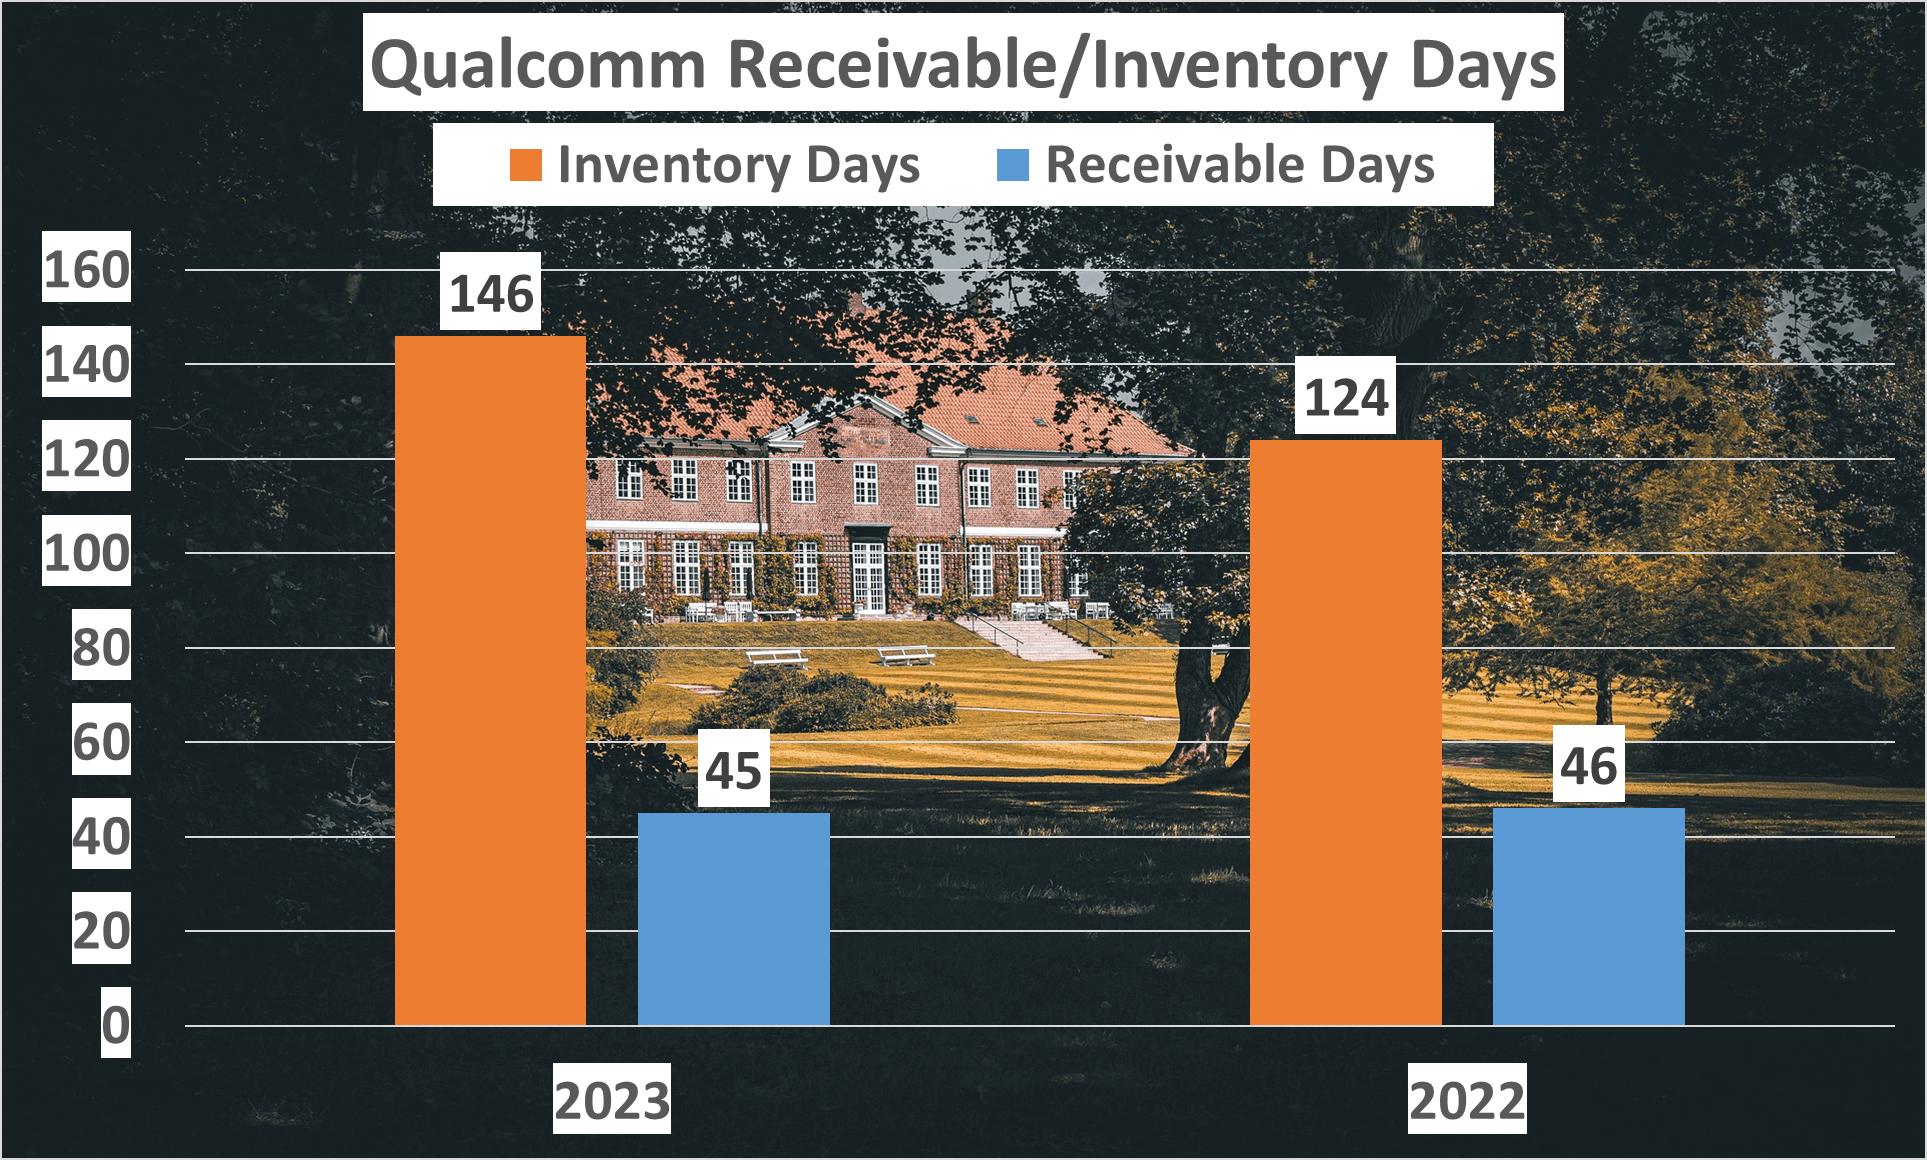
However, receivable days, reflecting the average time taken to collect payment after a sale, remained steady at 45 days in 2023, compared to 46 in 2022. This stability implies Qualcomm has sustained consistent collections from its customers.
Despite the slight uptick in inventory days, Qualcomm maintains a robust liquidity and efficiency stance.
Cash Flow and Dupont Analysis – Qualcomm Stock Analysis
In 2023, Qualcomm’s operating cash flow amounted to $11.3 billion, reflecting a compound annual growth rate of 24% from 2018. This remarkable growth rate underscores Qualcomm’s strong operational performance and its capacity to generate cash from core business operations.
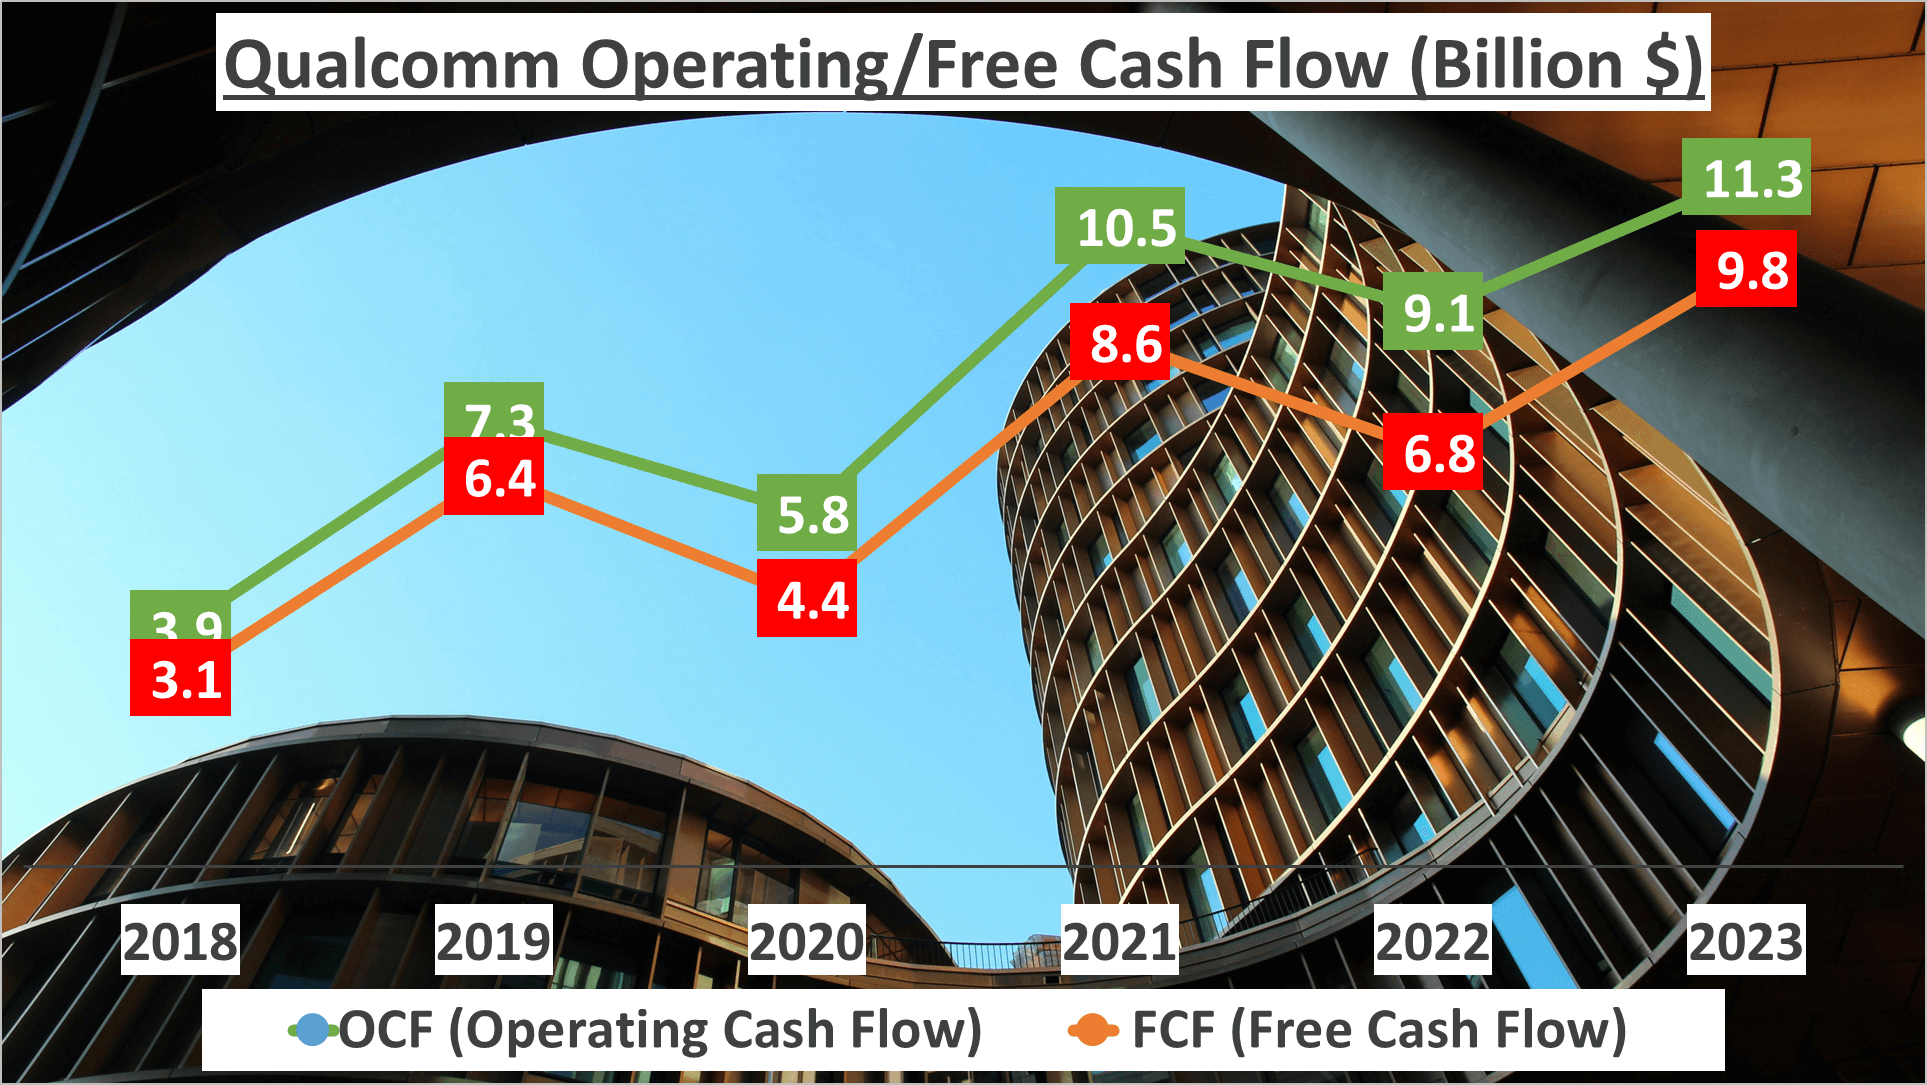
But let’s not halt our analysis there. Let’s delve into the company’s free cash flow. Free cash flow represents the cash a company generates after accounting for cash outflows to sustain operations and maintain its capital assets.
In 2023, Qualcomm’s free cash flow reached $9.8 billion. This showcases a compound annual growth rate of 26% from 2018. Despite a decline in net profit in 2023, Qualcomm managed to sustain a healthy free cash flow growth rate.
This demonstrates a robust ability to generate sufficient cash to fulfill debt obligations, distribute dividends, and explore new opportunities without relying on external financing.
Now, let’s conduct a deeper examination by performing a DuPont analysis to elucidate the return on equity (ROE). The DuPont analysis dissects ROE into three components: net profit margin, asset turnover, and financial leverage.
In 2023, Qualcomm’s ROE stood at 33%, with a net profit margin of 20%, asset turnover of 0.72, and financial leverage of 2.36. This indicates Qualcomm’s efficiency in utilizing its assets to generate earnings and its moderate level of financial leverage.
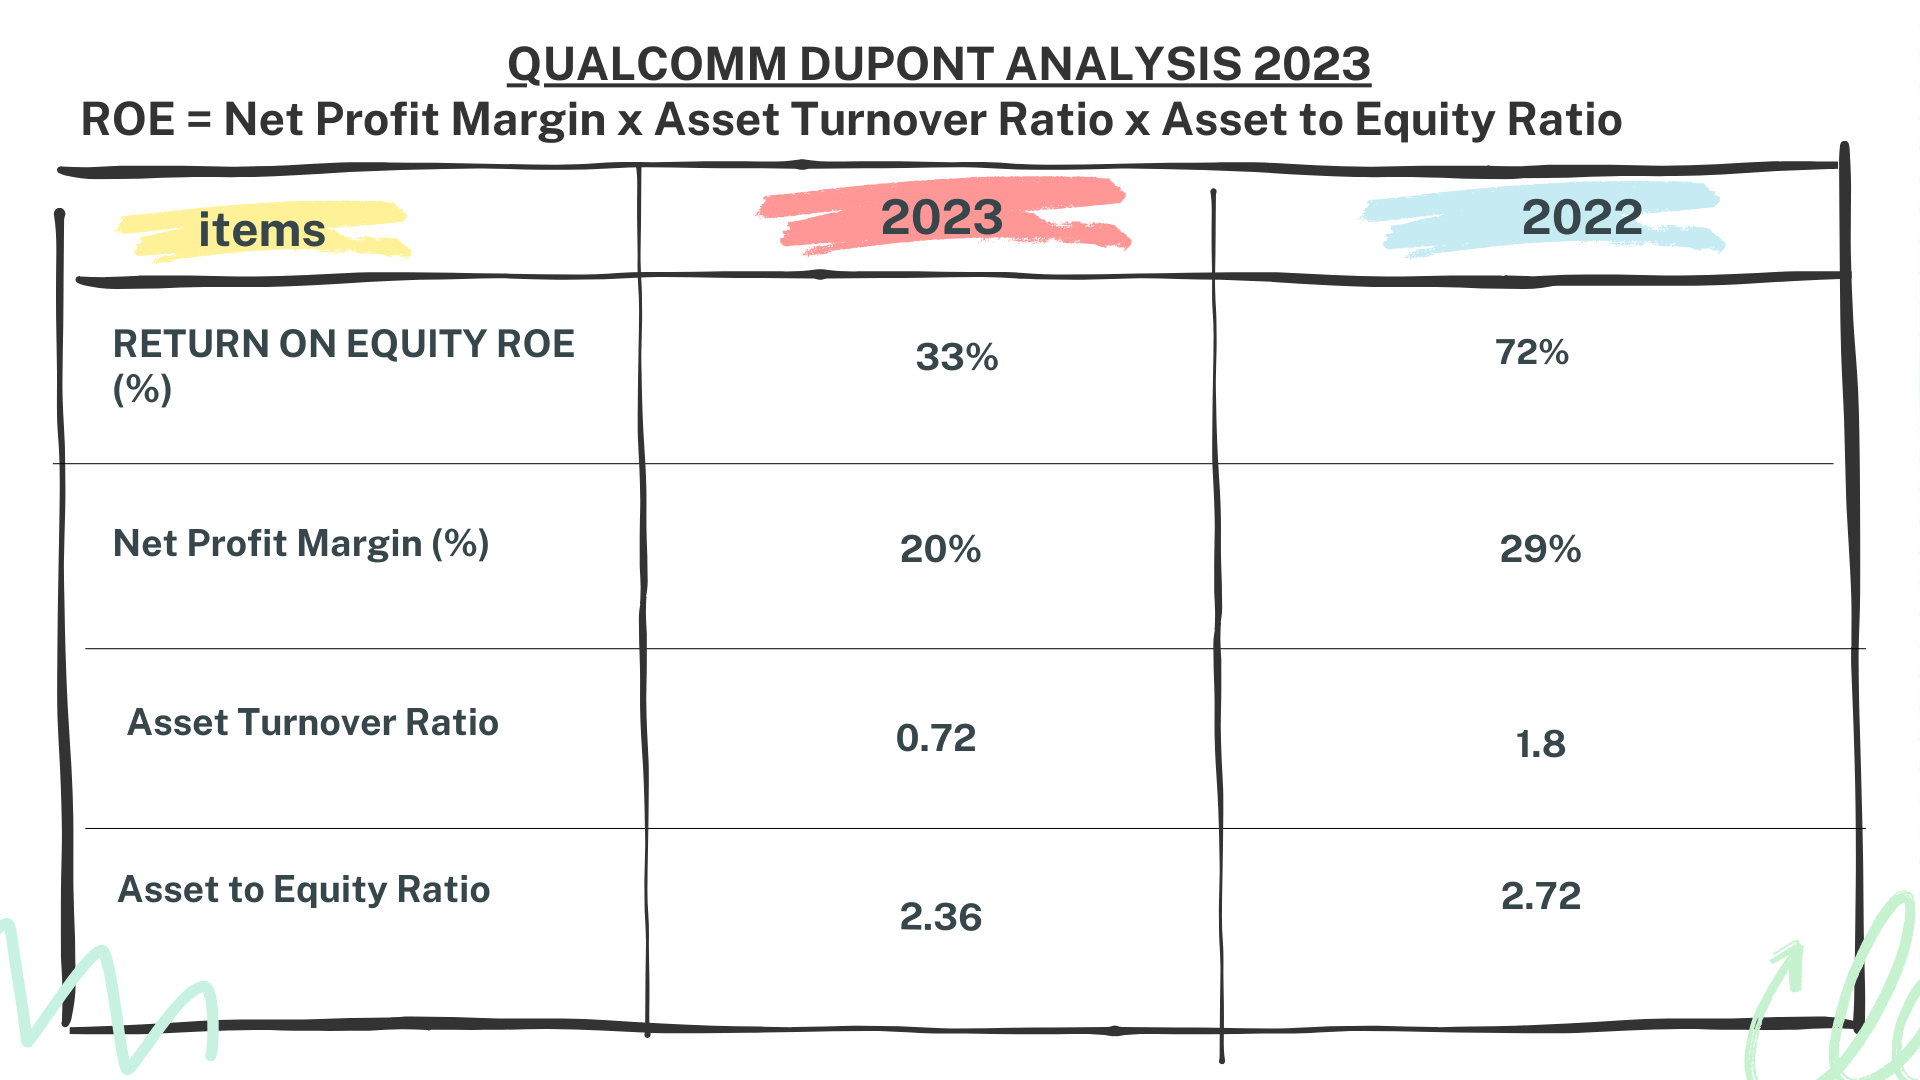
In comparison, in 2022, Qualcomm’s ROE was a remarkable 72%, with a net profit margin of 29%, asset turnover of 1.8, and financial leverage of 2.72. The year-over-year decline in ROE can be attributed to the decreased net profit margin and asset turnover.
Despite the downturn in net profit in 2023, Qualcomm exhibited positive growth in operating and free cash flows, contributing to a sturdy ROE.
Summary and Conclusion – Qualcomm Stock Analysis
In summary, Qualcomm has exhibited remarkable growth in both revenue and profit, along with effective cost management and solid liquidity.
The company’s revenue has experienced a compound annual growth rate of 10% since 2018, driven by significant revenue streams such as handsets and IoT. Despite competitive pressures, Qualcomm has maintained a steady gross profit margin, showcasing its adeptness in cost control.
While the net profit dipped from its peak in 2022, Qualcomm has consistently grown its net profit over time, indicating its ability to generate sustainable profits.
Furthermore, Qualcomm boasts a robust liquidity position, as evidenced by its current and quick ratios. The upward trend in operating and free cash flows further reinforces the company’s financial strength.
A DuPont analysis highlights that Qualcomm’s return on equity is influenced by its net profit margin, asset turnover, and asset to equity ratio.
For more insightful analyses, remember to subscribe, and feel free to suggest which companies you’d like us to analyze next. Stay tuned for more updates!
Author: investforcus.com
Follow us on Youtube: The Investors Community

