Shopify Stock Analysis – Have you ever pondered the outcome of investing $1000 in Shopify in 2018? Today, we’ll delve into the financial trajectory of this e-commerce behemoth. We’ll scrutinize Shopify’s financial performance across the years, divulging the value of that hypothetical investment by the conclusion of this discourse.
Comprehending the value of an investment goes beyond merely scrutinizing stock prices. It necessitates an in-depth examination of the company’s fiscal robustness and operational efficiency. Shopify’s narrative of expansion and evolution transcends mere numerical data; it’s a tale of strategic acumen, market dynamics, and macroeconomic factors.
By 2018, Shopify had solidified its position as a premier platform, empowering enterprises of all scales to establish, operate, and expand their online footprint. It emerged as the preferred choice for myriad budding entrepreneurs, showcasing unmistakable potential. But how did it fare financially?
We’ll dissect pivotal financial indicators such as revenue escalation, profit margins, and net profit. We’ll scrutinize Shopify’s fiscal well-being, scrutinizing its assets, liabilities, and cash inflows. Additionally, we’ll undertake a Dupont analysis, deconstructing Return on Equity into three constituents: Net Profit Margin, Asset Turnover, and Equity Multiplier. This methodological approach will furnish us with a more nuanced comprehension of Shopify’s fiscal performance.
Remember, this is more than a retrospective analysis; it’s about grasping the determinants underpinning a company’s financial trajectory to make well-informed investment choices. It’s about discerning the broader narrative, transcending the vicissitudes of stock prices.
Investing in stocks isn’t merely about capitalizing on market fluctuations; it’s about endorsing a company’s vision, comprehending its strategic direction, and envisaging its future trajectory. And that’s precisely what we aim to unravel today with Shopify.
So, if you had $1000 to spare in 2018 and opted to invest it in Shopify, what would it amount to today? Well, let’s unravel this mystery together. Join us as we embark on this fiscal expedition to ascertain the value of a $1000 investment in Shopify.
Shopify’s Revenue Growth – Shopify Stock Analysis
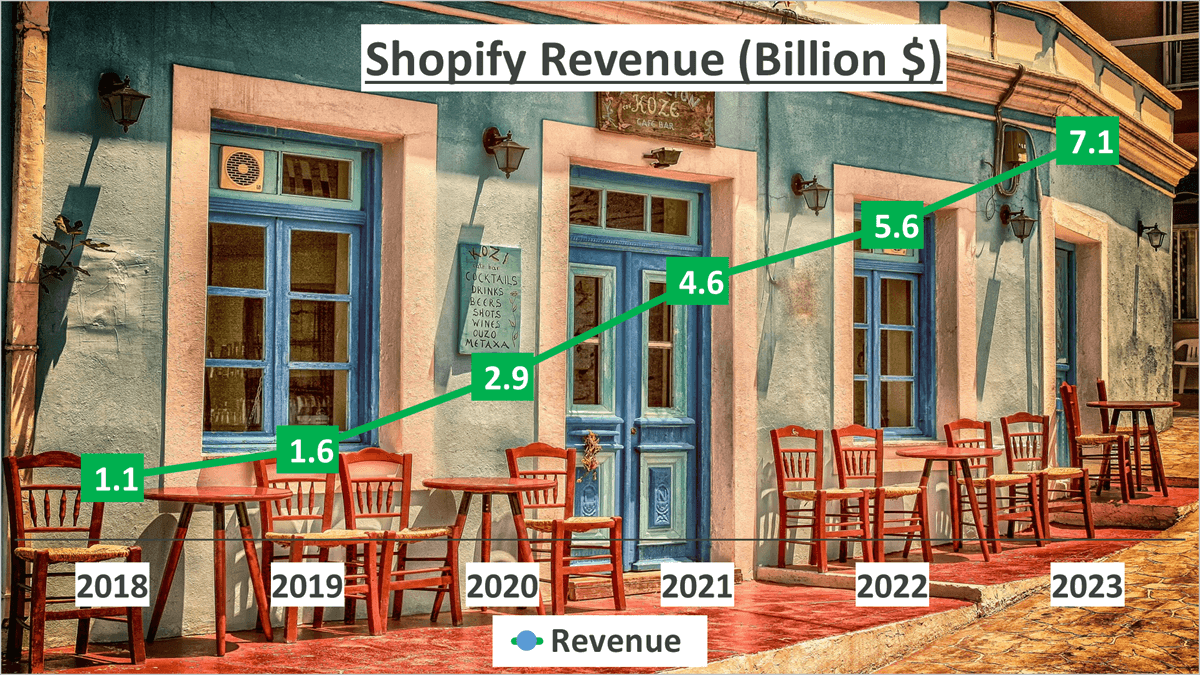
Shopify’s revenue has experienced remarkable growth since 2018. In a span of five years, Shopify has surged from a revenue of $1.1 billion in 2018 to an impressive $7.1 billion by 2023. This translates to a staggering compound annual growth rate (CAGR) of 45%.
Delving deeper into the annual growth percentages reveals an intriguing narrative. Between 2018 and 2019, revenue growth stood at 45%. It then soared to 81% from 2019 to 2020, maintaining a robust 59% from 2020 to 2021. Although the growth rate slowed slightly to 22% from 2021 to 2022, it rebounded to 27% from 2022 to 2023.
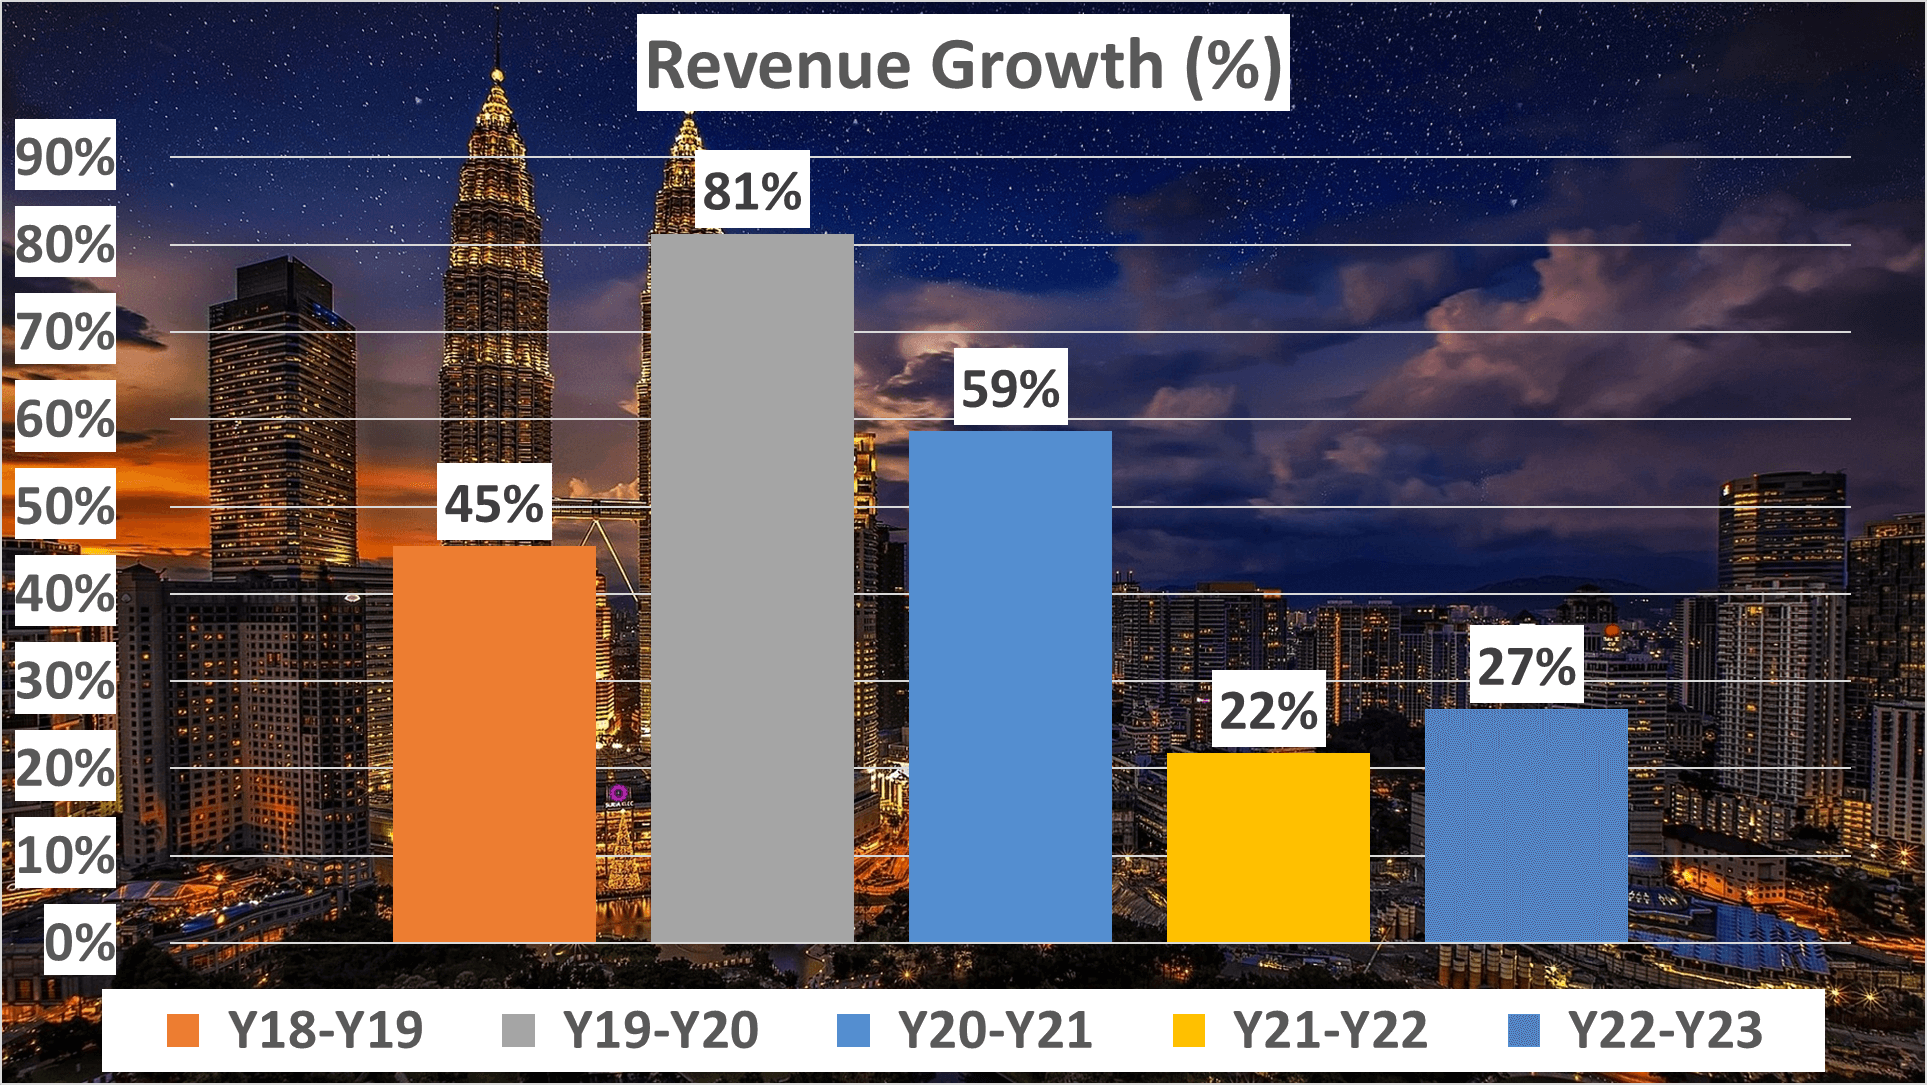
These figures underscore a trend of consistent and robust revenue growth, underscoring the resilience of Shopify’s business model and strategic approach.
Moreover, Shopify’s Gross Merchandise Volume (GMV) surged from $41 billion in 2018 to a remarkable $236 billion in 2023, boasting an annual CAGR of 42%. The Gross Payment Volume (GPV) also witnessed significant growth, escalating from $17 billion in 2018 to $137 billion in 2023, reflecting a CAGR of 53%.
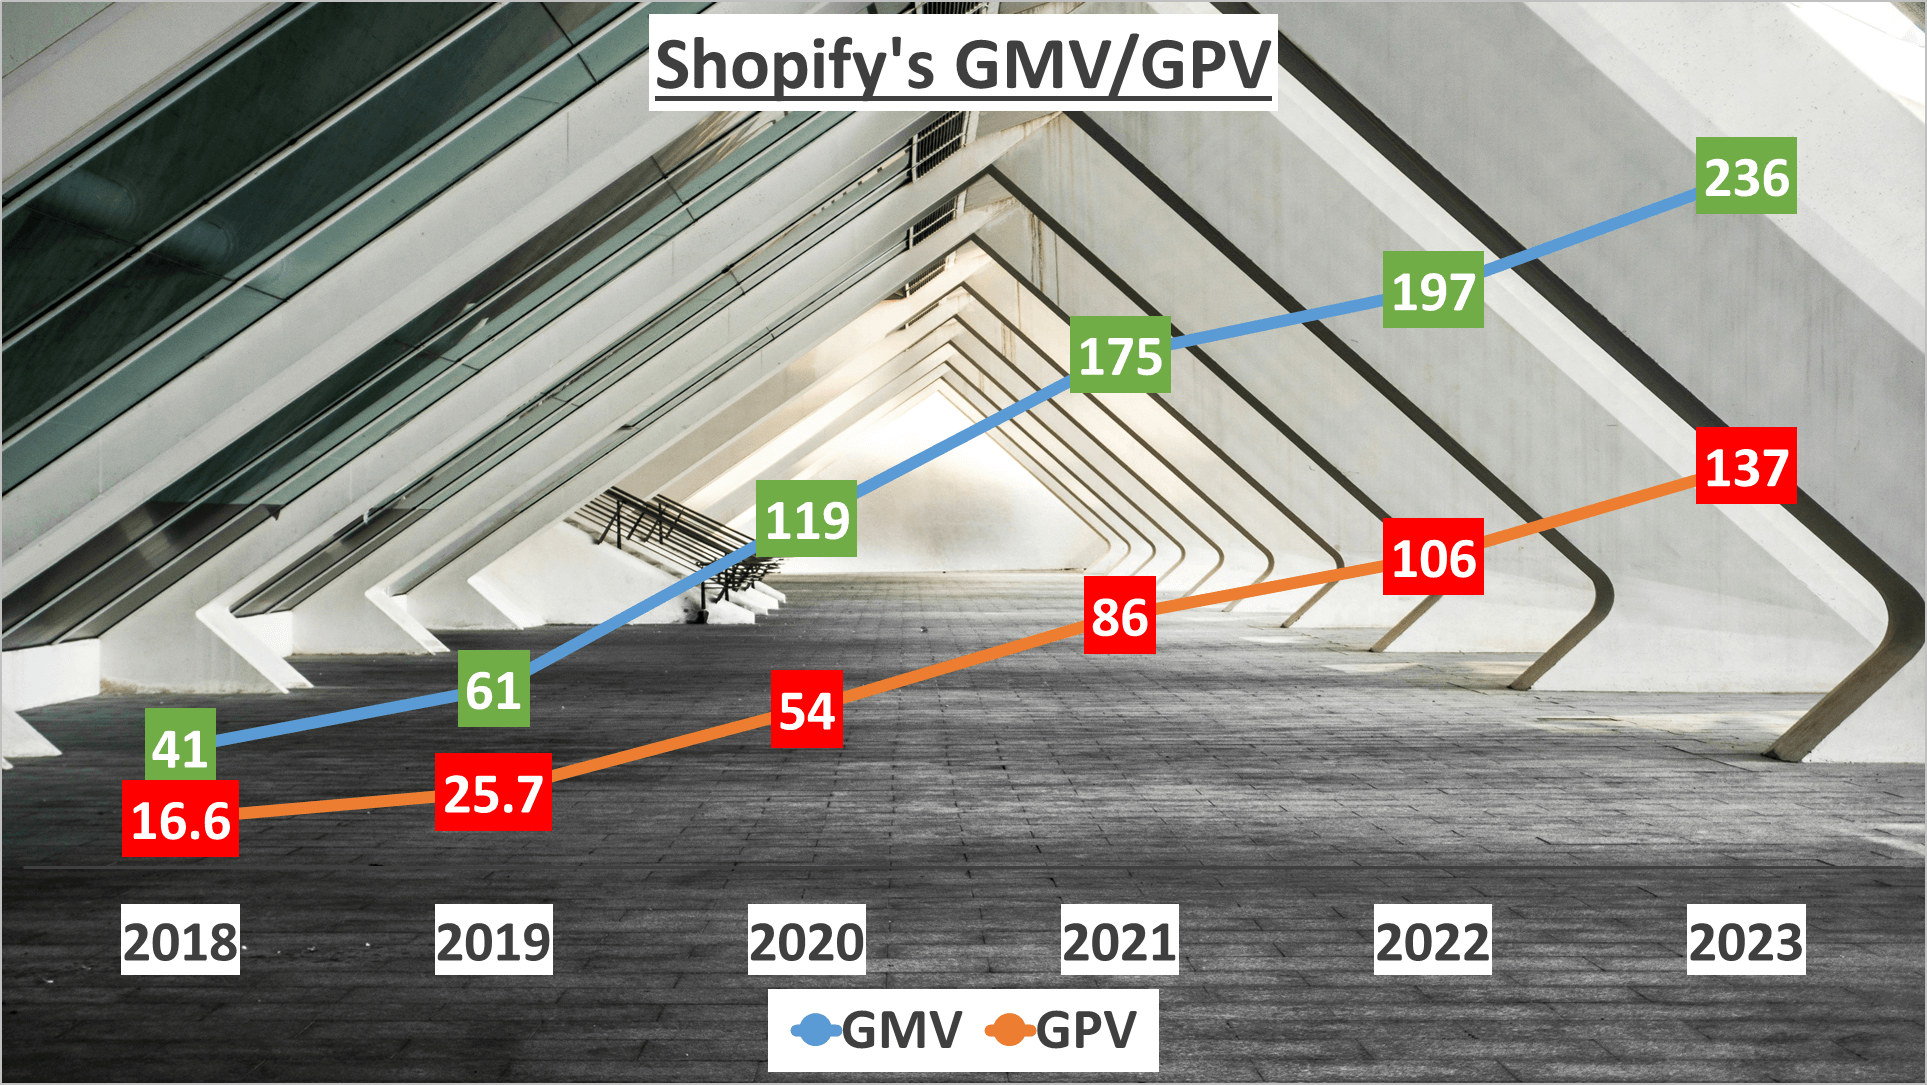
In 2023, the Revenue to GMV ratio stood at 3%, slightly surpassing the six-year average of 2.7%.
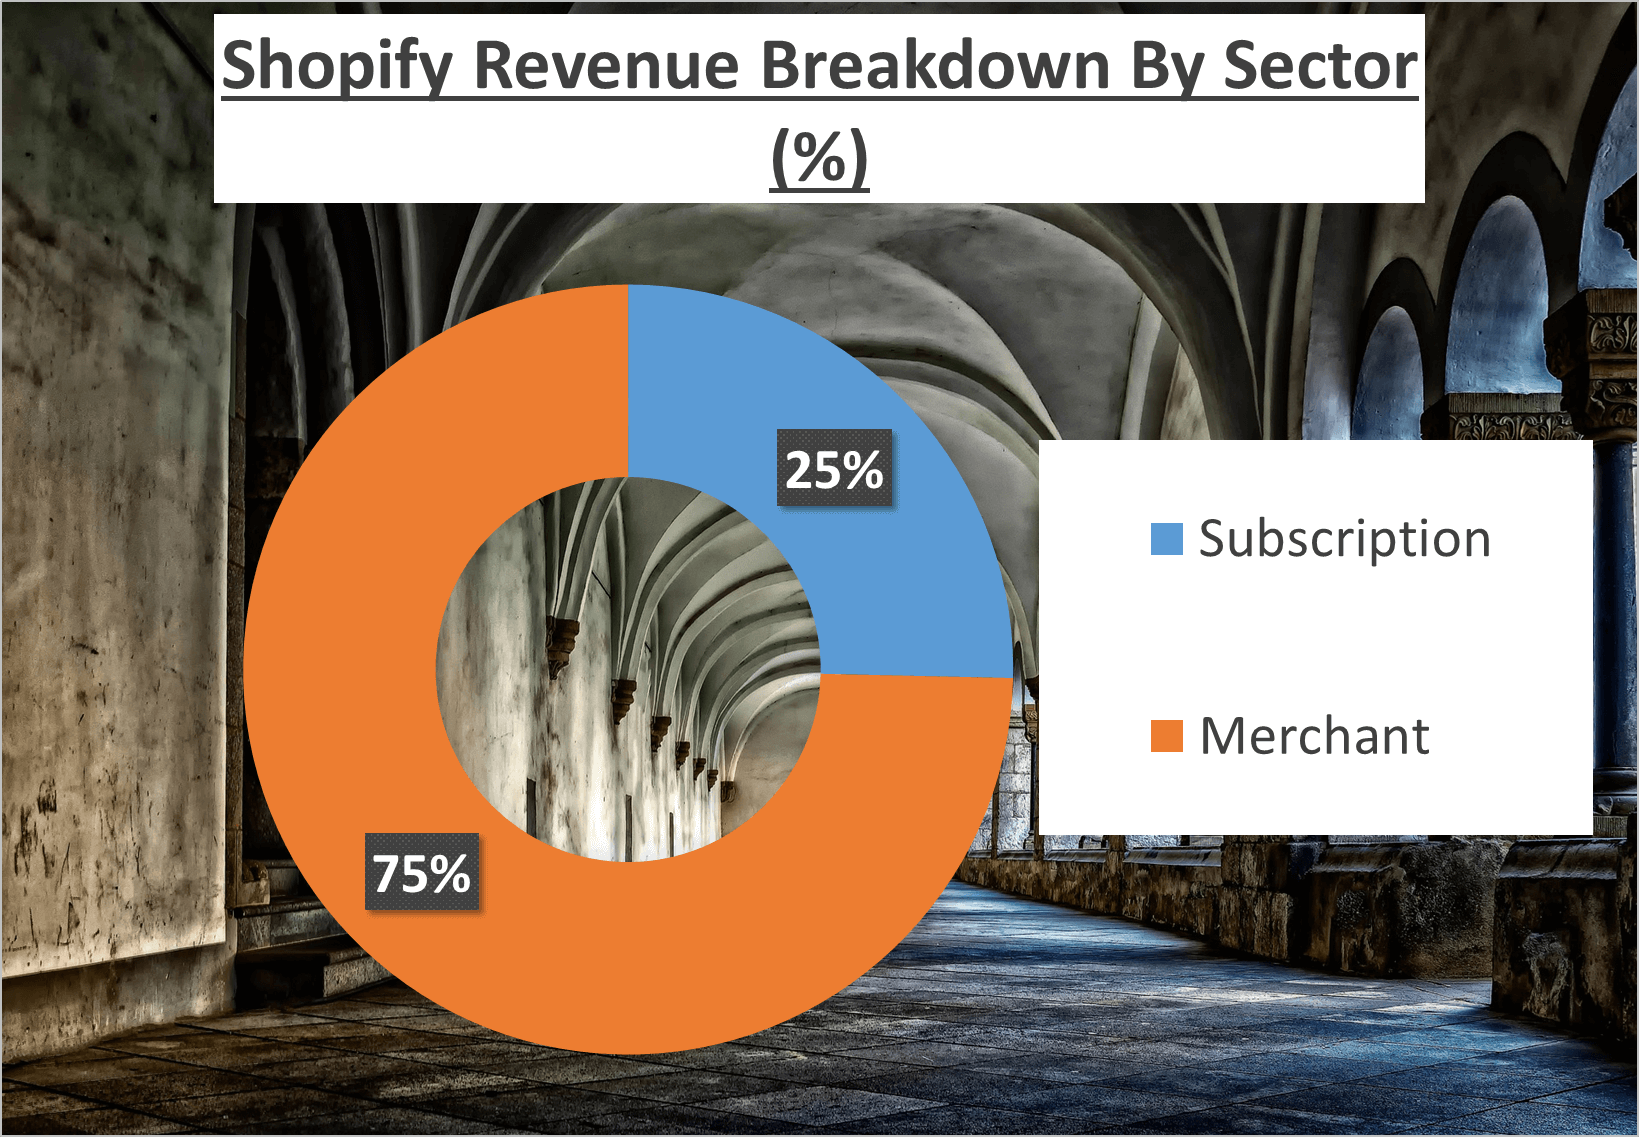
An intriguing aspect of Shopify’s revenue structure lies in its division between Subscription and Merchant sources. While 75% of the revenue originates from Merchants, Subscriptions contribute the remaining 25%.
Indeed, the growth trajectory is impressive, but there’s more to the story.
Profit Margin and Net Profit – Shopify Stock Analysis
As savvy investors, we understand that while revenue growth is crucial, profitability is equally vital. Let’s delve into Shopify’s profit margins.
Shopify’s gross profit margin in 2023 stood at 51%, slightly below the five-year average of 53%. The gross profit margin, which represents the percentage of revenue exceeding the cost of goods sold, showcases the company’s efficiency in managing production costs and supplies. A slight decrease in this margin may stem from factors like increased production costs or strategic pricing adjustments.
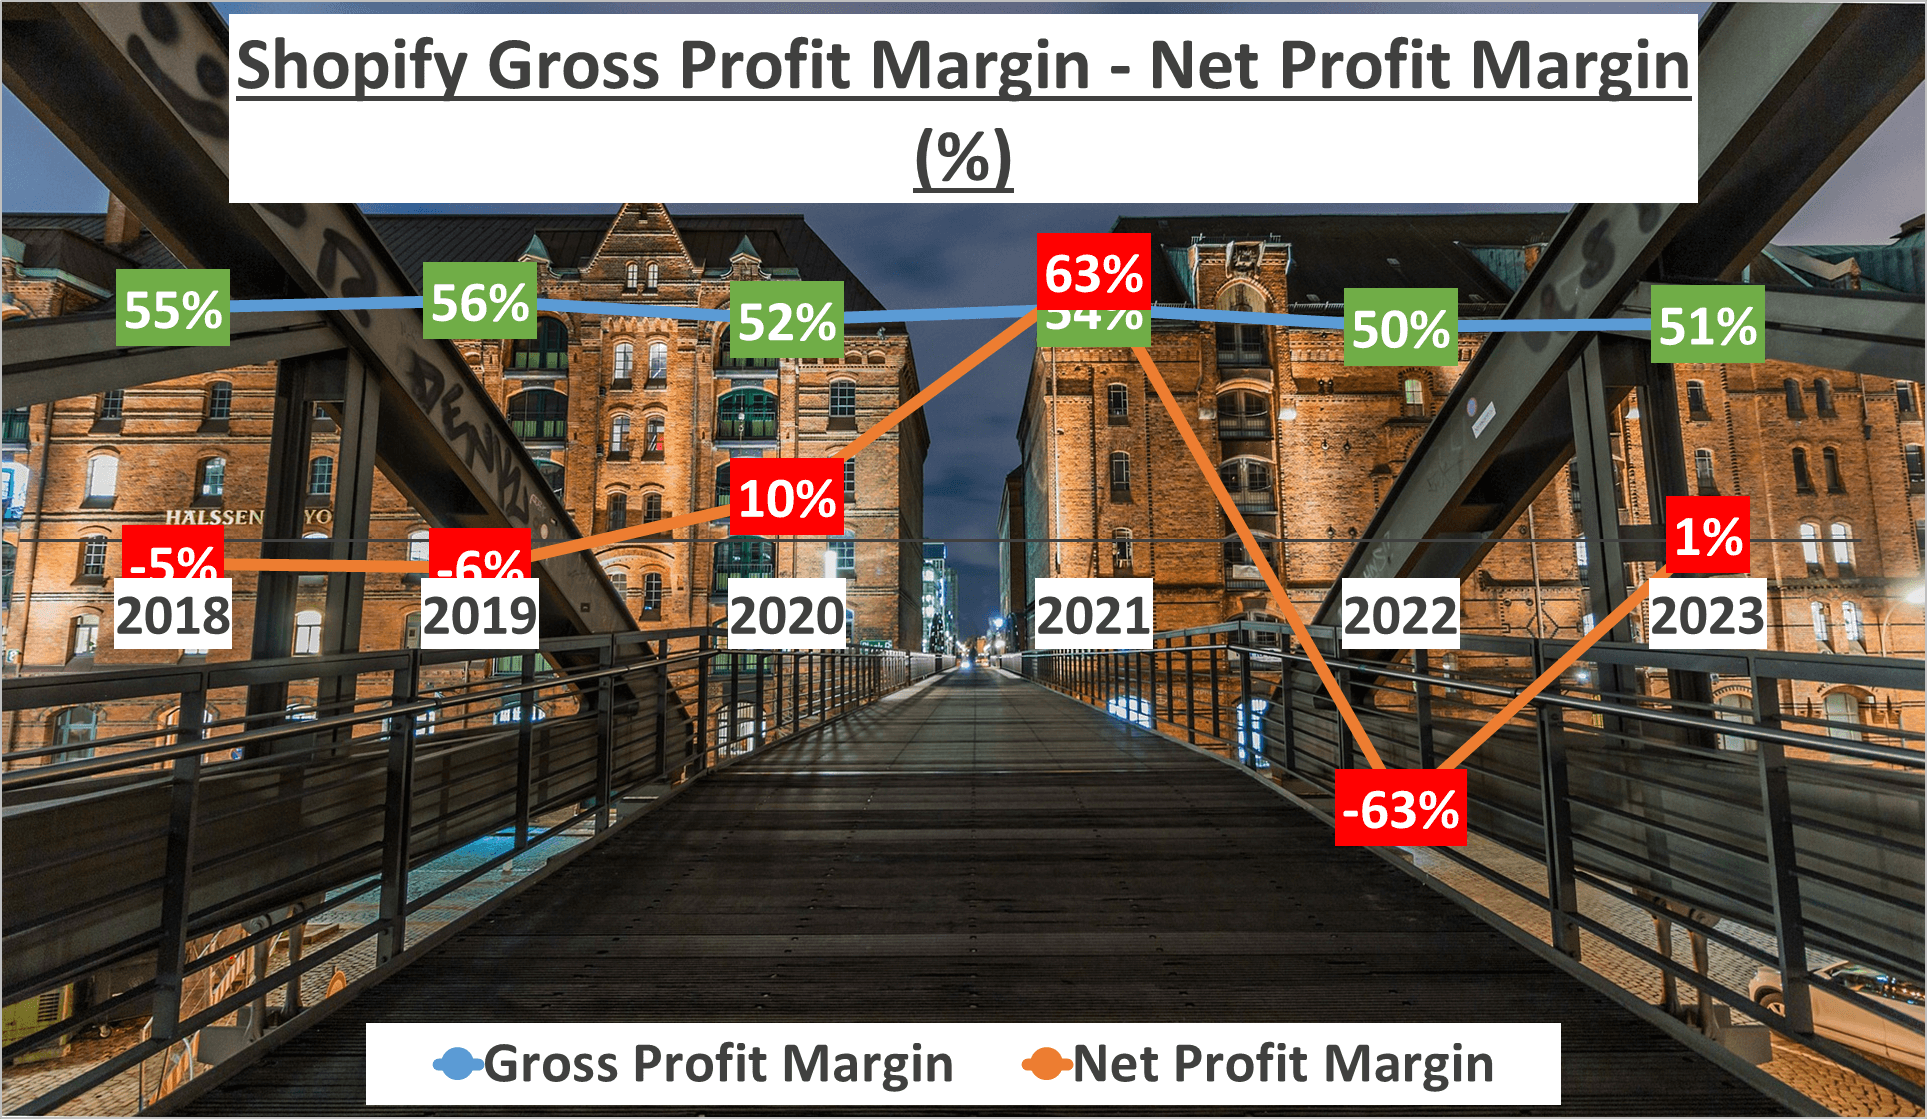
Moving on to the net profit margin, this metric unveils intriguing insights. In 2023, Shopify’s net profit margin surged to 1%, a significant leap from the -63% in 2022. However, it remains notably lower than the 63% witnessed in 2021.
What caused these dramatic fluctuations? The answer lies in Shopify’s other income or loss, tied to their investment activities. In 2021, a substantial other income bolstered the net profit margin, while a significant other loss in 2022 plunged it into negative territory.
In 2023, we witness a modest improvement. The 1% net profit margin implies that for every $100 of revenue generated, Shopify yielded a profit of $1 after accounting for all expenses, taxes, and interest.
Let’s not overlook the net profit figure. In 2023, Shopify’s net profit reached $100 million. While this may seem lower than the $2.9 billion in 2021, it marks a substantial recovery from the -$3.5 billion in 2022.
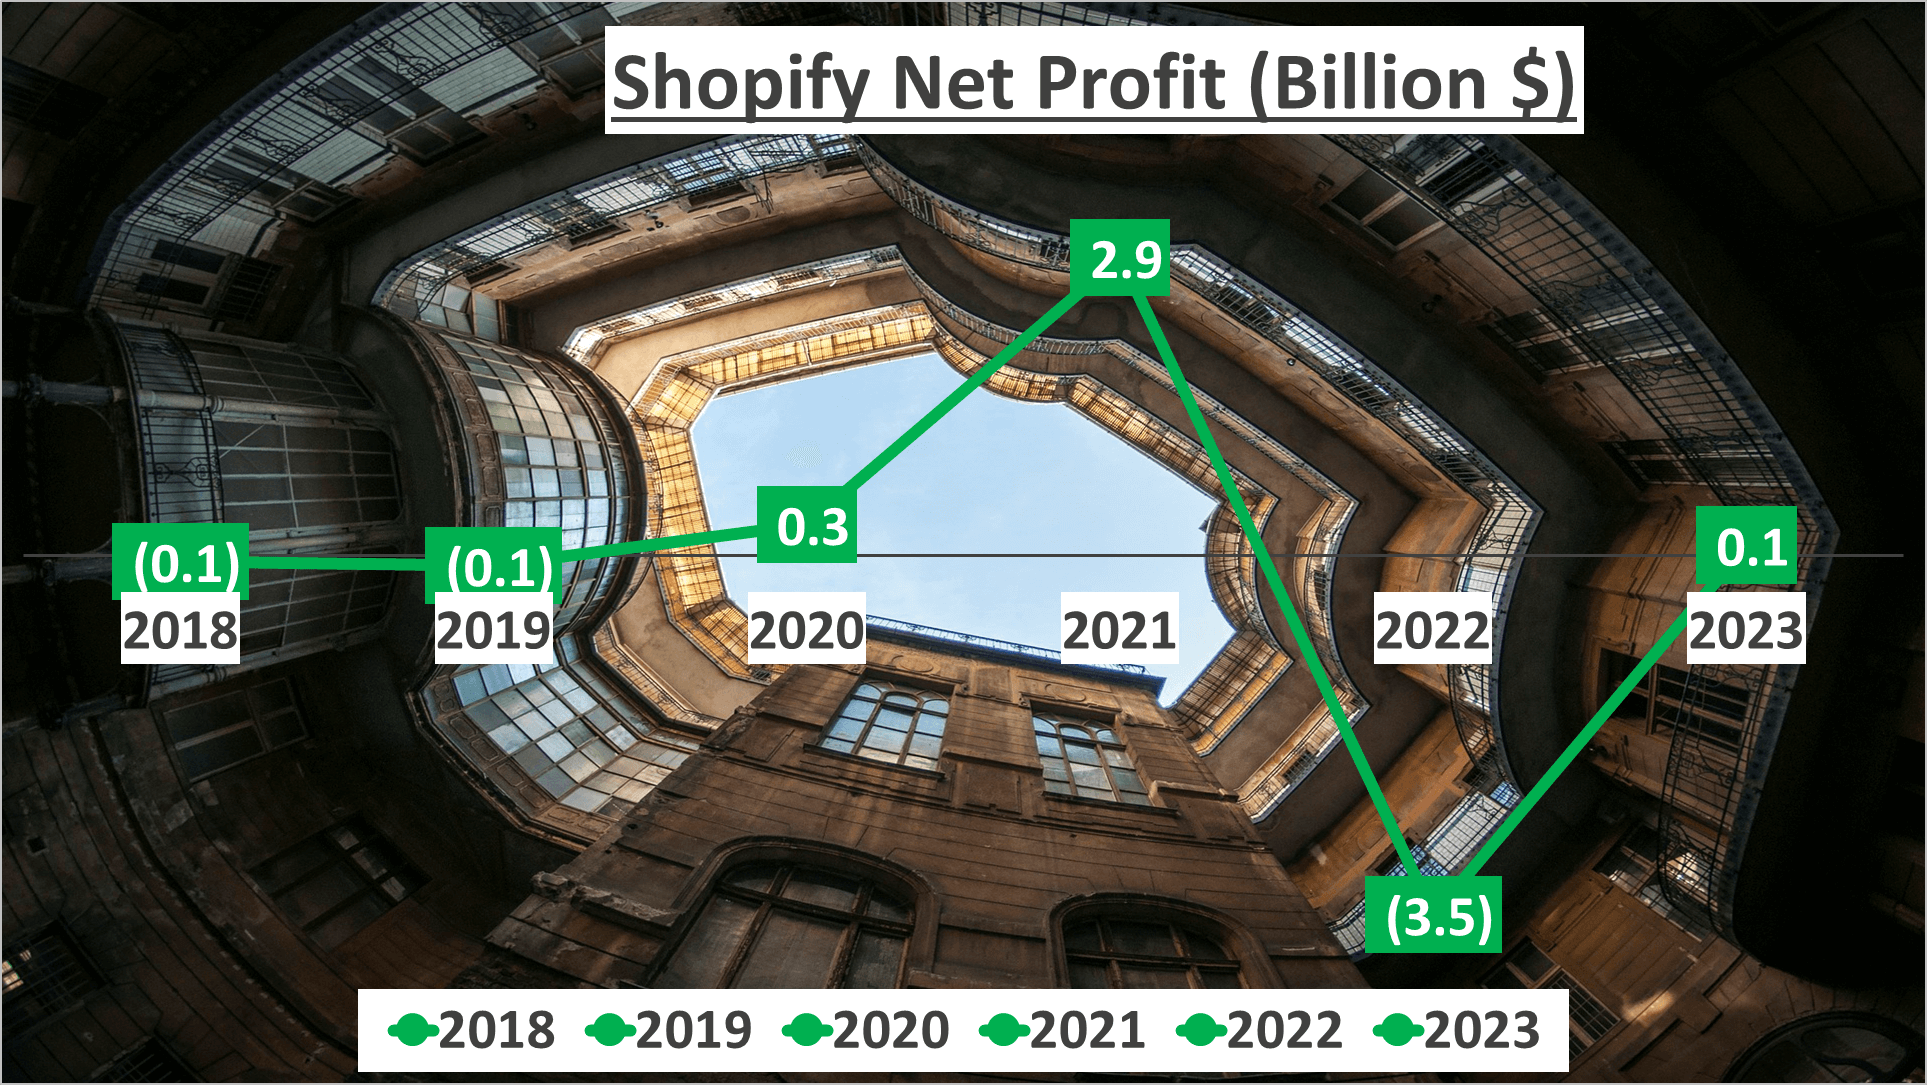
Despite these fluctuations, Shopify’s profitability demonstrates resilience. In the realm of business, it’s not only about revenue generation but also prudent management of expenses. Shopify has adeptly navigated through challenges, maintaining profitability even in turbulent times.
Financial Health and Cash Flow – Shopify Stock Analysis
Let’s delve into Shopify’s financial health and cash flow. In 2023, Shopify’s total assets surged to a substantial $11.3 billion, marking a healthy increase from $10.8 billion the previous year. Similarly, net assets exhibited a positive trend, reaching $9.1 billion in 2023, up from $8.2 billion in 2022.
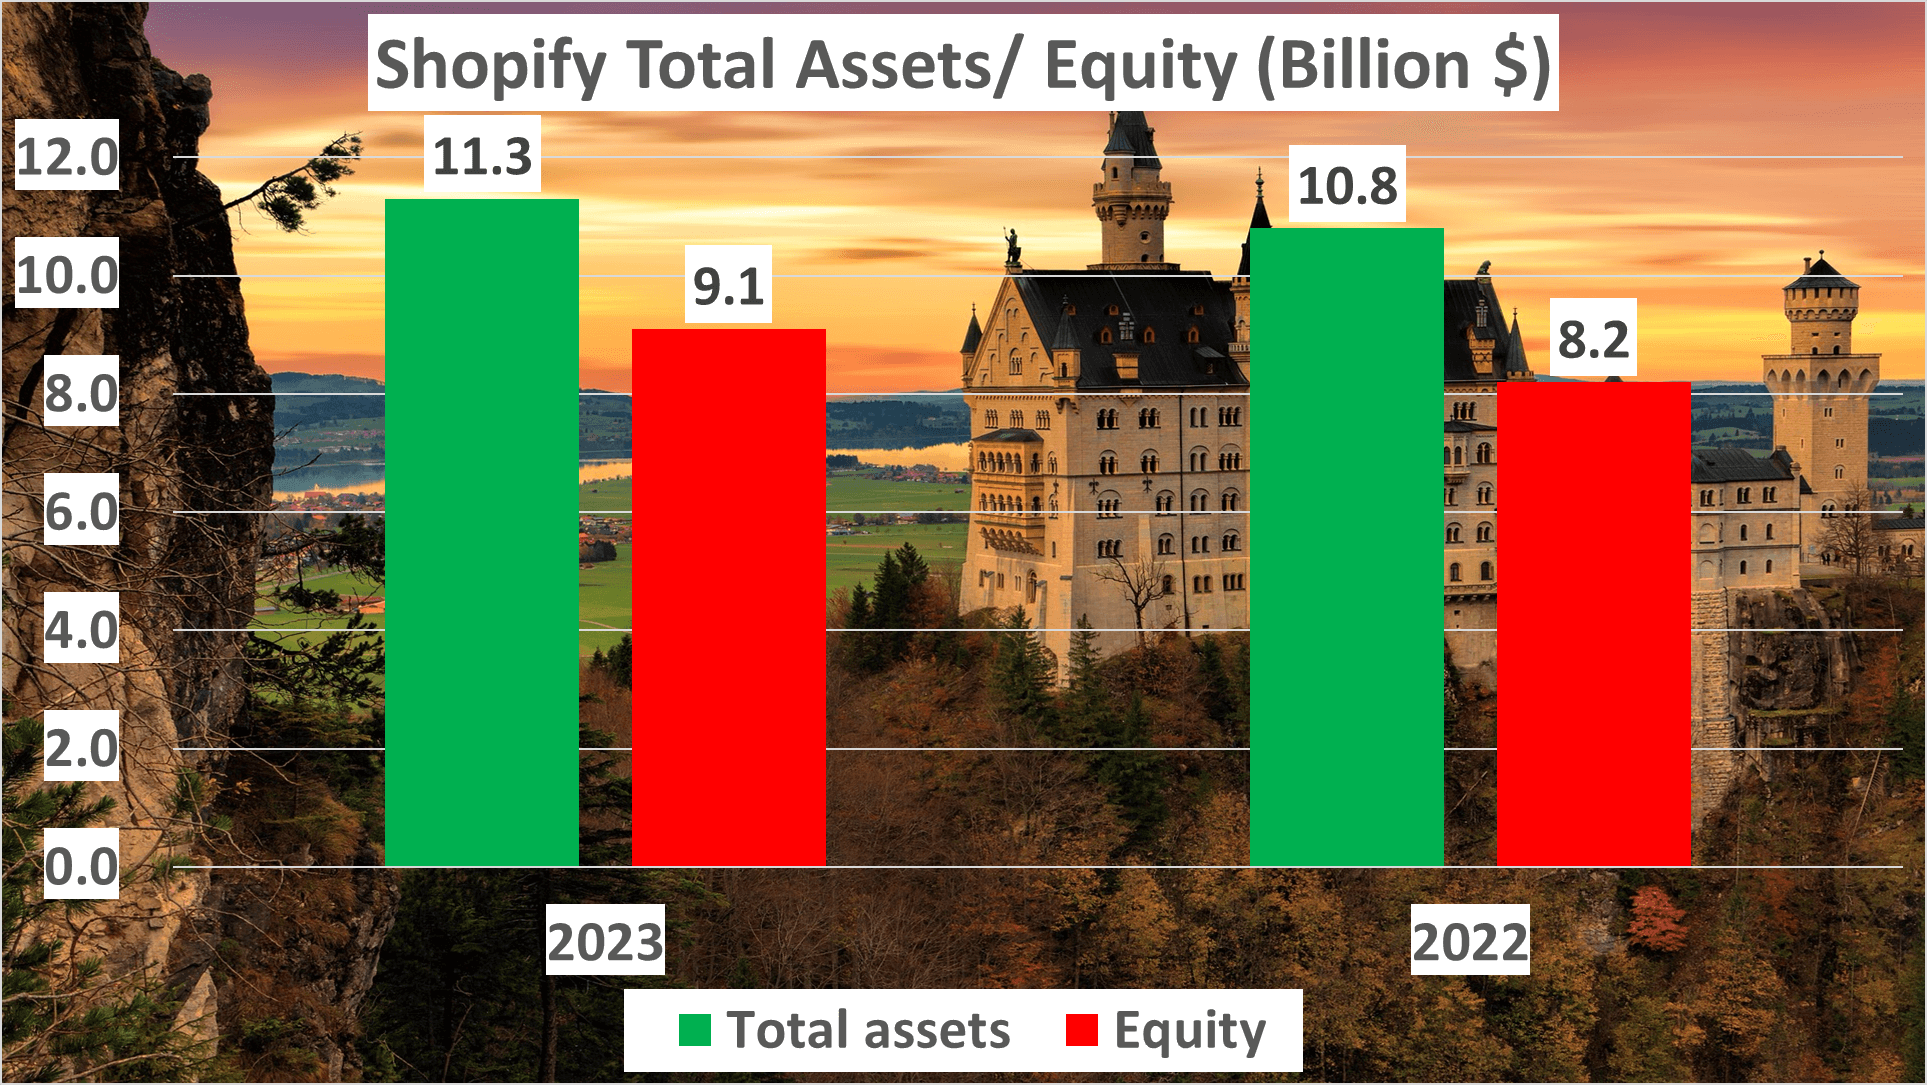
The company’s robust financial health is underscored by the equity to total assets ratio, which stood at 81% in 2023, a significant rise from 76% in the prior year. This signifies a strong balance sheet, with Shopify owning a considerable portion of its assets outright.
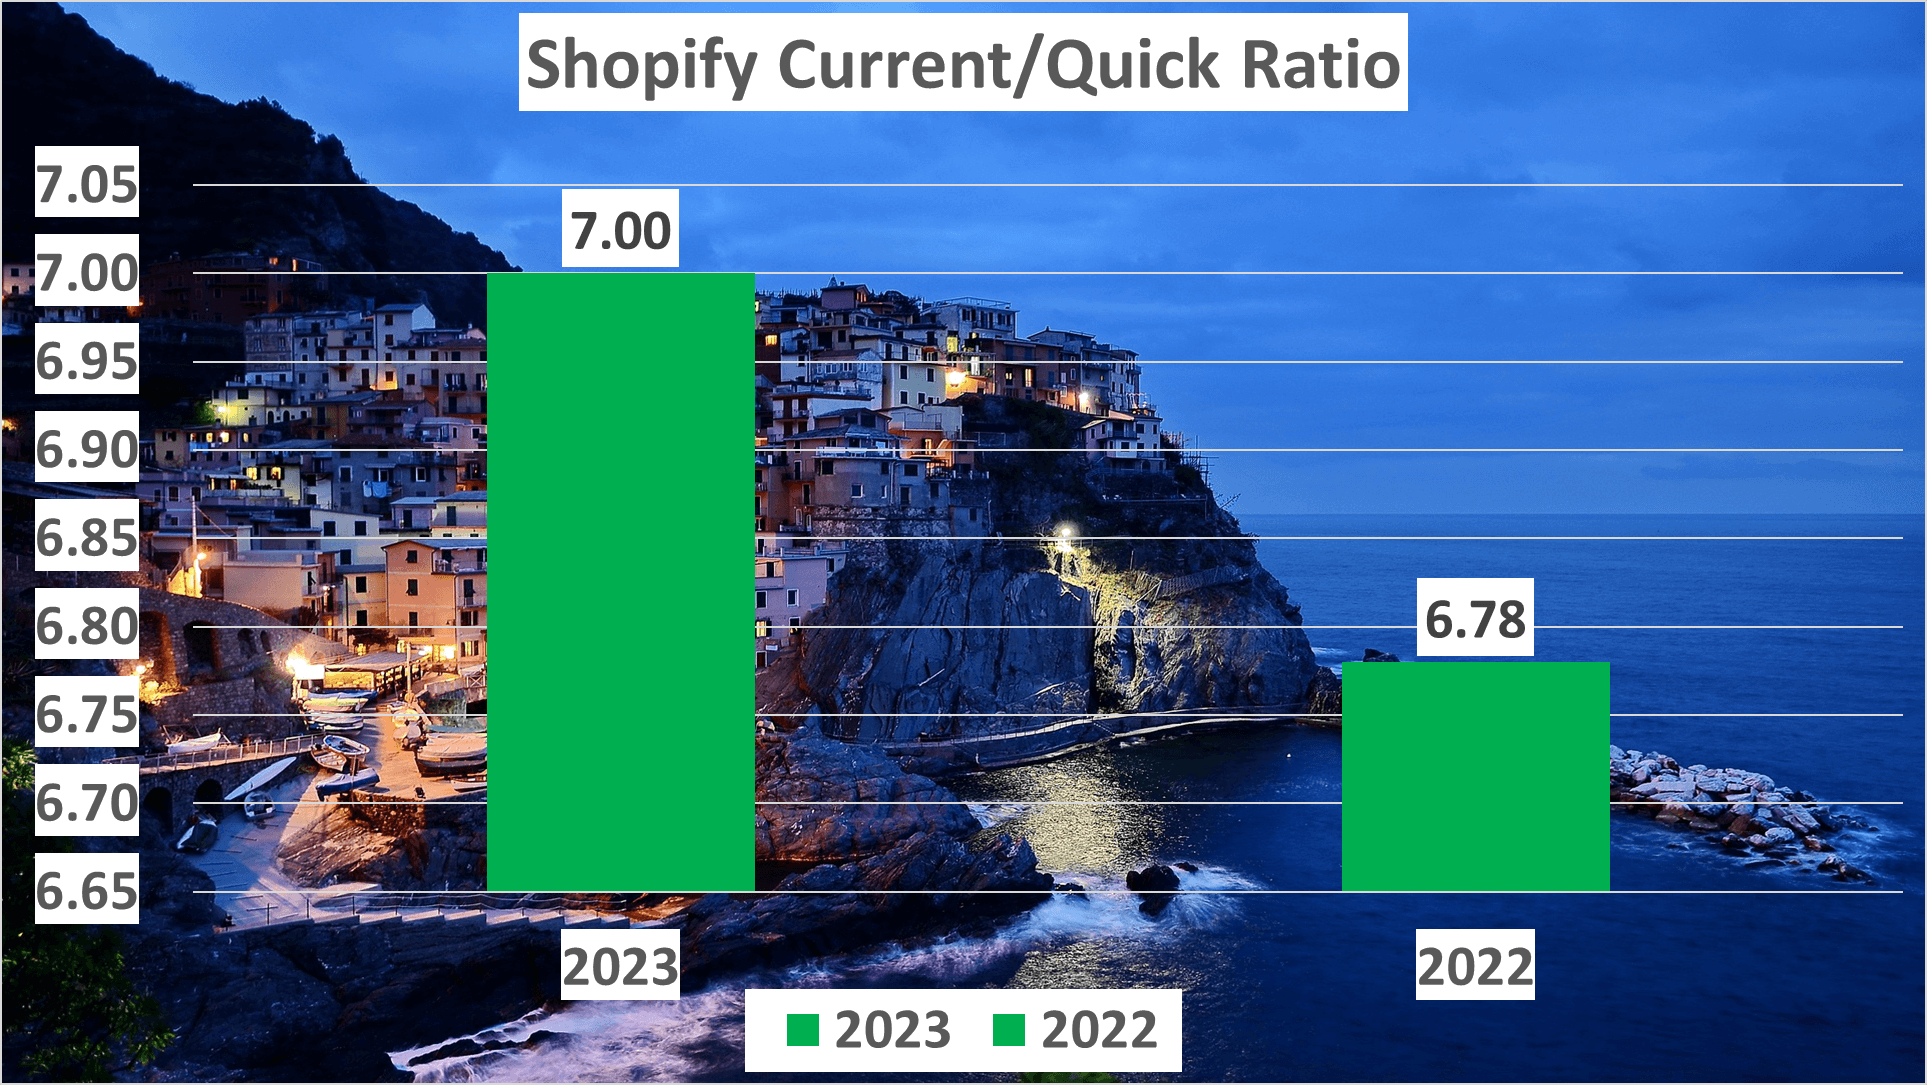
Turning our focus to liquidity, Shopify’s current ratio – a critical gauge of short-term financial stability – climbed to 7 in 2023, up from 6.78 in 2022. This indicates Shopify possesses ample resources to cover its short-term obligations.
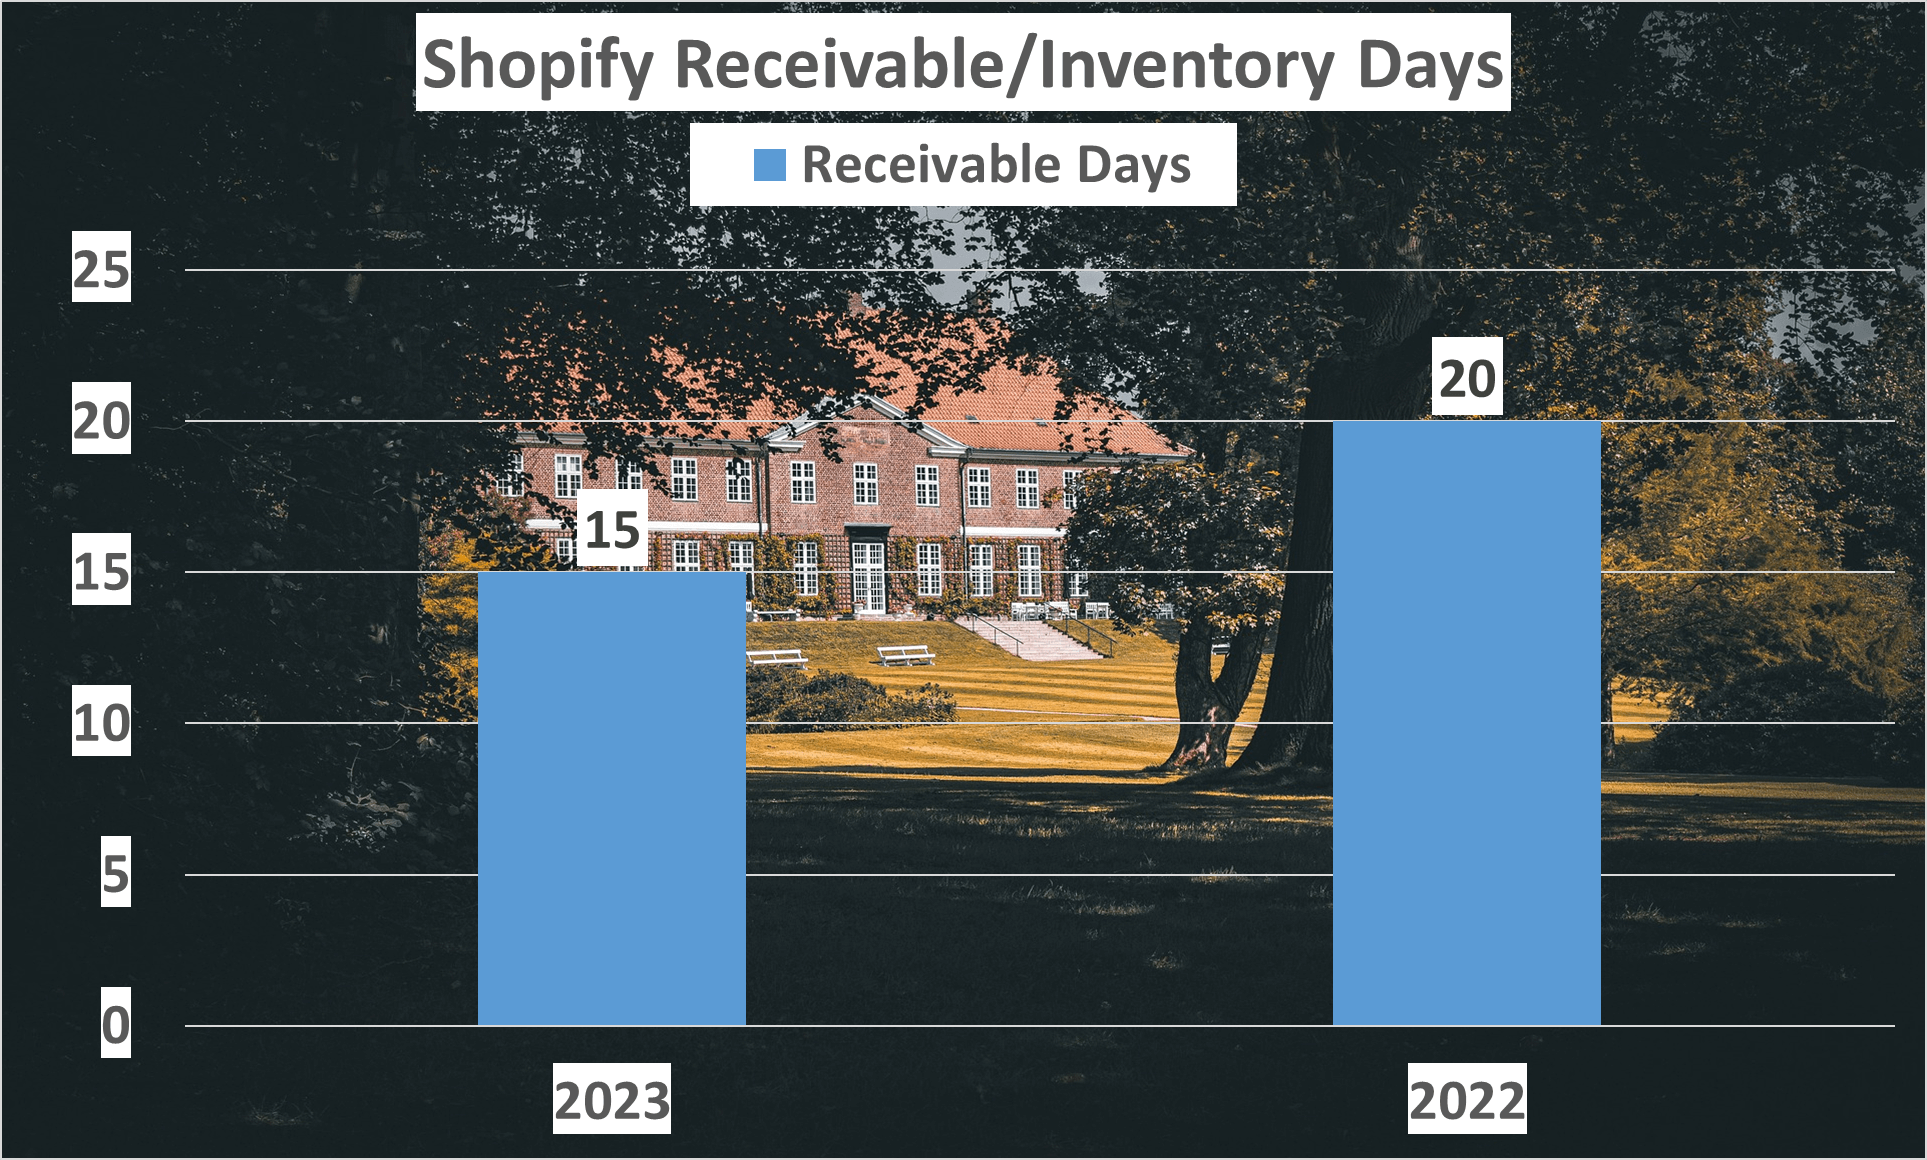
Another vital indicator of financial health is receivable days. In 2023, Shopify’s receivable days decreased to 15, down from 20 the previous year. This reduction suggests the company is adept at promptly collecting receivables, bolstering its cash flow.
Regarding cash flow, let’s examine Shopify’s Operating Cash Flow and Free Cash Flow. Both metrics stood impressively at $900 million in 2023, exhibiting a consistent upward trajectory from 2018 to 2023. This signifies Shopify is generating progressively more cash from its operations, crucial for sustained growth and stability.
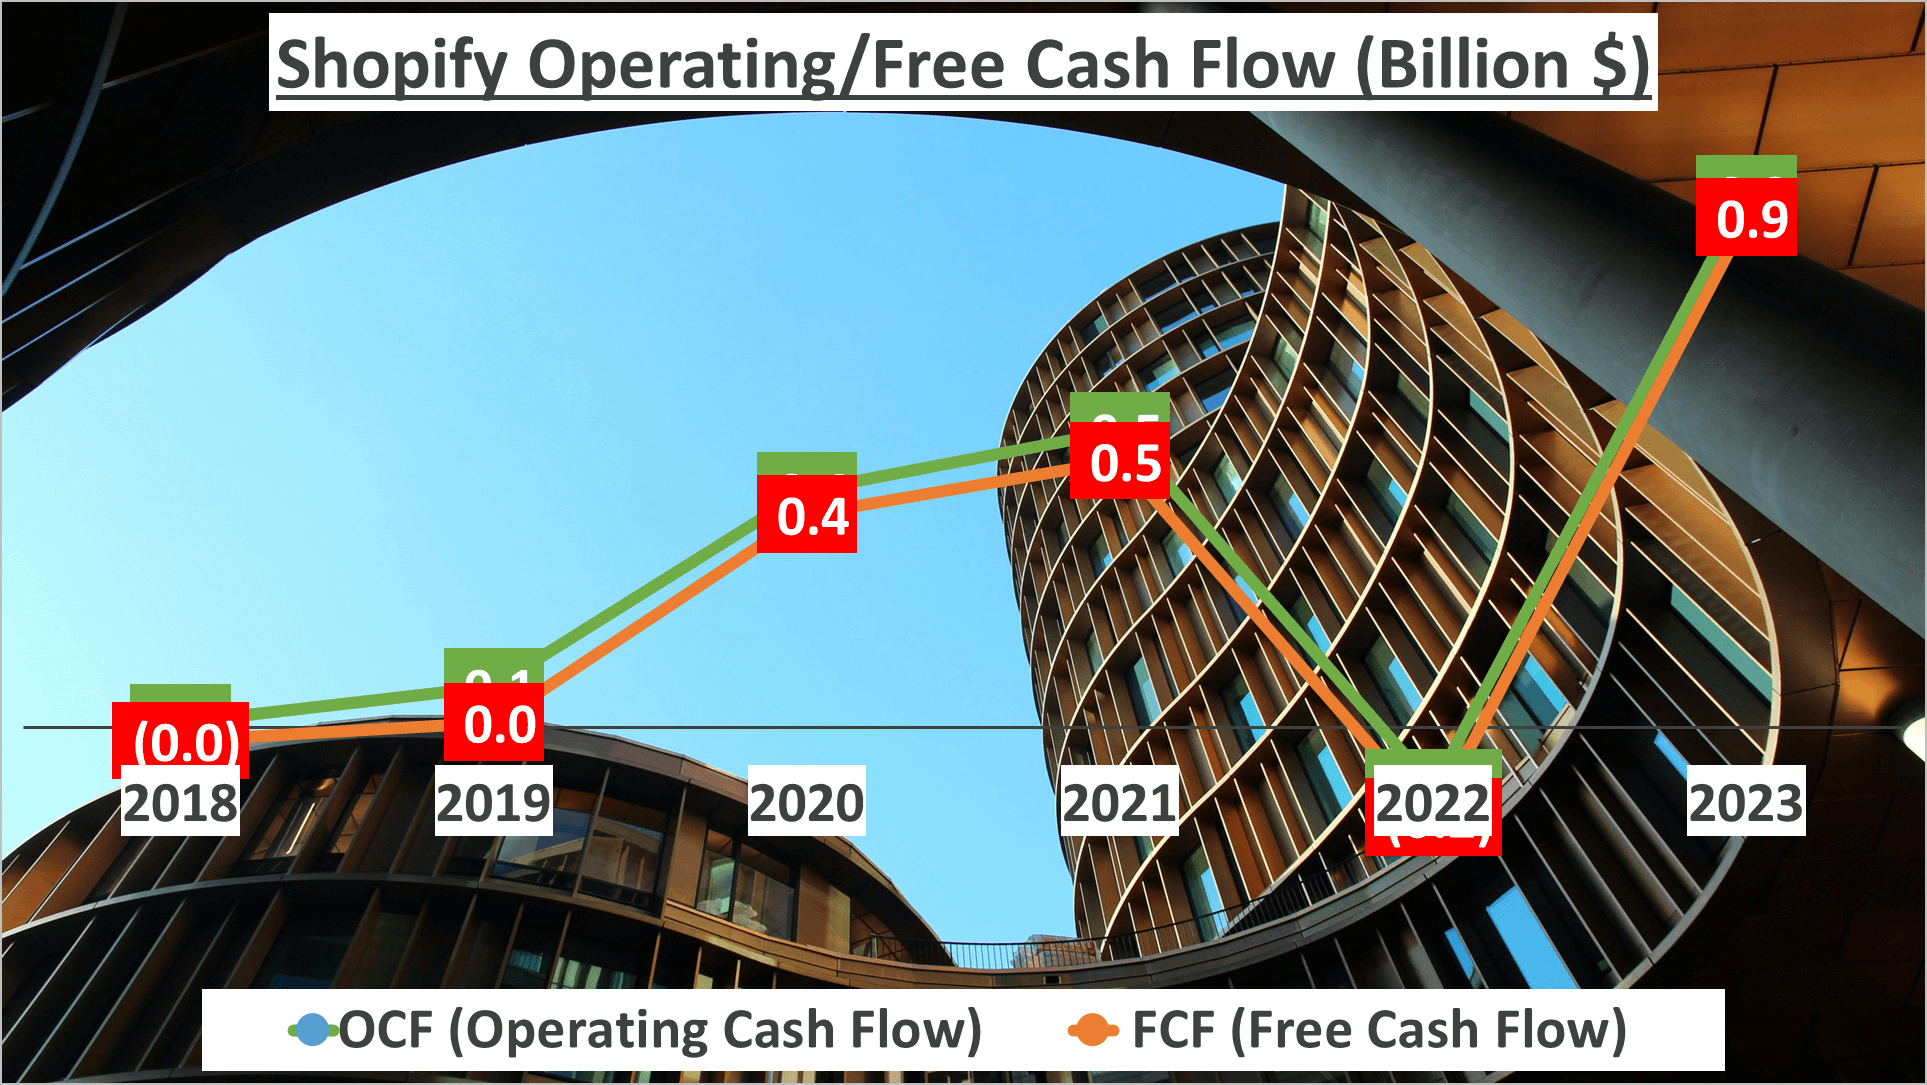
In summary, Shopify boasts robust financial health, with strong total and net assets, an impressive current ratio, expedited receivable days, and consistently growing cash flow. It’s evident that Shopify is a financially sound company with robust cash flow.
Dupont Analysis and The Value of $1000 Investment – Shopify Stock Analysis
Let’s dissect Shopify’s return on equity using a Dupont Analysis.
The Dupont Analysis deconstructs Return on Equity (ROE) into three components: Net Profit Margin, Asset Turnover, and Equity Multiplier. Let’s examine these components for Shopify in 2023 and compare them to the previous year, 2022.
In 2023, Shopify’s ROE stood at 1%, a significant improvement from the negative 43% ROE in 2022. This change can be attributed to various factors, so let’s delve deeper.
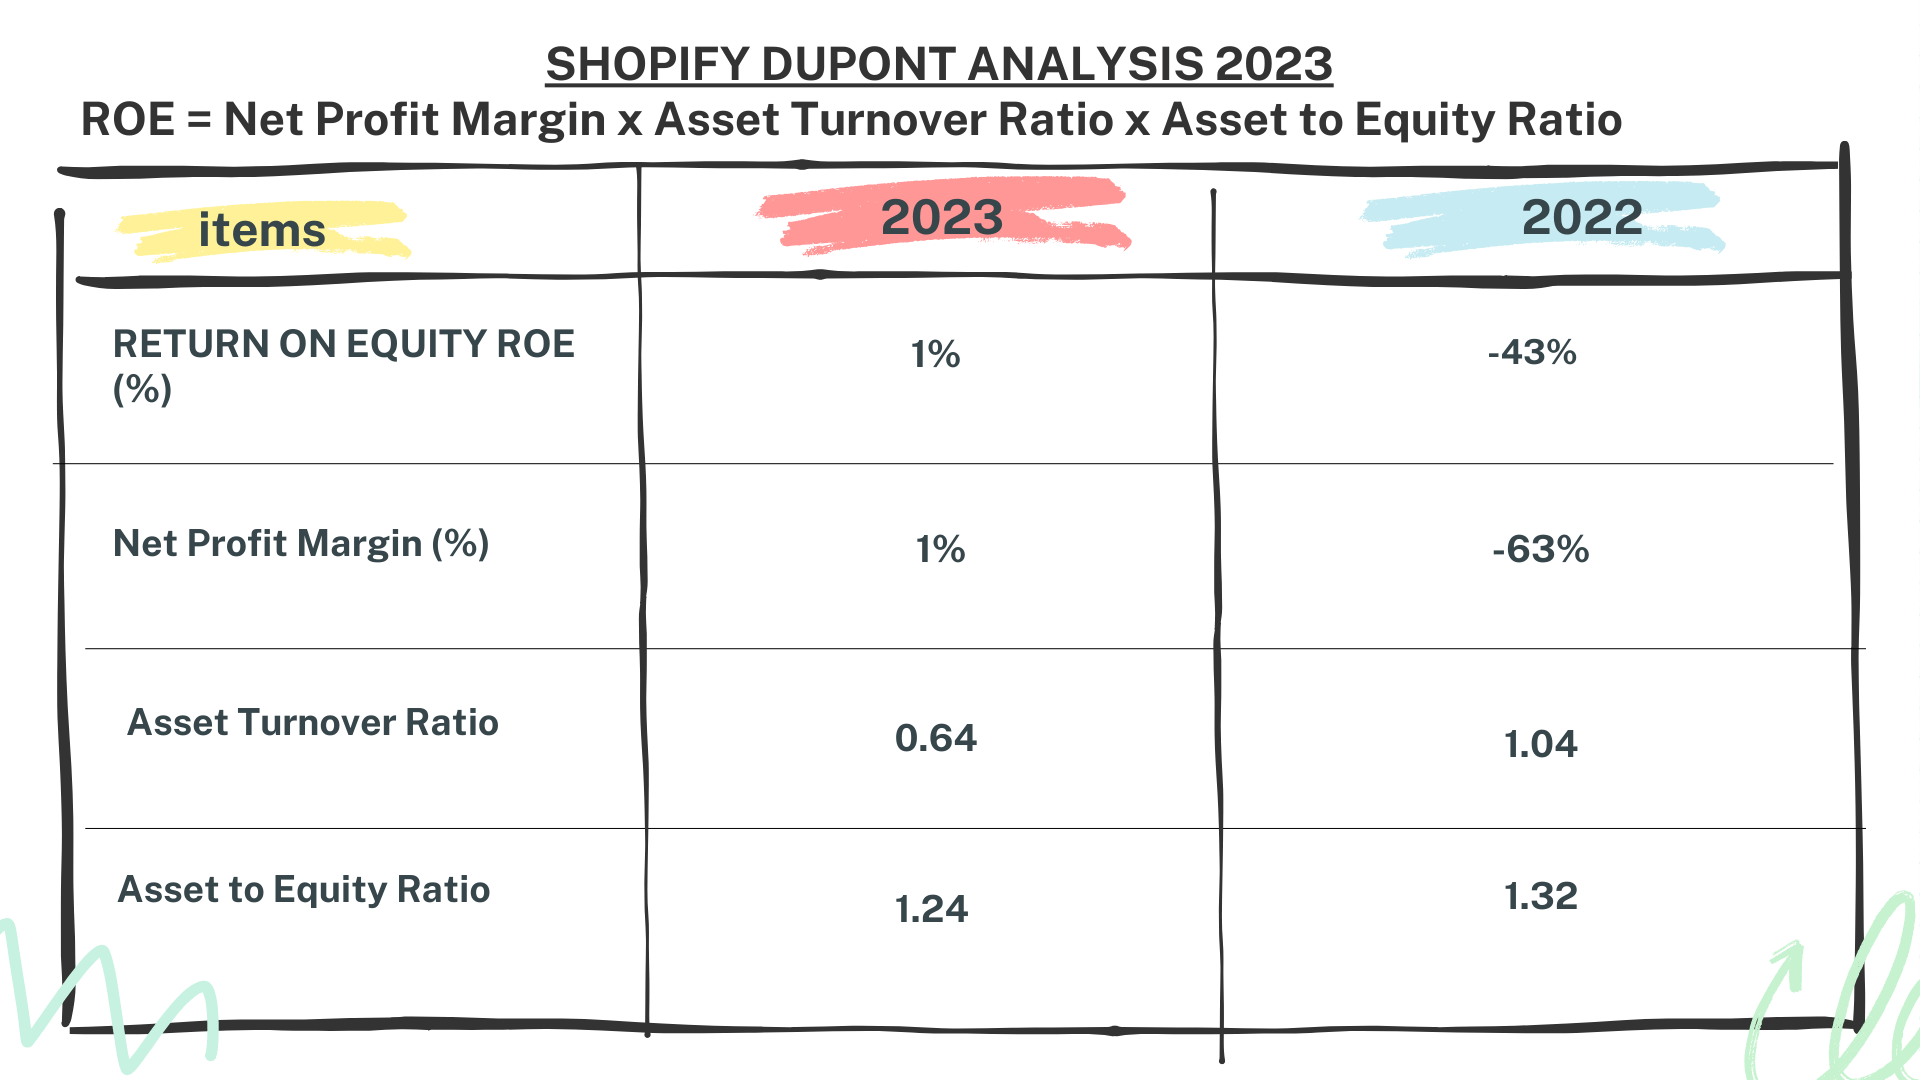
Shopify’s Net Profit Margin in 2023 was 1%, contrasting sharply with the negative 63% in 2022. This indicates Shopify’s enhanced efficiency in converting revenue into profit.
Next, the Asset Turnover ratio was 0.64 in 2023, down from 1.04 in 2022, suggesting a slight decline in Shopify’s efficiency in utilizing assets to generate sales.
Lastly, the Equity Multiplier in 2023 was 1.24, compared to 1.32 in 2022, indicating Shopify’s reduced reliance on debt to finance assets.
Now, let’s revisit the initial query: What would a $1000 investment in Shopify in 2018 be worth today, in March 2024?
Prepare to be astonished. Your $1000 investment in Shopify in 2018 would now amount to a remarkable $5515! That’s a staggering 452% increase in value, or an annual growth rate of 41%!
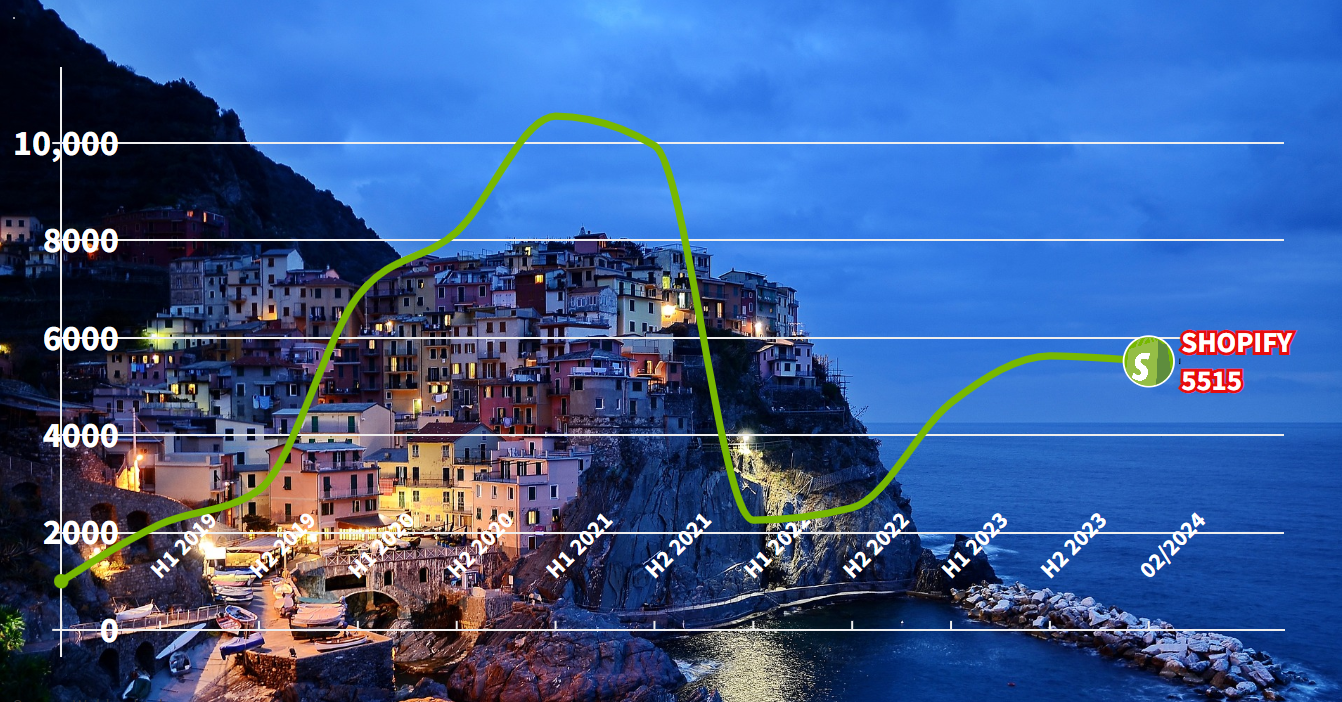
In summary, your $1000 investment in Shopify in 2018 has blossomed into $5515 by March 2024, marking a remarkable 452% surge!
Wrap Up and Call to Action – Shopify Stock Analysis
Our exploration of Shopify’s financial landscape concludes here.
Throughout our journey, we’ve witnessed remarkable revenue expansion, steadfast profit margins, and robust financial well-being.
Imagine, a mere $1000 investment in Shopify in 2018 would now soar to an astounding $5515. A remarkable return, wouldn’t you agree?
We extend our gratitude for accompanying us on this analytical voyage.
Stay tuned for further enlightening financial analyses by subscribing.
Feel free to suggest the next business you’d like us to dissect in our analyses.
Author: investforcus.com
Follow us on Youtube: The Investors Community


