ADI vs TXN Stock Analysis – Curious about how Analog Devices (ADI) and Texas Instruments (TXN) stack up in terms of financial performance?
These two American semiconductor giants, Analog Devices and Texas Instruments, have long been dominant players in the industry, shaping the digital landscape with their innovative technologies.
In this analysis, we’ll thoroughly examine their financials, comparing and contrasting key metrics such as total revenues, profit margins, and investment returns.
We’ll scrutinize their performance over a five-year span, spanning from 2018 to 2023.
Our exploration will include breaking down their revenues by sector and geography, analyzing profit margins, and assessing net profits.
Additionally, we’ll evaluate the returns from investing $1000 in each company in 2018.
But that’s not all – we’ll also delve into their asset positions, operational efficiency, and return on equity.
So, fasten your seatbelts, as we embark on an enlightening journey through the financials of these industry titans. Stay tuned for insights into the performance of ADI and TXN!
Revenue Comparison – ADI vs TXN Stock Analysis
Let’s kick off by examining the total revenues generated by Analog Devices (ADI) and Texas Instruments (TXN). In 2023, ADI reported a total revenue of $12.3B, while TXN reported $17.5B.
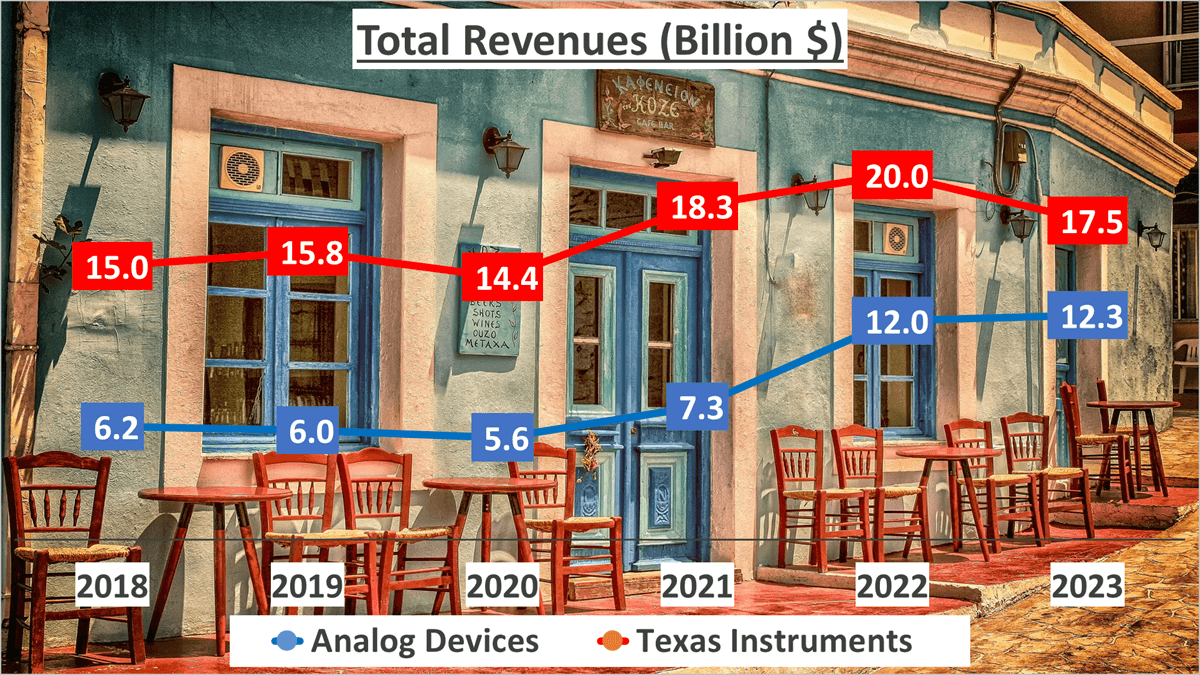
Stepping back, we notice an intriguing growth pattern. Over the last five years, ADI’s revenue has grown at a compound annual growth rate (CAGR) of 15%, whereas TXN’s revenue has grown at a CAGR of only 3%.
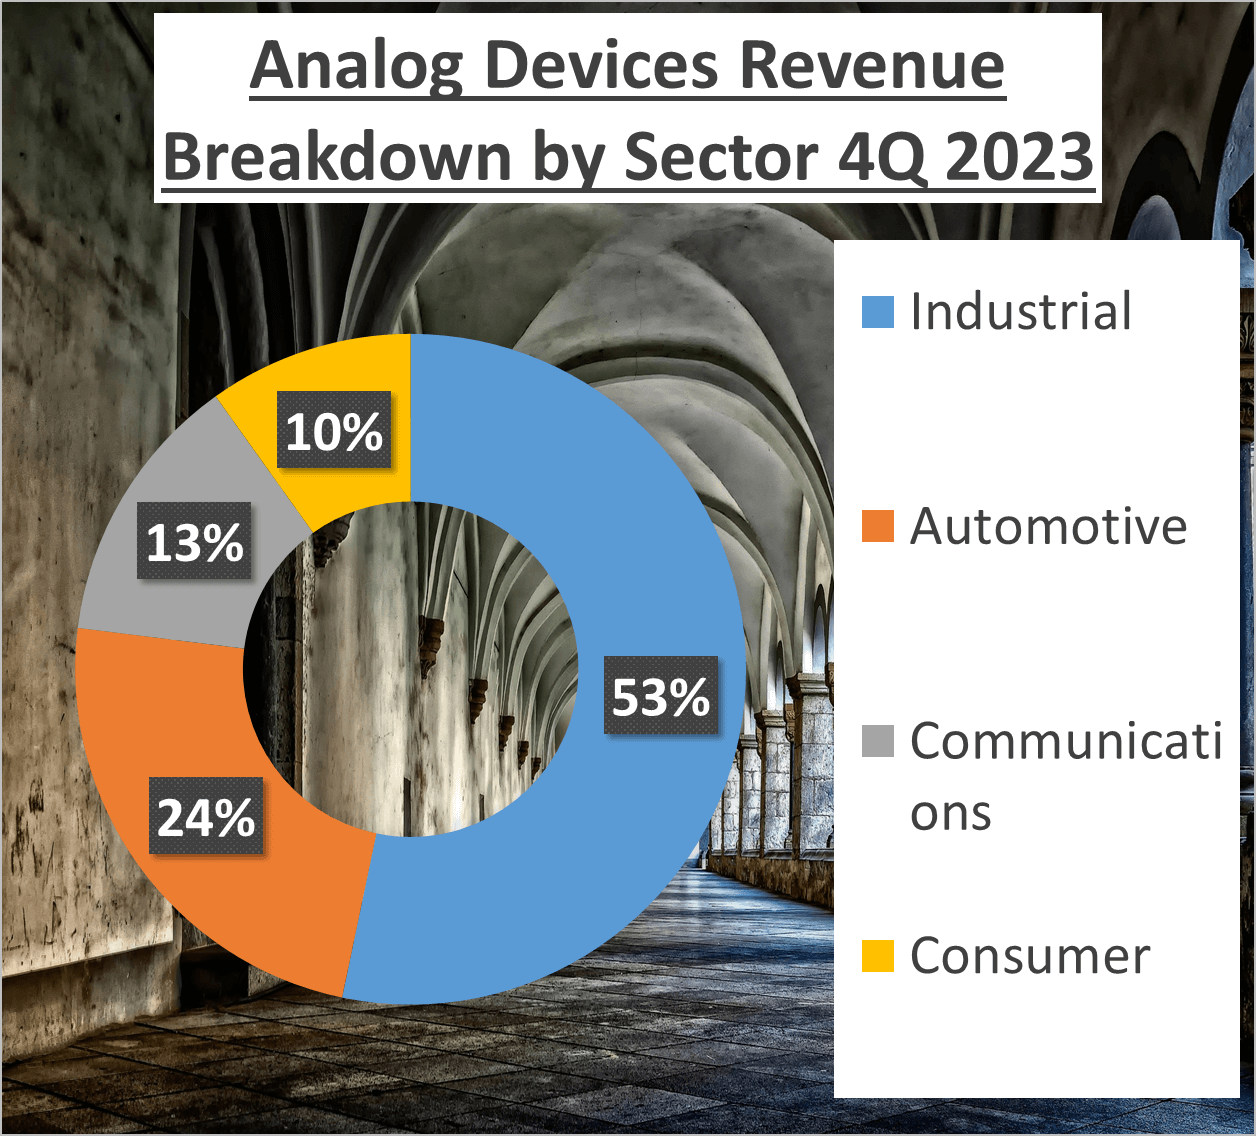
Now, let’s delve deeper into these revenues. ADI boasts a diversified revenue structure: 53% from the industrial sector, 24% from automotive, 13% from communications, and the remaining 10% from consumer products.
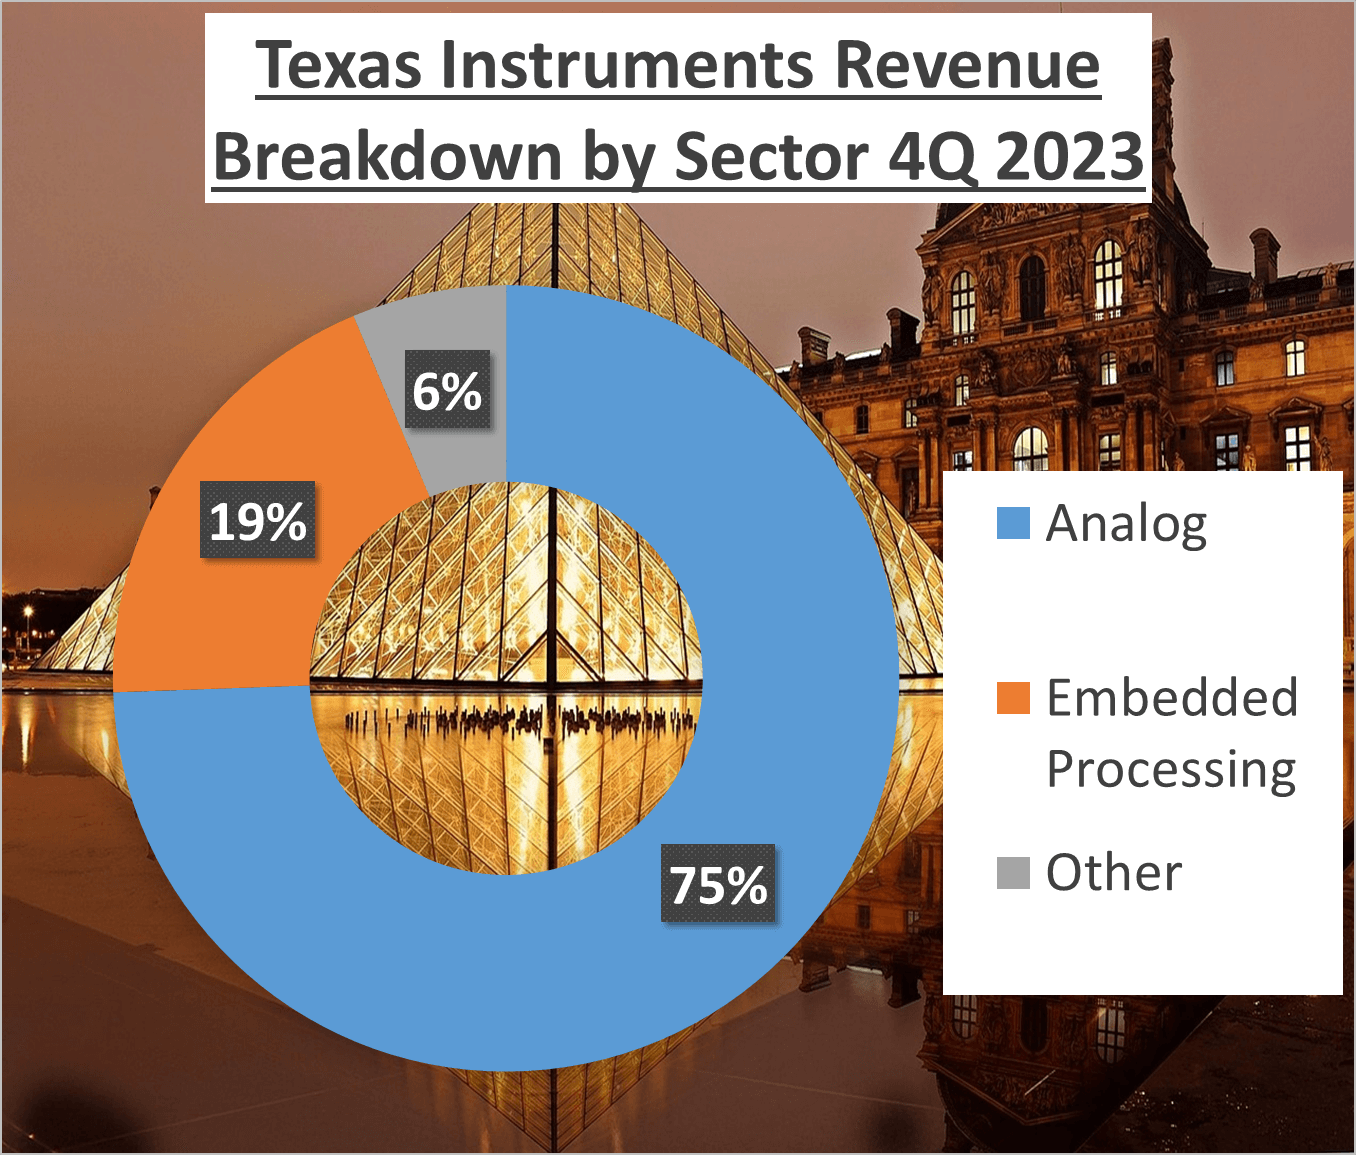
In contrast, TXN heavily relies on its analog business, contributing 75% of its total revenue, with the remainder split between embedded processing (19%) and other sources (6%).
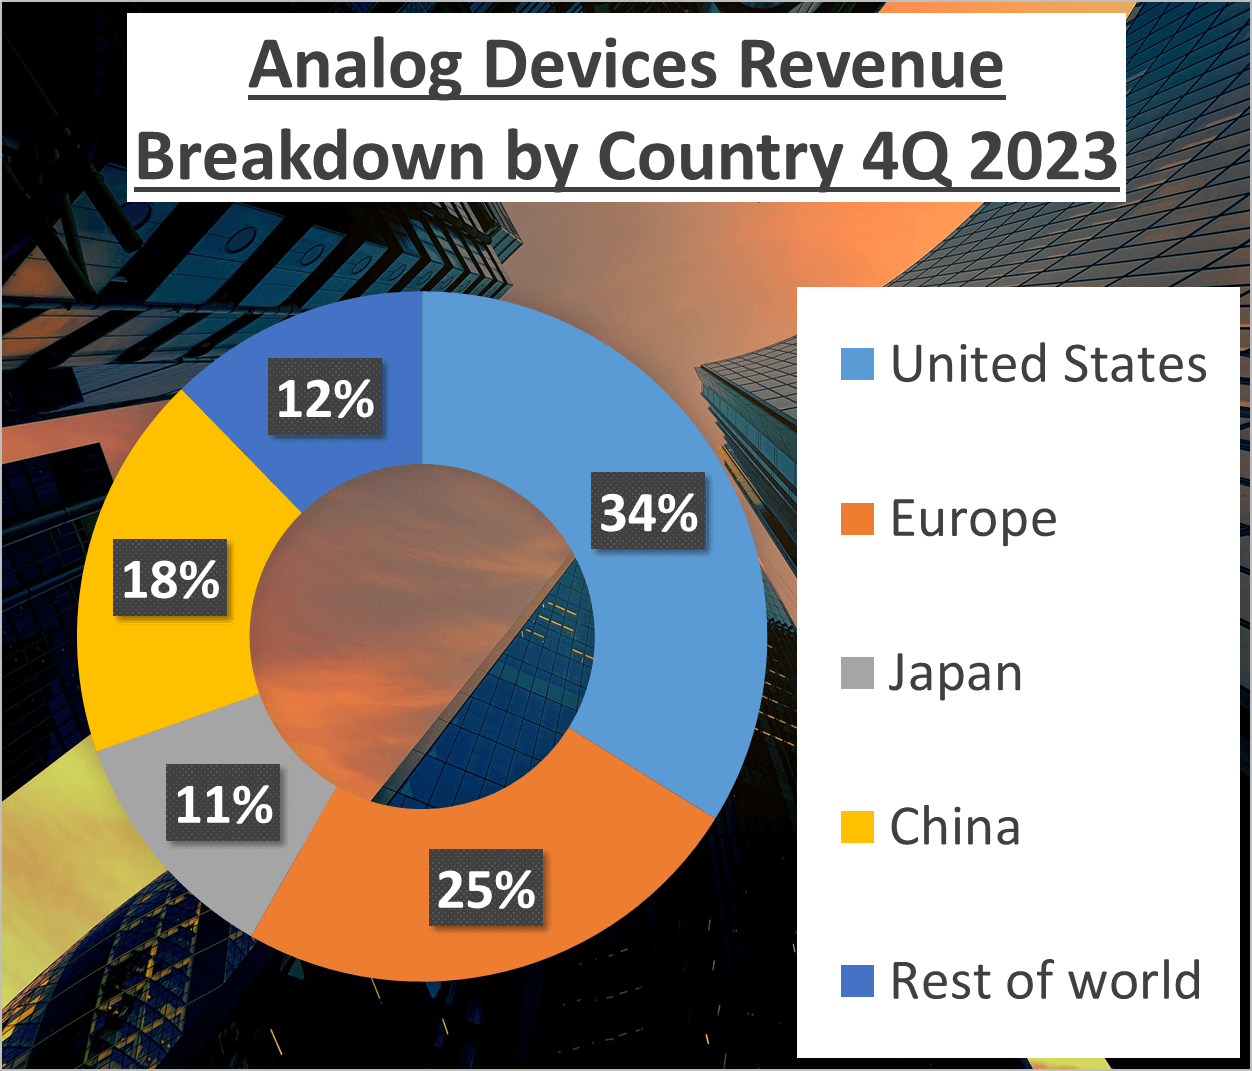
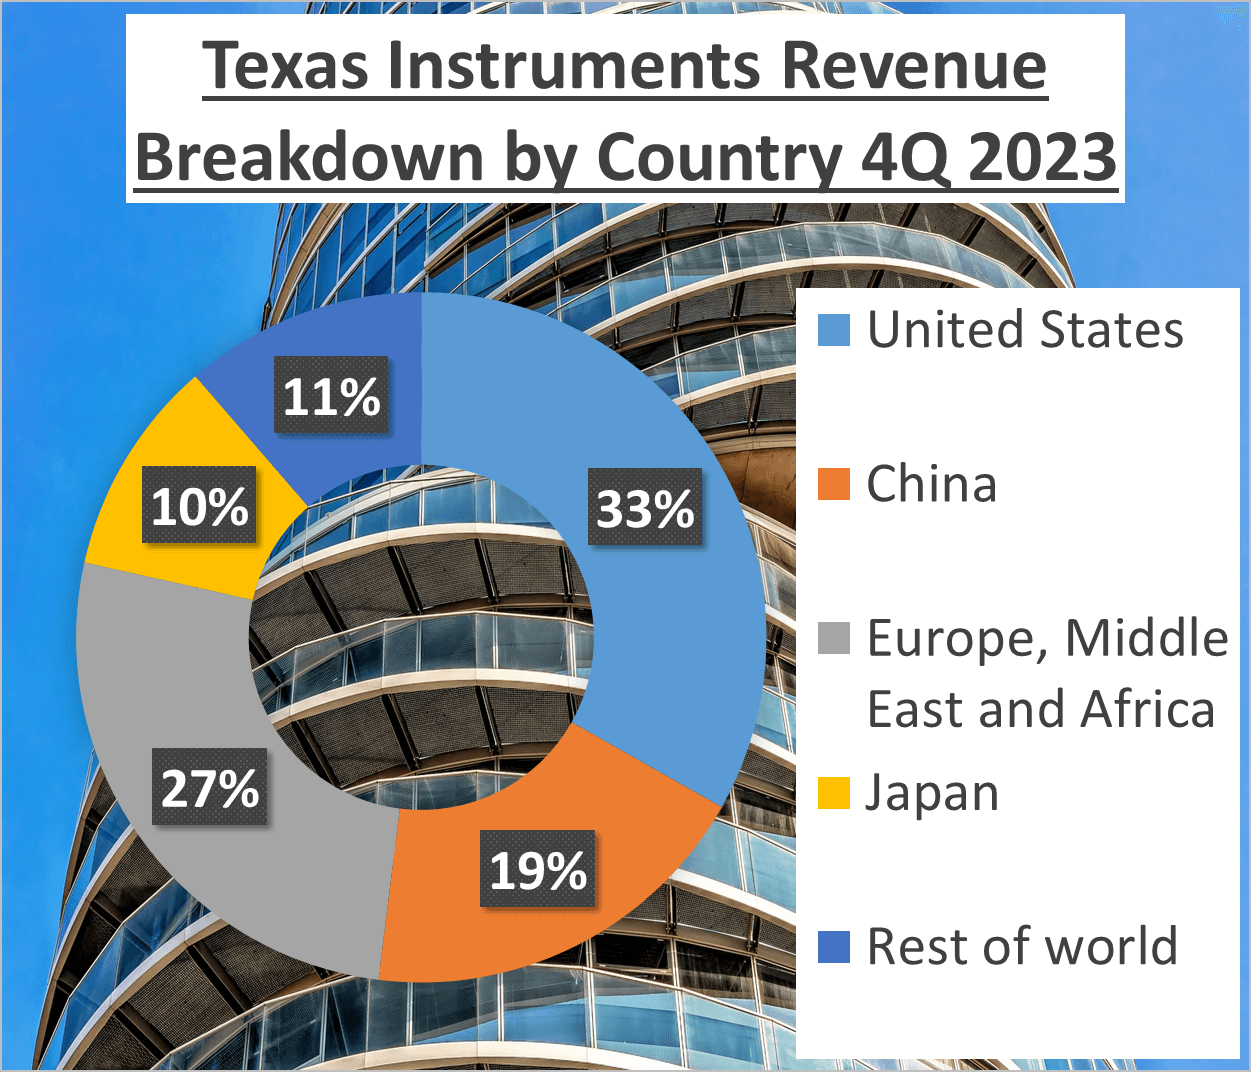
Examining the geographical distribution of revenues, both companies have significant presences in the United States, with ADI generating 34% of its revenue there and TXN generating 33%. However, they also have substantial revenues from other regions. For ADI, 24% of its revenue comes from Europe, 11% from Japan, 18% from China, and 12% from the rest of the world. For TXN, 19% of its revenue comes from China, 26% from Europe, the Middle East, and Africa, 10% from Japan, and 11% from the rest of the world.
This paints a clear picture of the growth trajectories of both companies. It’s not just about total revenue, but also about its sources and growth rates. As we progress, it’s crucial to monitor these trends and their evolution closely.
Profit Margins and Net Profit – ADI vs TXN Stock Analysis
Let’s delve into the profit margins and net profits of Analog Devices (ADI) and Texas Instruments (TXN).
First up, the Gross Profit Margin. In 2023, ADI posted a Gross Profit Margin of 64%, slightly edging out TXN, which reported 63%. This metric indicates manufacturing efficiency and production costs, showcasing strong profitability for both, with ADI having a slight edge.

Now, onto the Net Profit Margin. This figure reveals how much revenue translates into profit after expenses. In 2023, ADI boasted a Net Profit Margin of 27%, a notable increase from its five-year average of 23%. Conversely, TXN posted a Net Profit Margin of 37%, closely aligned with its five-year average of 36%, indicating TXN’s proficiency in converting revenue into net income.

Lastly, let’s look at Net Profit, which is the earnings left after subtracting expenses from revenue. In 2023, ADI’s Net Profit was $3.3B, while TXN’s was $6.5B. Over the past five years, ADI’s Net Profit grew at 17%, outpacing TXN’s growth rate of 12%, suggesting ADI’s faster growth despite TXN’s higher absolute net profit.

These insights shed light on the financial health and operational efficiency of both companies. While TXN demonstrates slightly higher efficiency with its Net Profit Margin, ADI shows stronger growth with a higher Compound Annual Growth Rate in Net Profit. Understanding these metrics aids in making informed investment decisions.
Investment Analysis: ADI vs TXN Stock Comparison
In this investment analysis, we’ll delve into the performance of Analog Devices (ADI) and Texas Instruments (TXN) over the past five years.
Investment Returns Comparison:
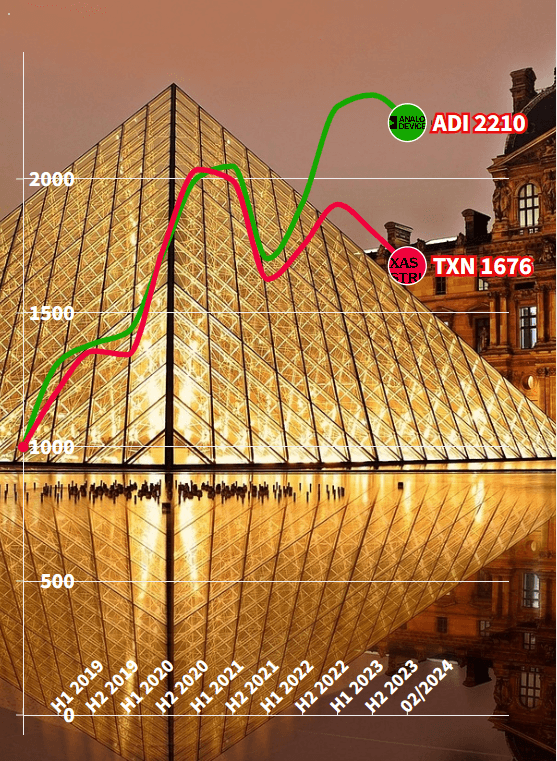
Let’s embark on a comparison of investment returns between ADI and TXN. Imagine you had invested $1000 in both companies in 2018. Fast forward to February 2024, your investment in ADI would have grown to $2210, marking a remarkable 121% increase from the initial investment, translating to an average annual growth of 17%. Meanwhile, your investment in TXN would have grown to $1676, reflecting a solid 68% increase from the initial investment, with an average annual growth of 11%.
Asset Analysis – ADI vs TXN Stock Analysis:
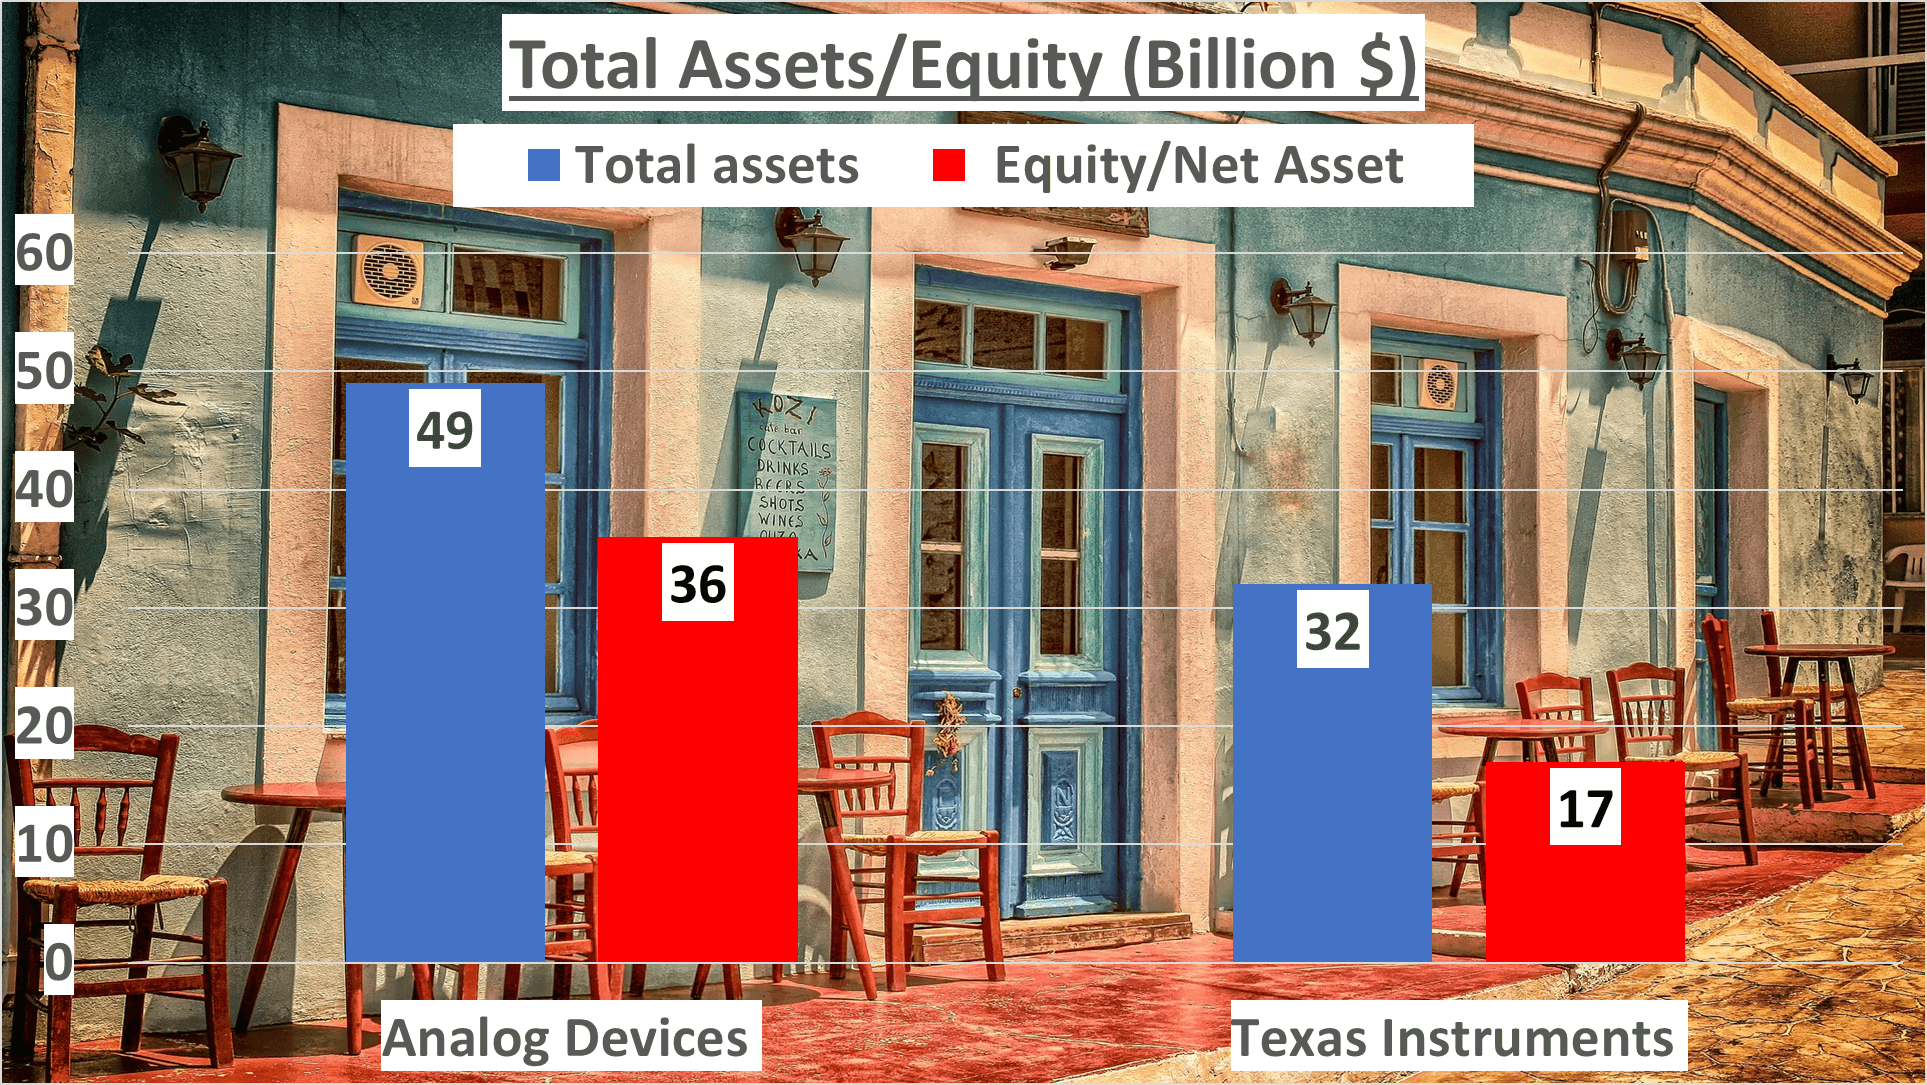
Now, let’s pivot to analyze the asset base of both companies. By the end of 2023, ADI boasted total assets of $49B, with net assets amounting to $36B. Conversely, TXN reported total assets of $32B and net assets of $17B during the same period. To offer clarity, the equity to total assets ratio for ADI stood at 73%, whereas TXN’s was 52%.
Liquidity Ratios – ADI vs TXN Stock Analysis:
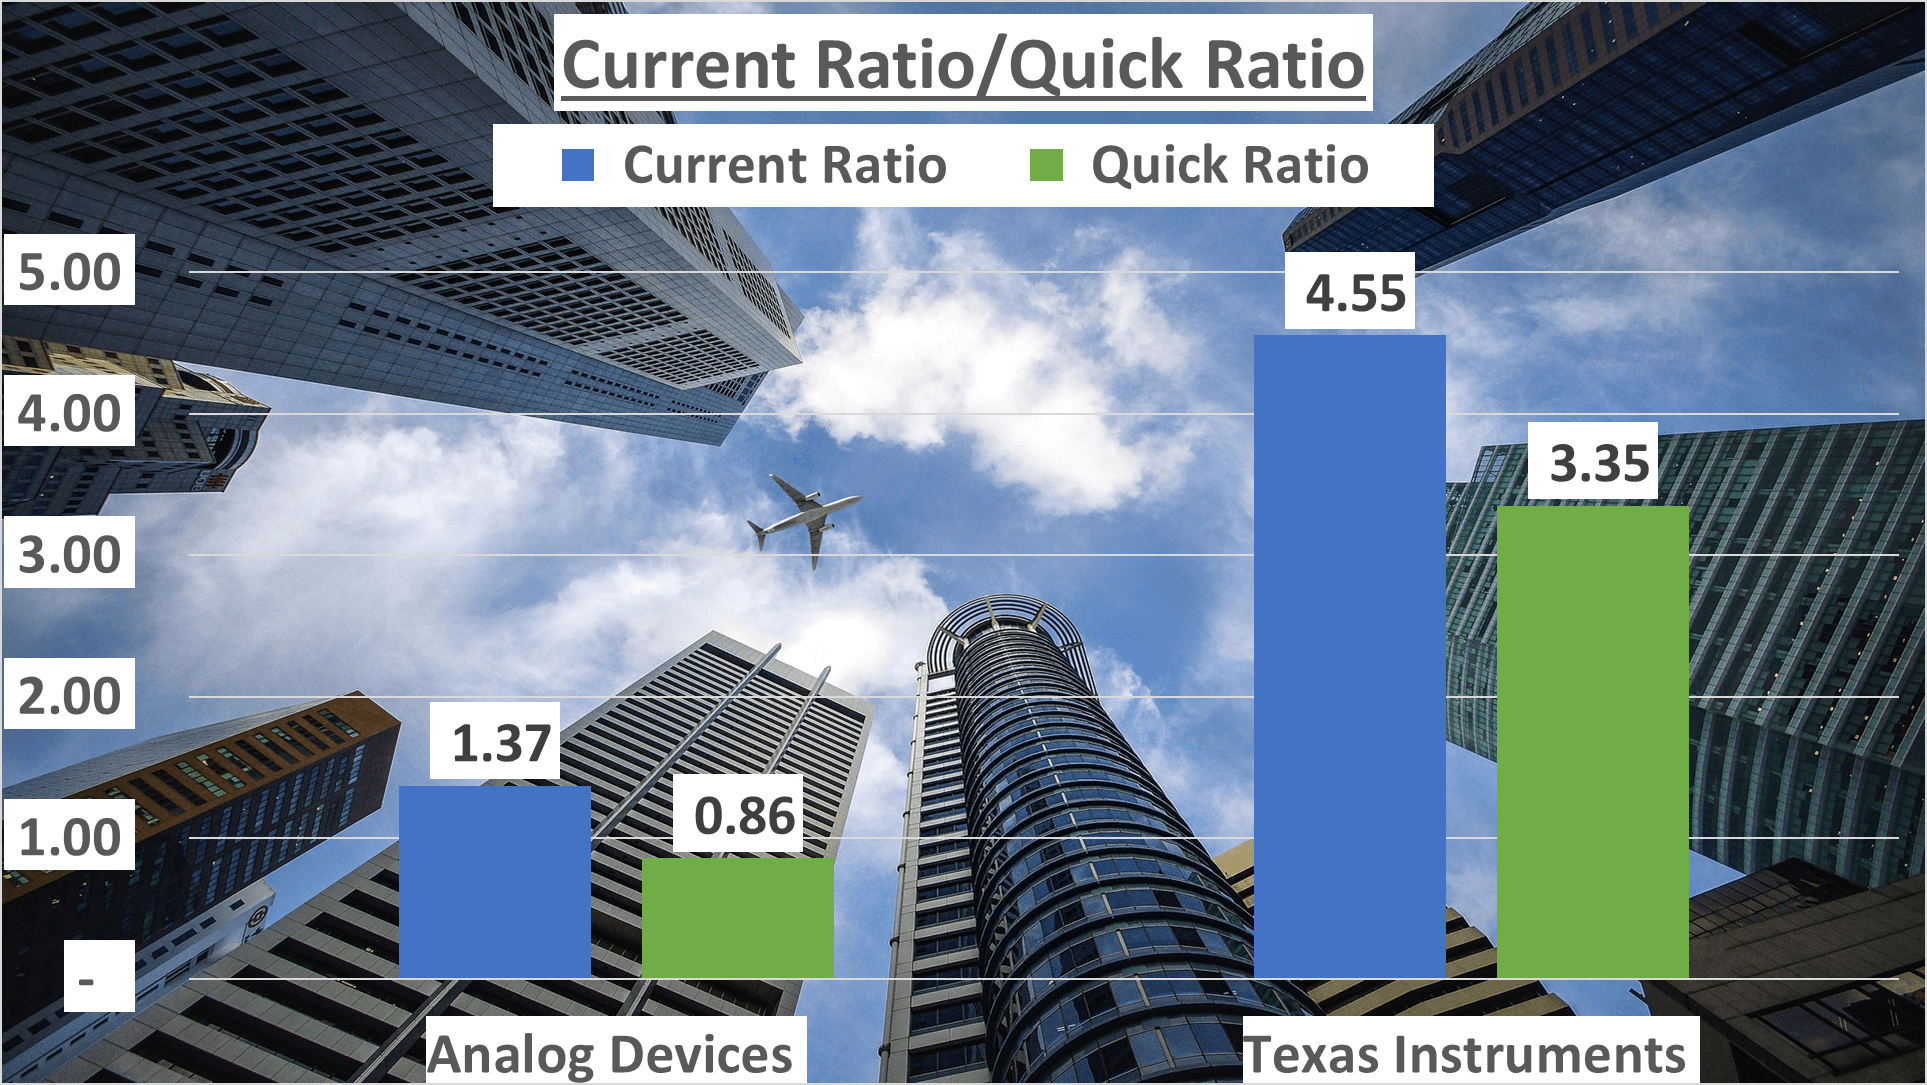
Examining liquidity ratios is crucial in assessing a company’s short-term financial health. ADI had a current ratio of 1.37, while TXN exhibited a higher current ratio of 4.55. Additionally, ADI’s quick ratio was 0.86, contrasting with TXN’s 3.35, excluding inventory.
Conclusion – ADI vs TXN Stock Analysis:
While a higher return on investment can be enticing, it’s imperative to consider various factors beyond mere returns. Factors such as asset base, liquidity ratios, and other financial indicators play a pivotal role in making informed investment decisions. Therefore, a comprehensive analysis encompassing all these aspects is essential for prudent investment choices.
Efficiency, Cash Flow, and ROE Comparison: ADI vs TXN Stock Analysis
Let’s delve into the operational efficiency, cash flow, and ROE of Analog Devices (ADI) and Texas Instruments (TXN).
Operational Efficiency Analysis:
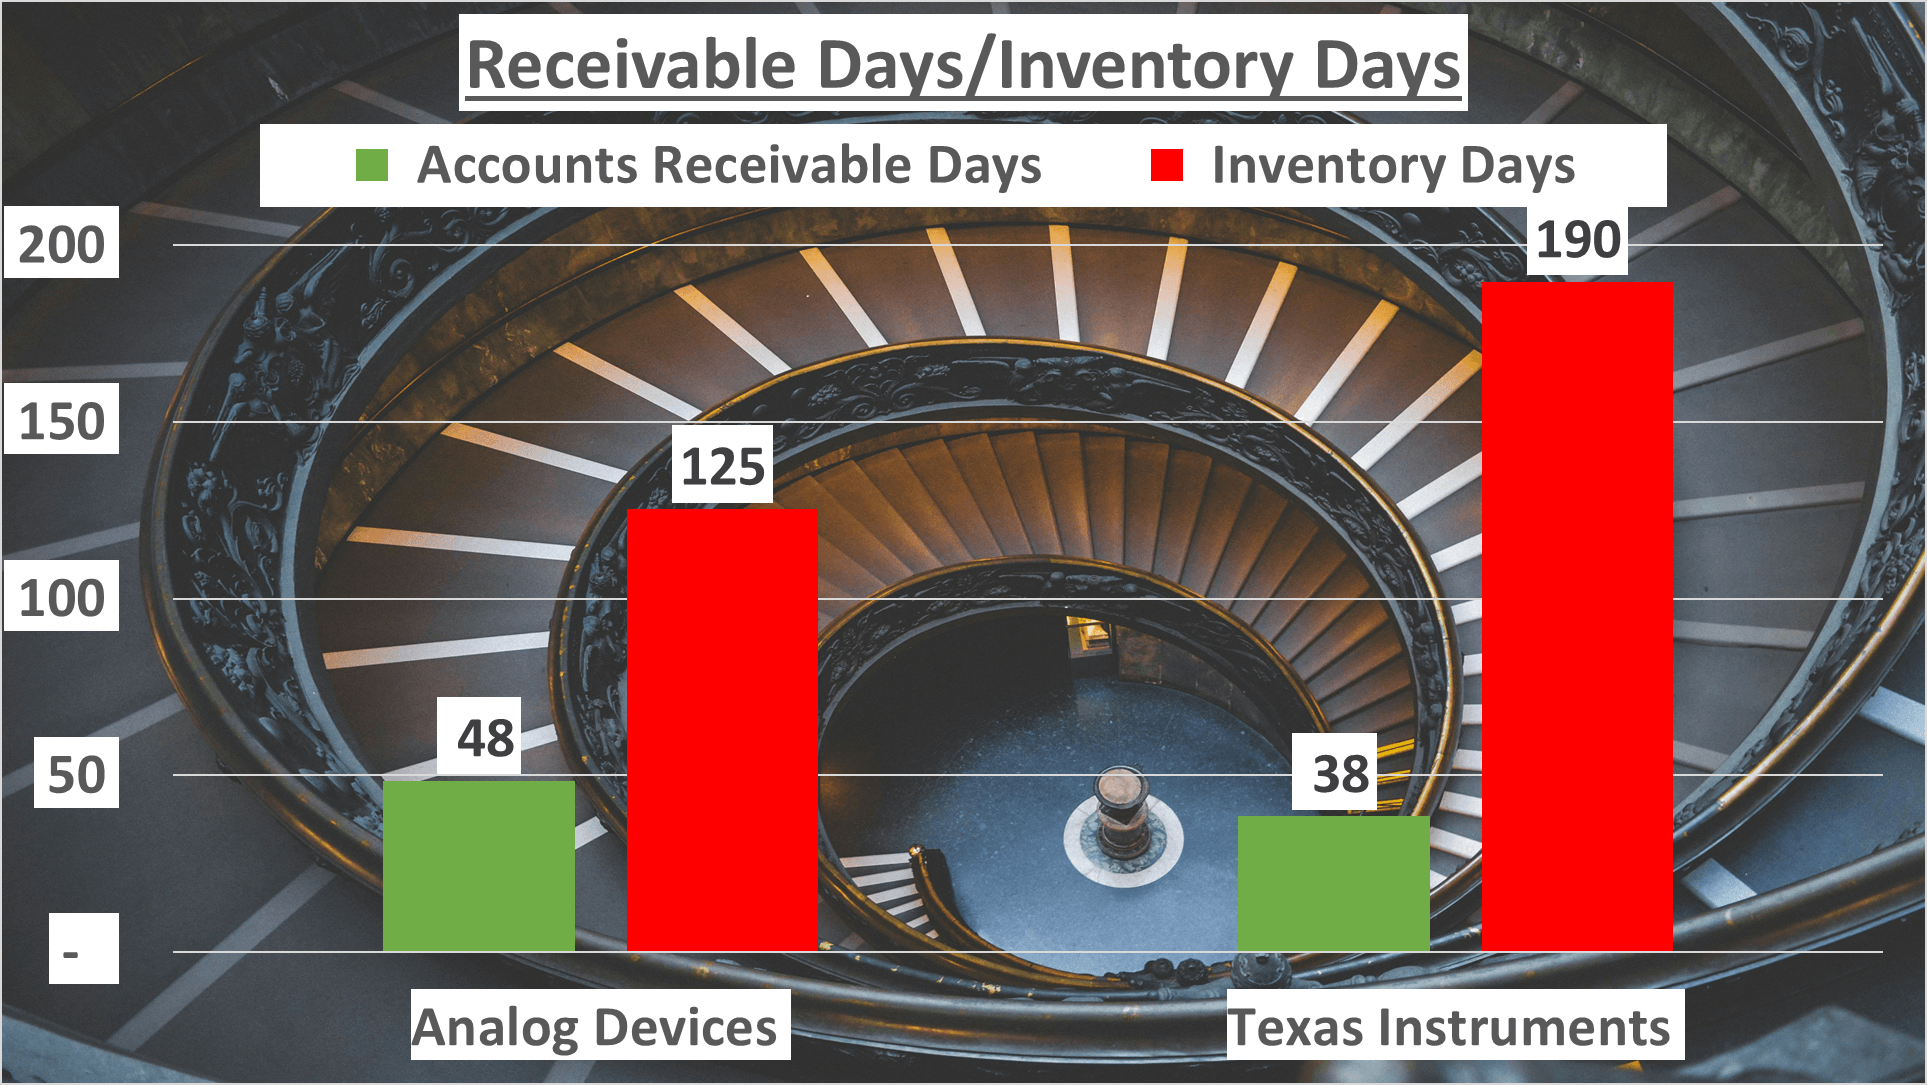
When it comes to operational efficiency, Analog Devices’ inventory turnover stands at 125 days, whereas Texas Instruments’ is at 190 days. Similarly, Analog Devices’ accounts receivable turnover is 48 days, while Texas Instruments’ is 38 days.
Cash Flow Evaluation:
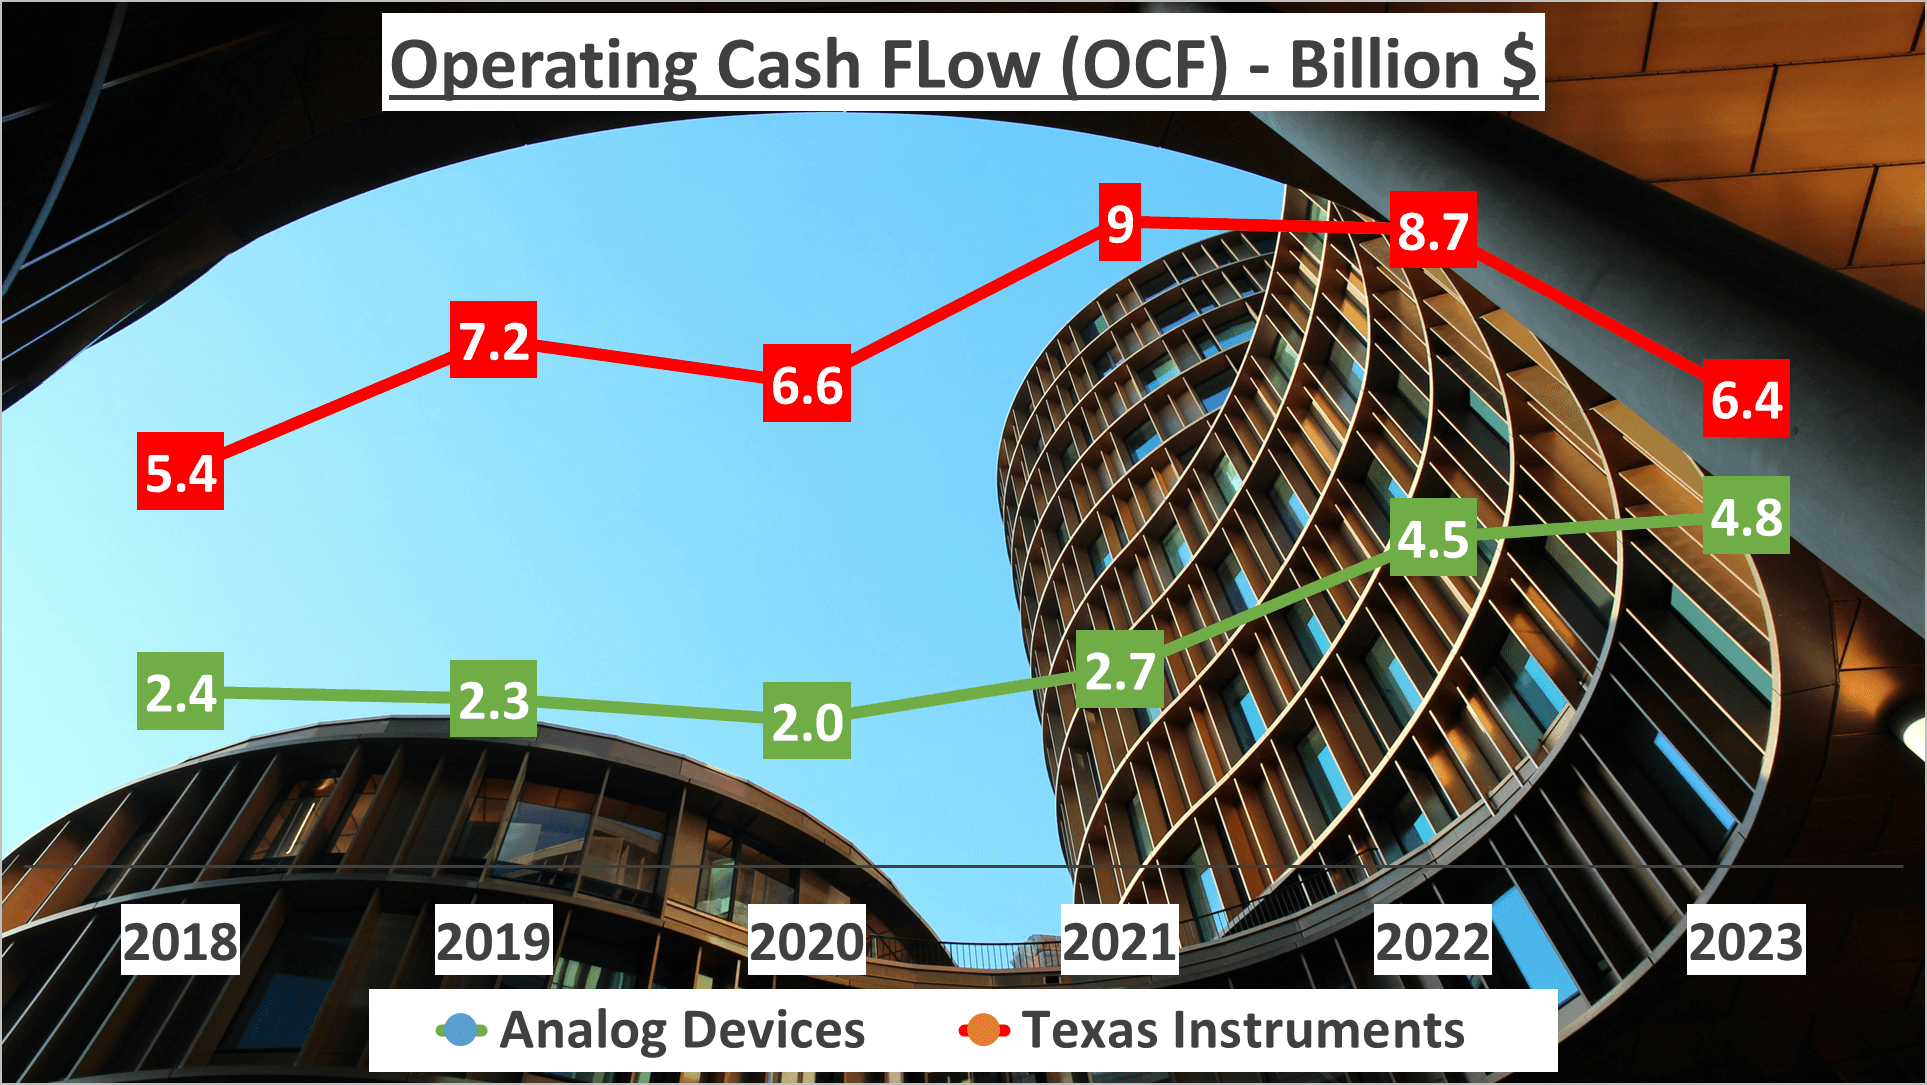
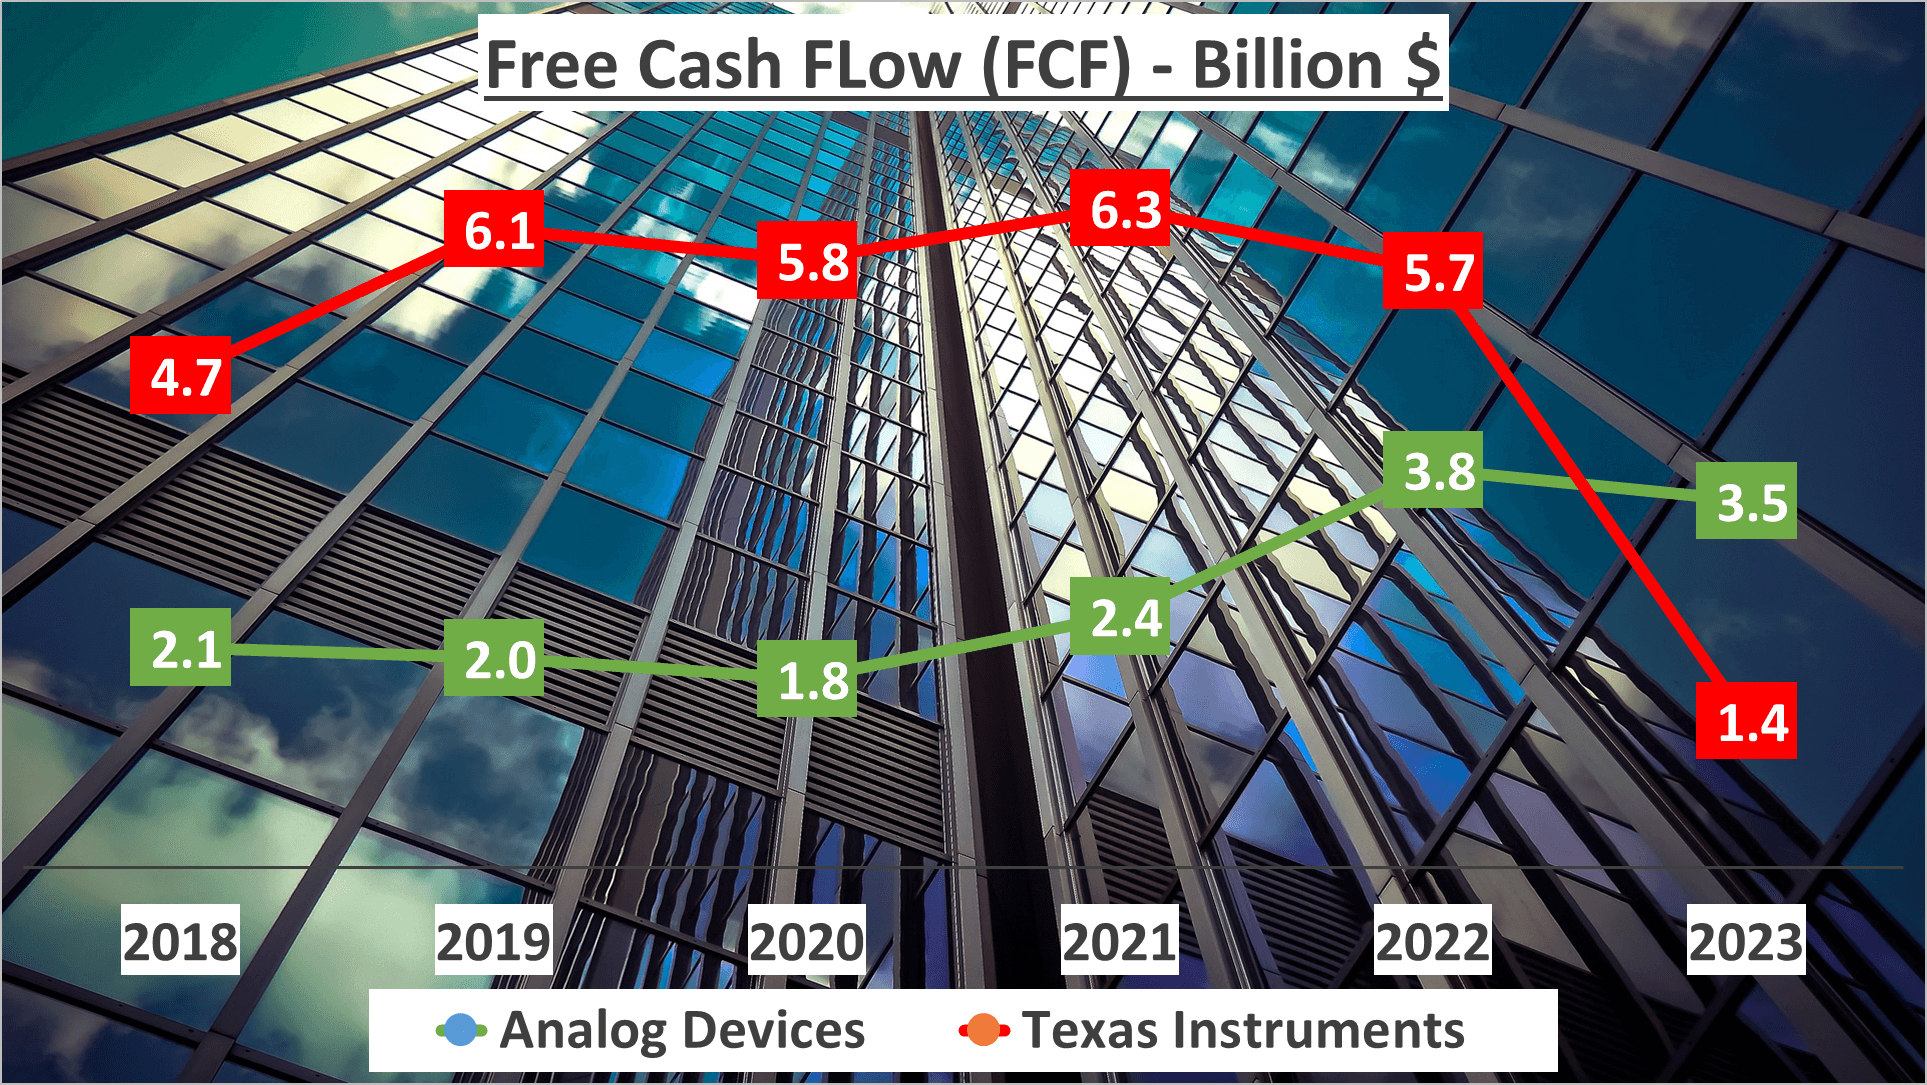
In terms of cash flow, Analog Devices’ operating cash flow amounts to $4.8B, contrasting with Texas Instruments’ $6.4B. Furthermore, Analog Devices’ free cash flow totals $3.5B, whereas Texas Instruments’ stands at $1.4B.
Return on Equity (ROE) Assessment:
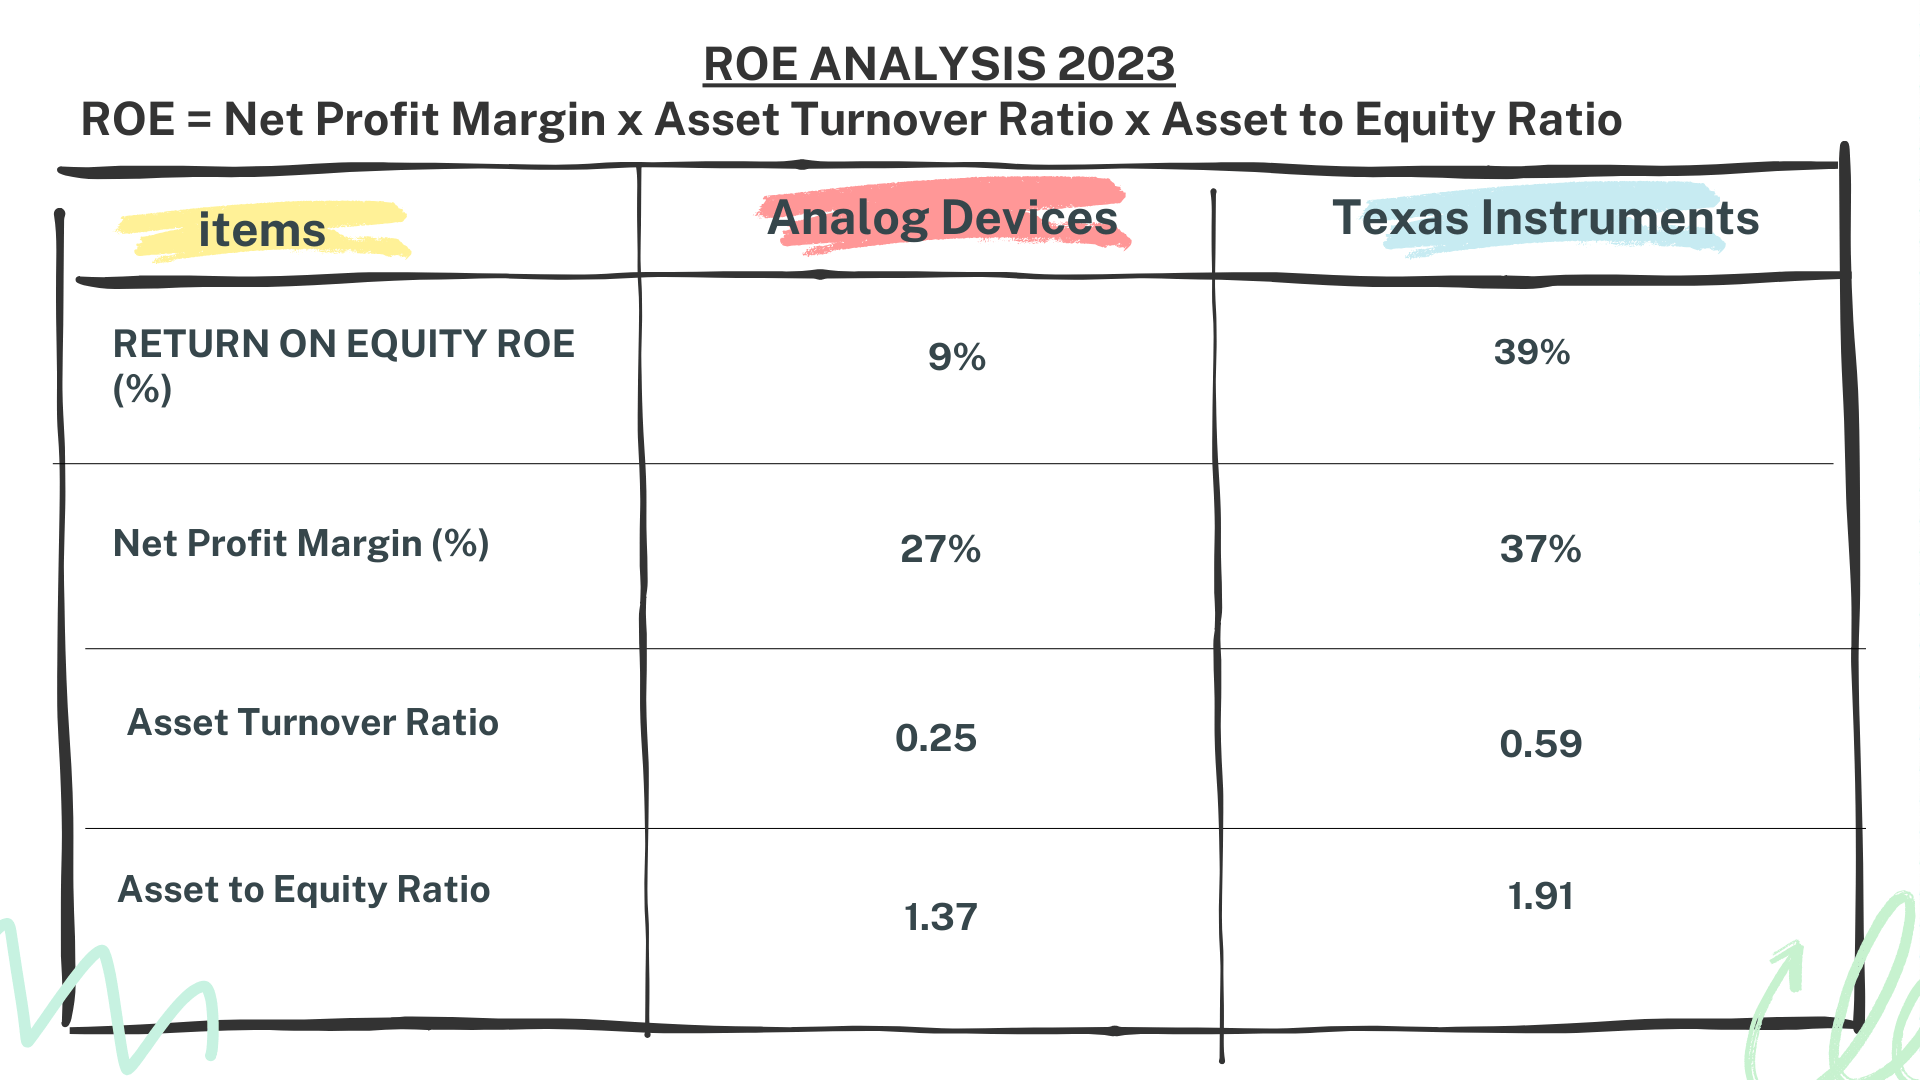
Analyzing the return on equity (ROE), Analog Devices records 9%, whereas Texas Instruments boasts a significantly higher ROE of 39%. Additionally, Analog Devices’ net profit margin is 27%, while Texas Instruments’ is 37%. Their asset turnover rates are 0.25 and 0.59, respectively.
In Conclusion:
This comparative analysis offers valuable insights into the financial performance of both ADI and TXN, shedding light on their operational efficiency, cash flow, and return on equity. These metrics play a pivotal role in evaluating the overall health and profitability of investment options, providing investors with essential data for informed decision-making.
Conclusion: ADI vs TXN Stock Analysis
In summary, both Analog Devices (ADI) and Texas Instruments (TXN) exhibit commendable financial performance. ADI displays robust growth in revenue and net profit, boasting compound annual growth rates of 15% and 17% respectively over the past five years. On the other hand, TXN, although growing at a slower pace, maintains steady profit margins and enjoys a higher return on equity.

A closer look at the sector and geographic breakdown of revenues underscores the diversified income streams of both companies. Furthermore, their current and quick ratios signal a solid liquidity position, while operational efficiency metrics offer valuable insights into their business operations.
Comparing investments, ADI proves to be the more lucrative option over the past six years. However, it’s crucial to remember that past performance does not guarantee future results.
For more financial analyses like this, don’t forget to subscribe to our channel. Feel free to suggest which companies you’d like us to analyze next.
Author: investforcus.com
Follow us on Youtube: The Investors Community

