Amazon vs Ebay Stock Analysis – Curious about how Amazon’s financials measure up against eBay’s? Today, we’ll dive into the specifics of their financial performance. These are two major players in the online marketplace, and understanding their financials is crucial for investors.
Let’s kick off with a snapshot of their third-quarter financials in 2023. Amazon reported a total revenue of $405 billion, dwarfing eBay’s $7.6 billion. However, to grasp the significance of these figures, let’s examine their growth trajectories.
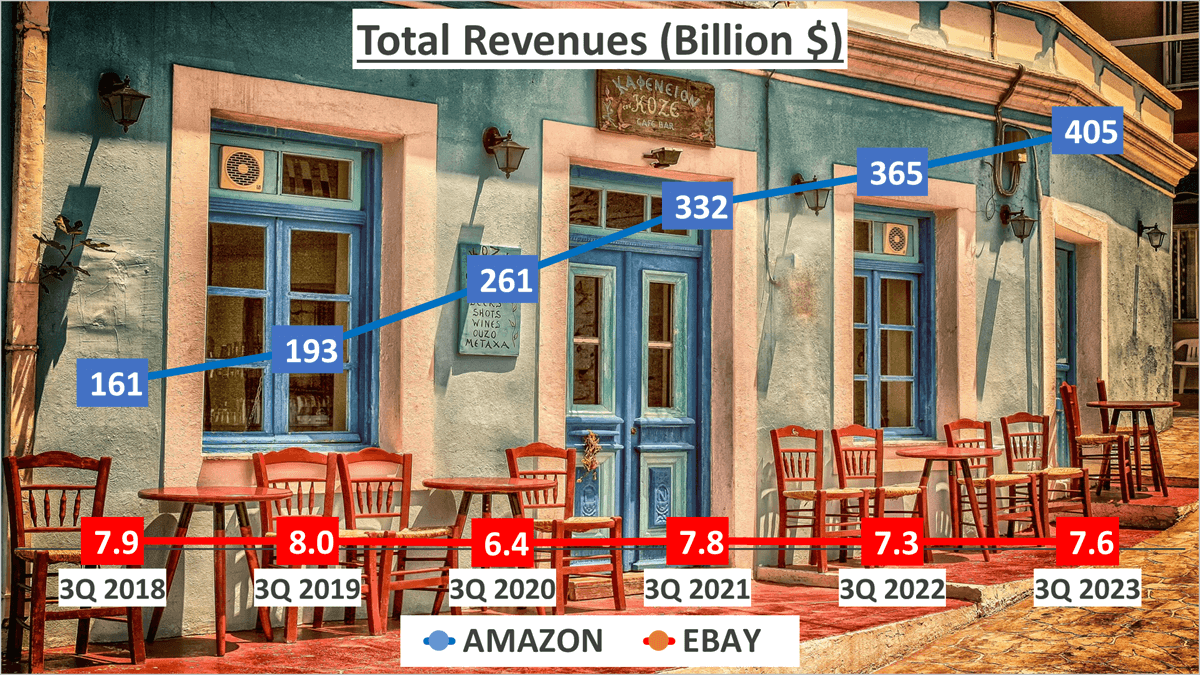
Rewind to the third quarter of 2018. Over the past five years, Amazon has enjoyed a Compound Annual Growth Rate (CAGR) of 20%, showcasing its consistent market dominance and successful expansion strategies. In contrast, eBay’s revenues have seen a negative CAGR of 1% during the same period, indicating a stagnant growth pattern and raising concerns about its competitive stance in the dynamic e-commerce landscape.
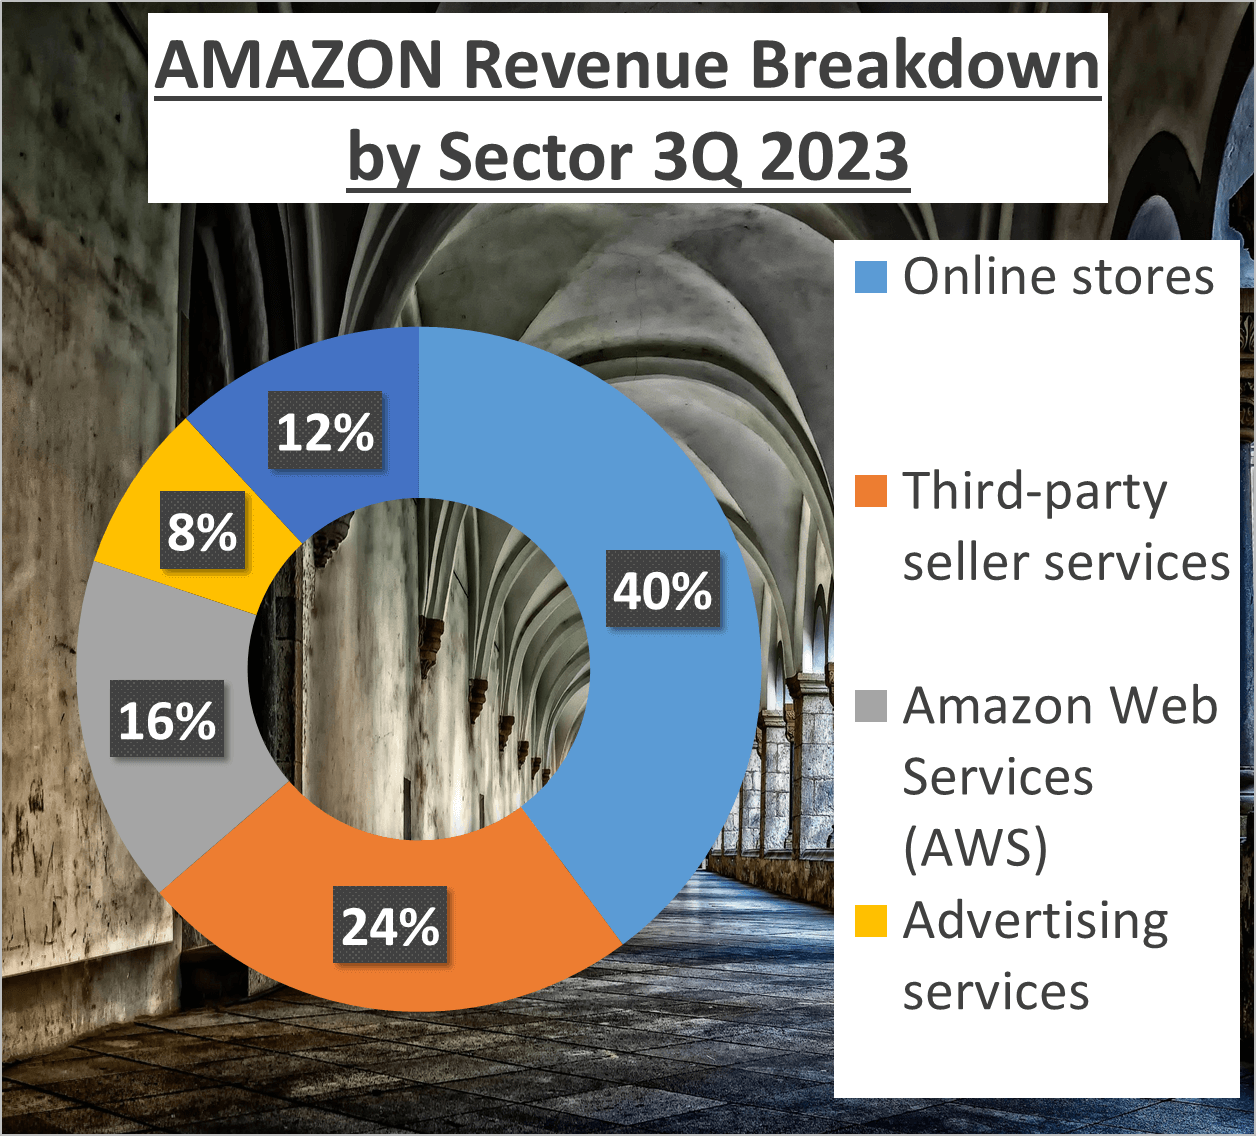
But total revenue is just part of the story; the revenue breakdown matters too. Amazon boasts a diversified revenue stream: 40% from online stores, 24% from third-party seller services, 16% from Amazon Web Services (AWS), 8% from advertising services, and the remaining 12% from other sources. In contrast, eBay relies solely on its marketplace for revenue generation.
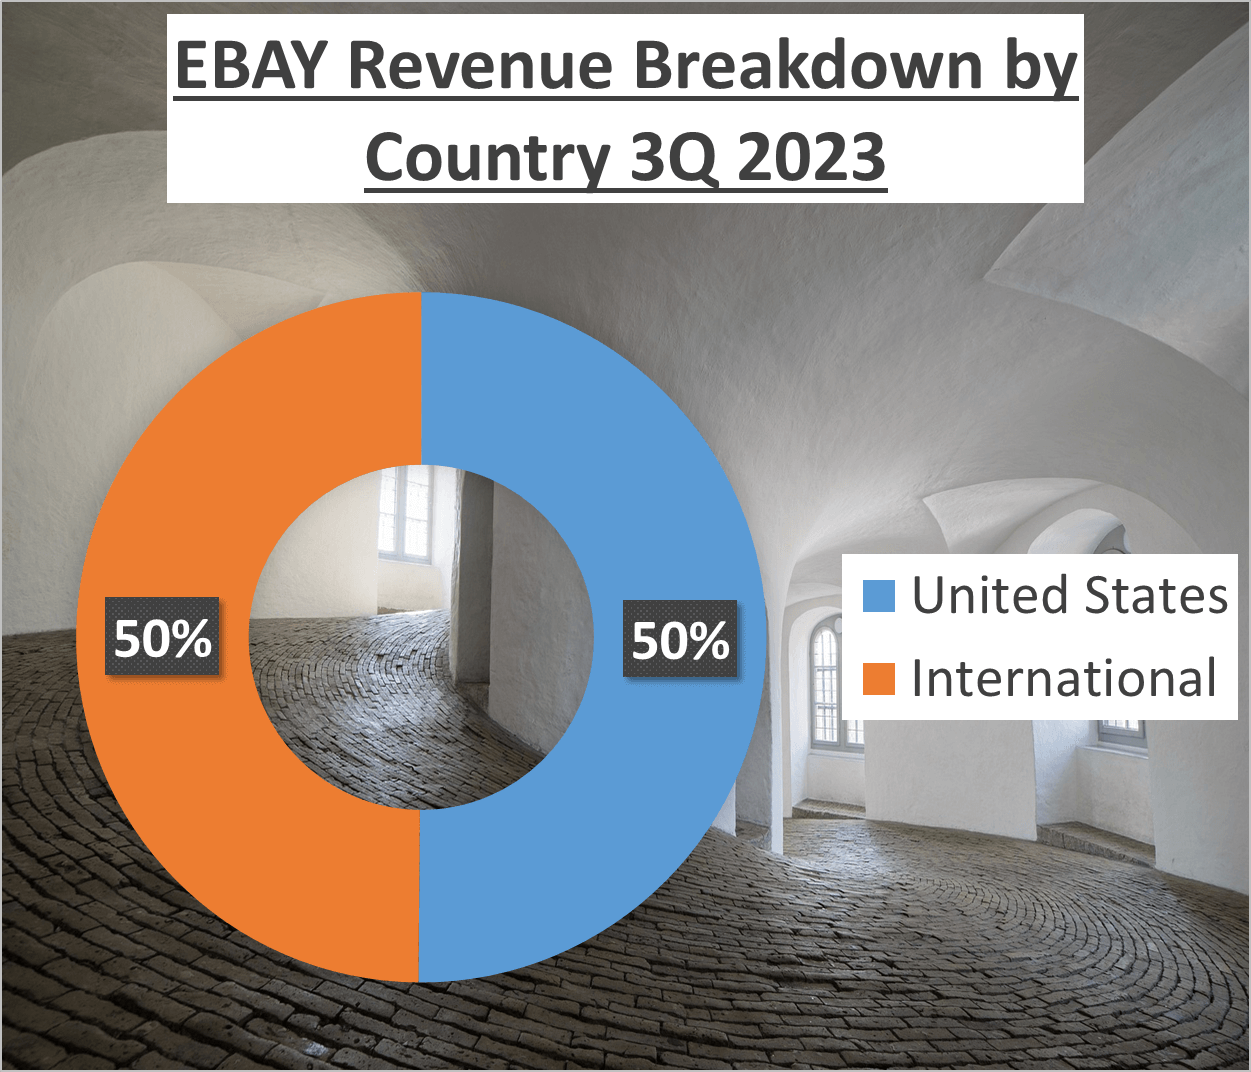
Geographically, Amazon derives 61% of its revenue from North America, 23% from international markets, and 16% from AWS. eBay, conversely, has an even split between the United States and international markets.
While Amazon’s revenues have consistently surged, eBay’s seem to have hit a plateau. This preliminary analysis sets the stage for a deeper dive into the financial health and performance of these e-commerce giants. Stay tuned for more insights in the following sections!
Profit Margins and Net Profit – Amazon vs Ebay Stock Analysis
In this segment, we’ll scrutinize the profit margins of these two e-commerce behemoths.
Let’s begin with the Gross Profit Margin. Amazon’s Gross Profit Margin in Q3 2023 stood at 52%, a noteworthy uptick from its five-year average of 46%. Conversely, eBay recorded a Gross Profit Margin of 72% in the same quarter, marginally lower than its five-year average of 76%.
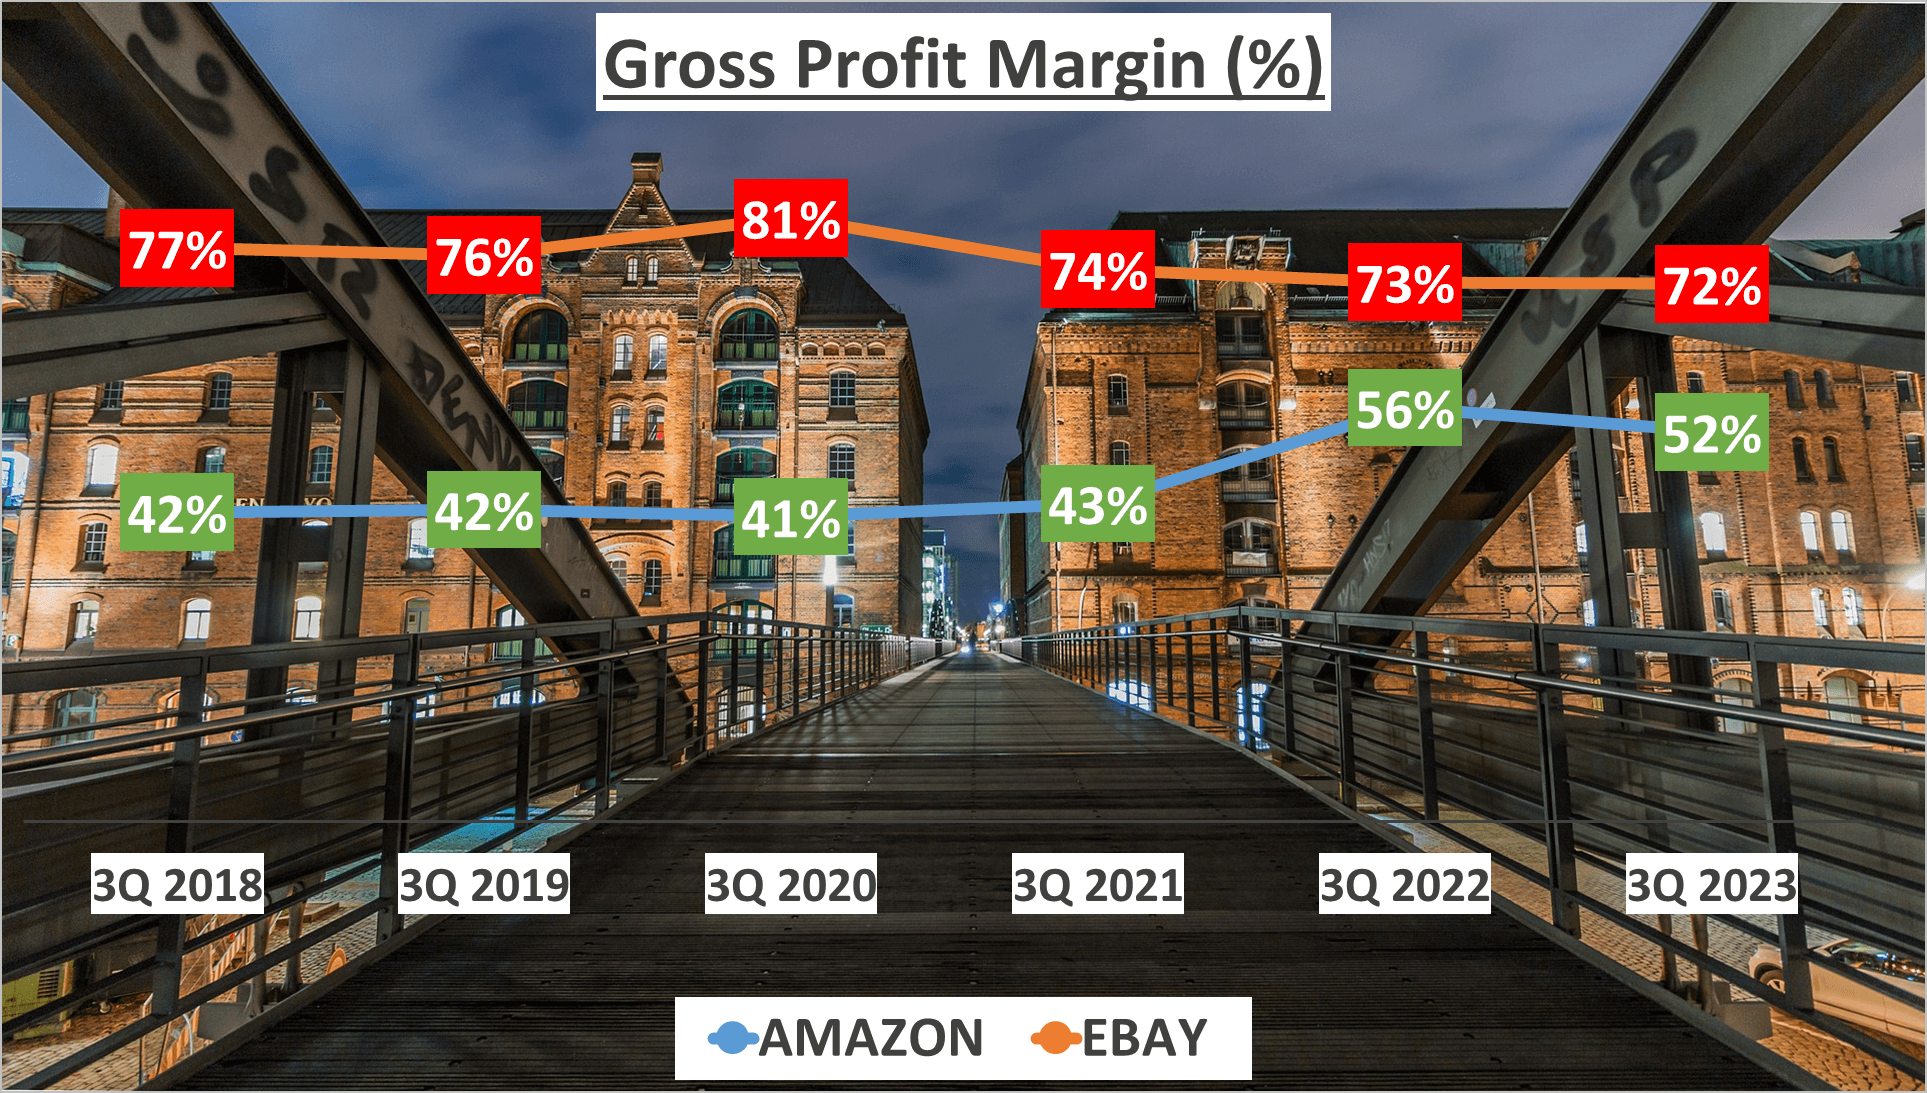
While Amazon’s Gross Profit Margin has been on an upward trajectory, eBay’s has experienced a slight downturn. A higher Gross Profit Margin signifies greater efficiency in converting raw materials and labor into finished goods.
Now, let’s delve into the Net Profit Margin. Amazon’s Net Profit Margin in Q3 2023 was 5%, a marginal increase from its five-year average of 4%. In contrast, eBay’s Net Profit Margin was notably higher at 26%, although this marks a sharp decline from its five-year average of 44%.
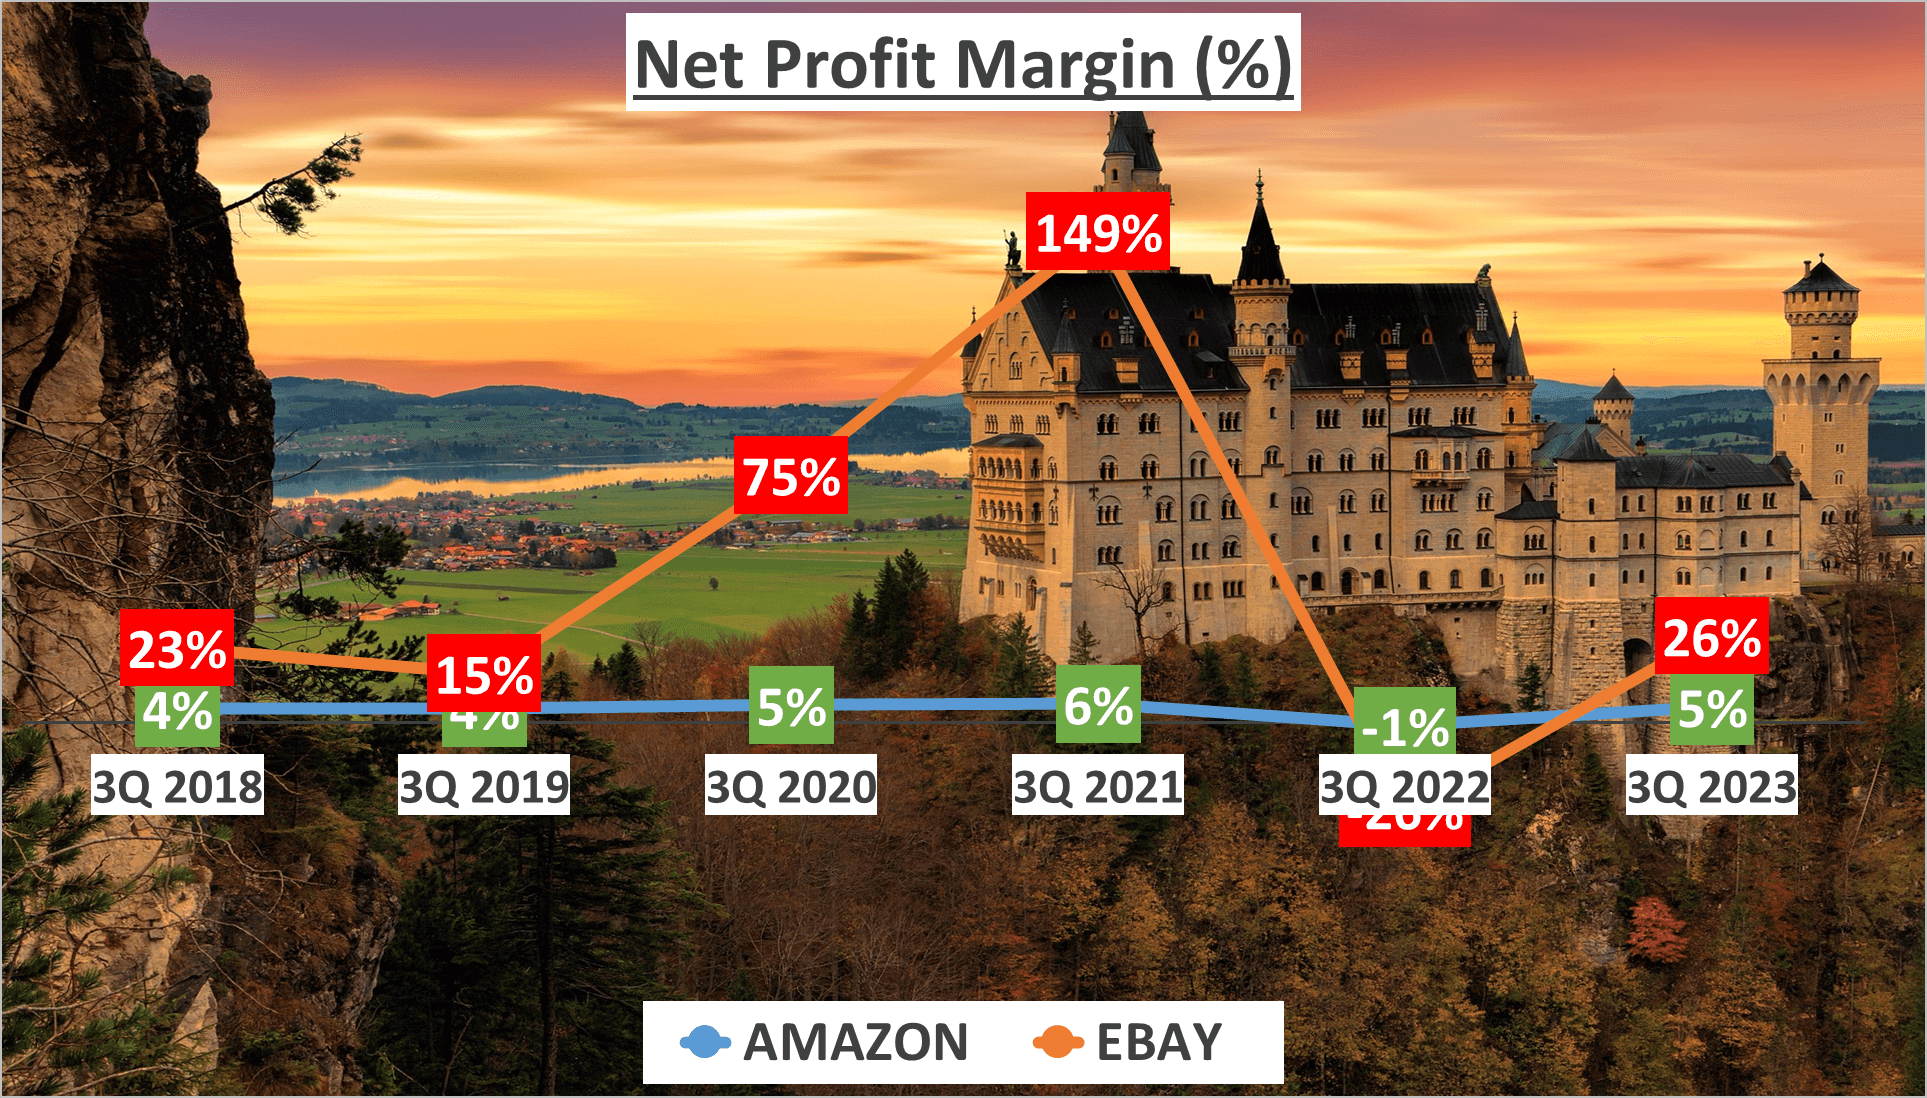
The significance of Net Profit Margin lies in its portrayal of the percentage of revenue left after deducting all expenses, interest, and taxes. It essentially quantifies how much of every dollar earned translates into pure profit.
Now, let’s analyze the net profits of both companies. In Q3 2023, Amazon’s net profit amounted to $19.8B, a substantial surge from the same period in 2018. eBay, on the other hand, reported a net profit of $2B in the same quarter, showcasing more modest growth.
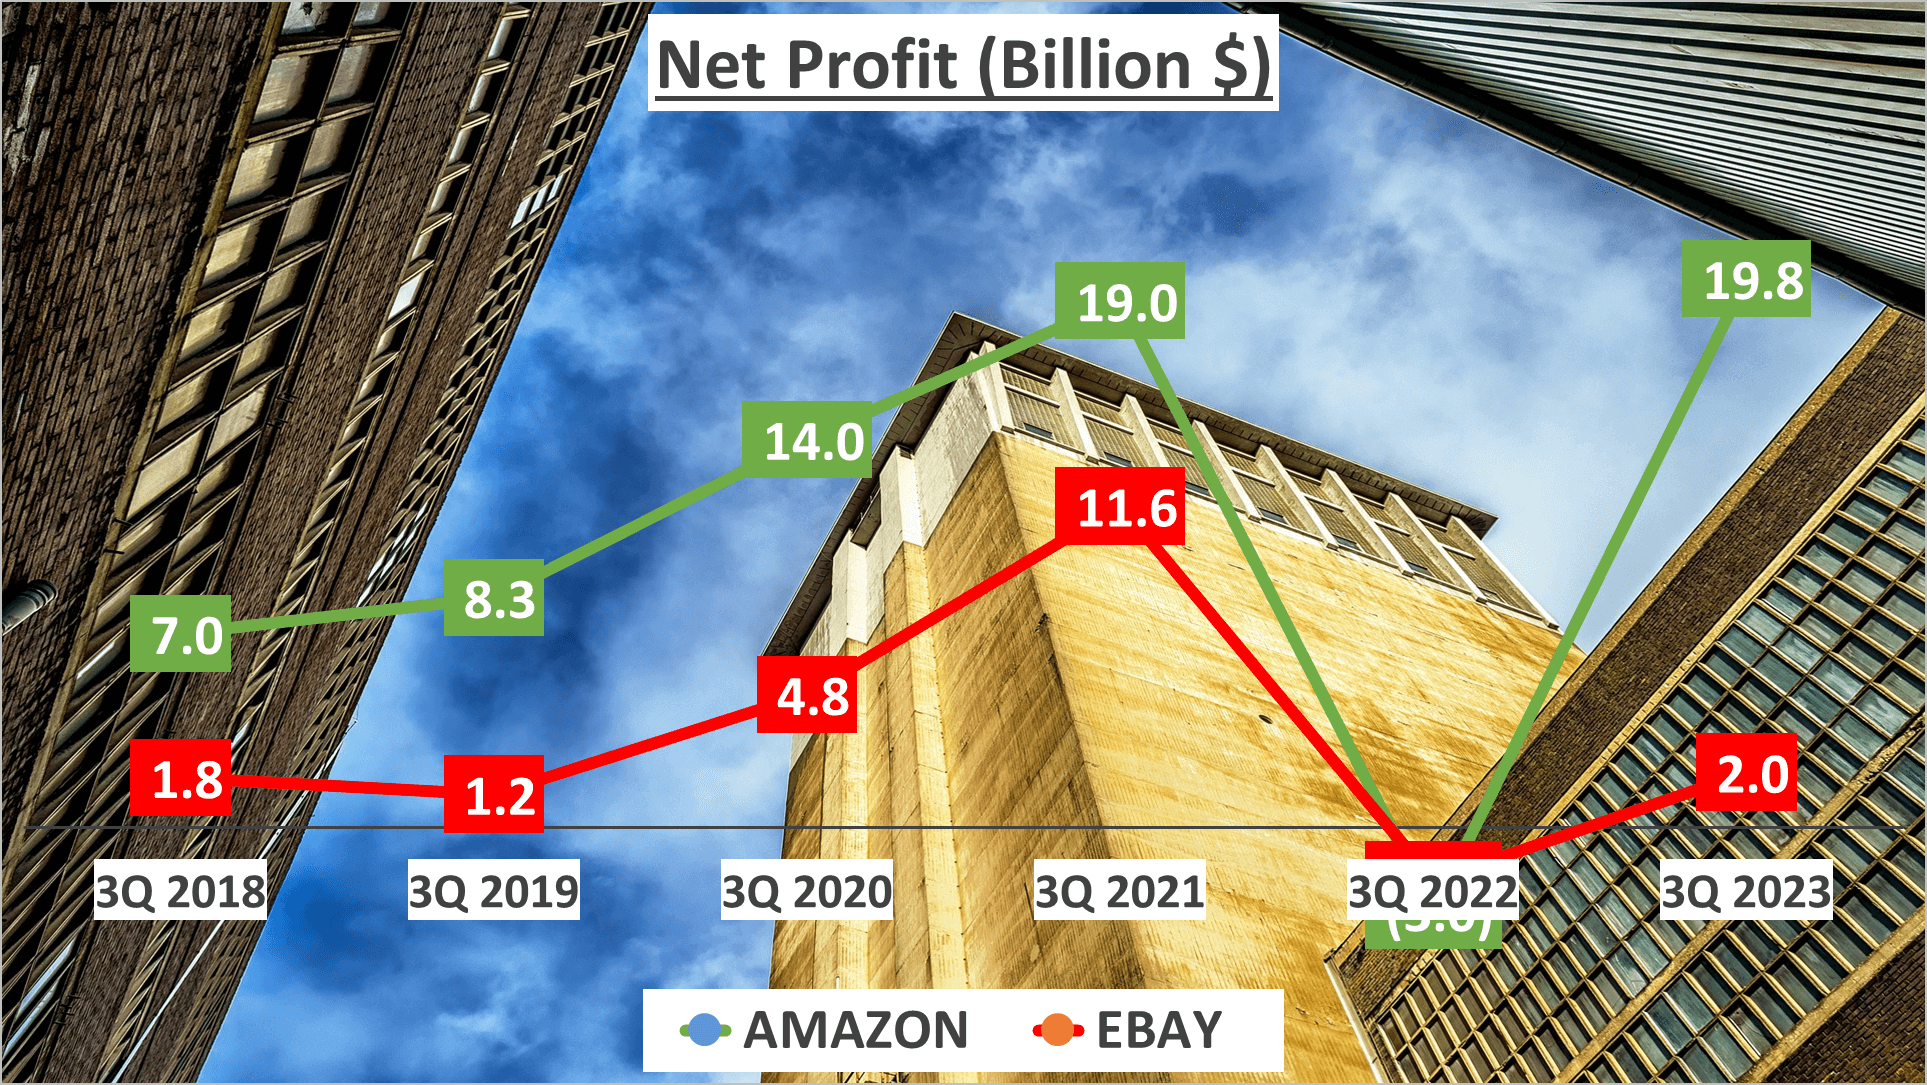
While Amazon’s net profit has exhibited rapid growth, eBay boasts a significantly higher net profit margin. This suggests that eBay excels in converting sales into tangible profit, despite its lower total revenue.
Despite its higher Gross Profit Margin, eBay has witnessed a decline in its net profit margin over the years.
Assets and Liquidity – Amazon vs Ebay Stock Analysis
Let’s delve into the assets and liquidity of Amazon and eBay.
Starting with total assets, as of Q3 2023, Amazon’s assets soared to $487B, towering over eBay’s modest $21B.
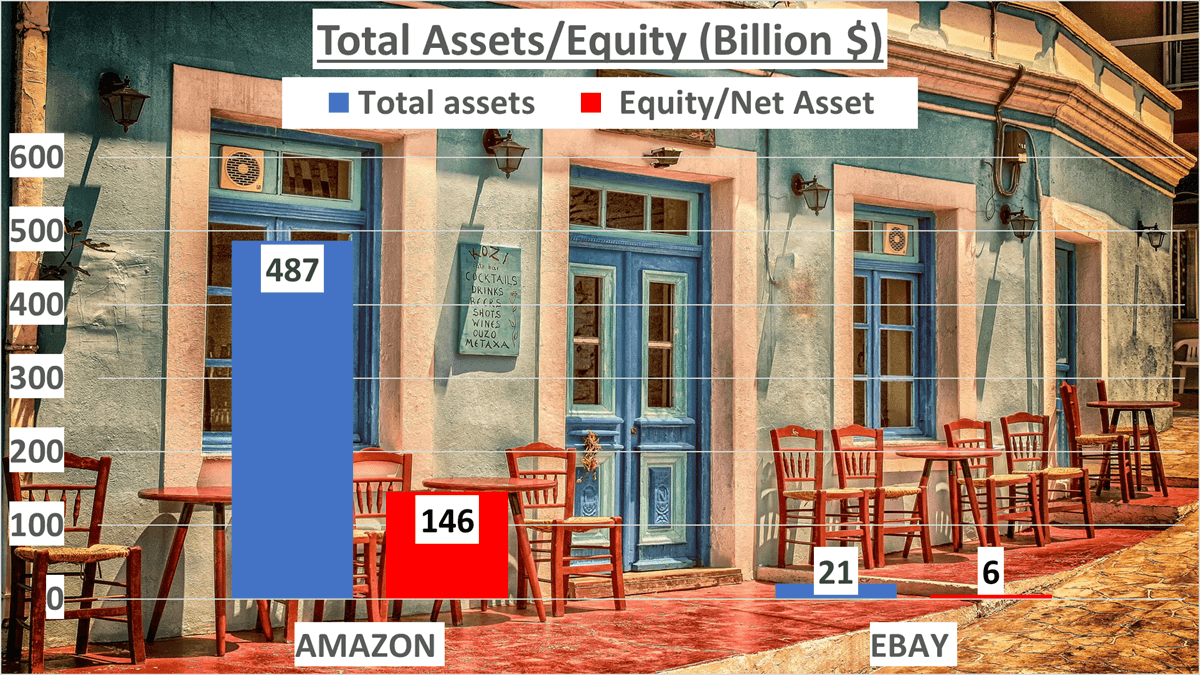
Digging deeper, Amazon’s net assets totaled $146B, while eBay’s amounted to $6B. Quite a contrast, isn’t it?
Now, onto equity. The equity-to-total-assets ratio unveils a company’s financial leverage. Amazon boasts a ratio of 30%, slightly surpassing eBay’s 28%.
Shifting focus to liquidity, a crucial aspect of a company’s financial health, we assess two key ratios: the current ratio and the quick ratio.
The current ratio, indicating short-term financial health, stood at 0.98 for Amazon and a robust 2.16 for eBay as of Q3 2023.
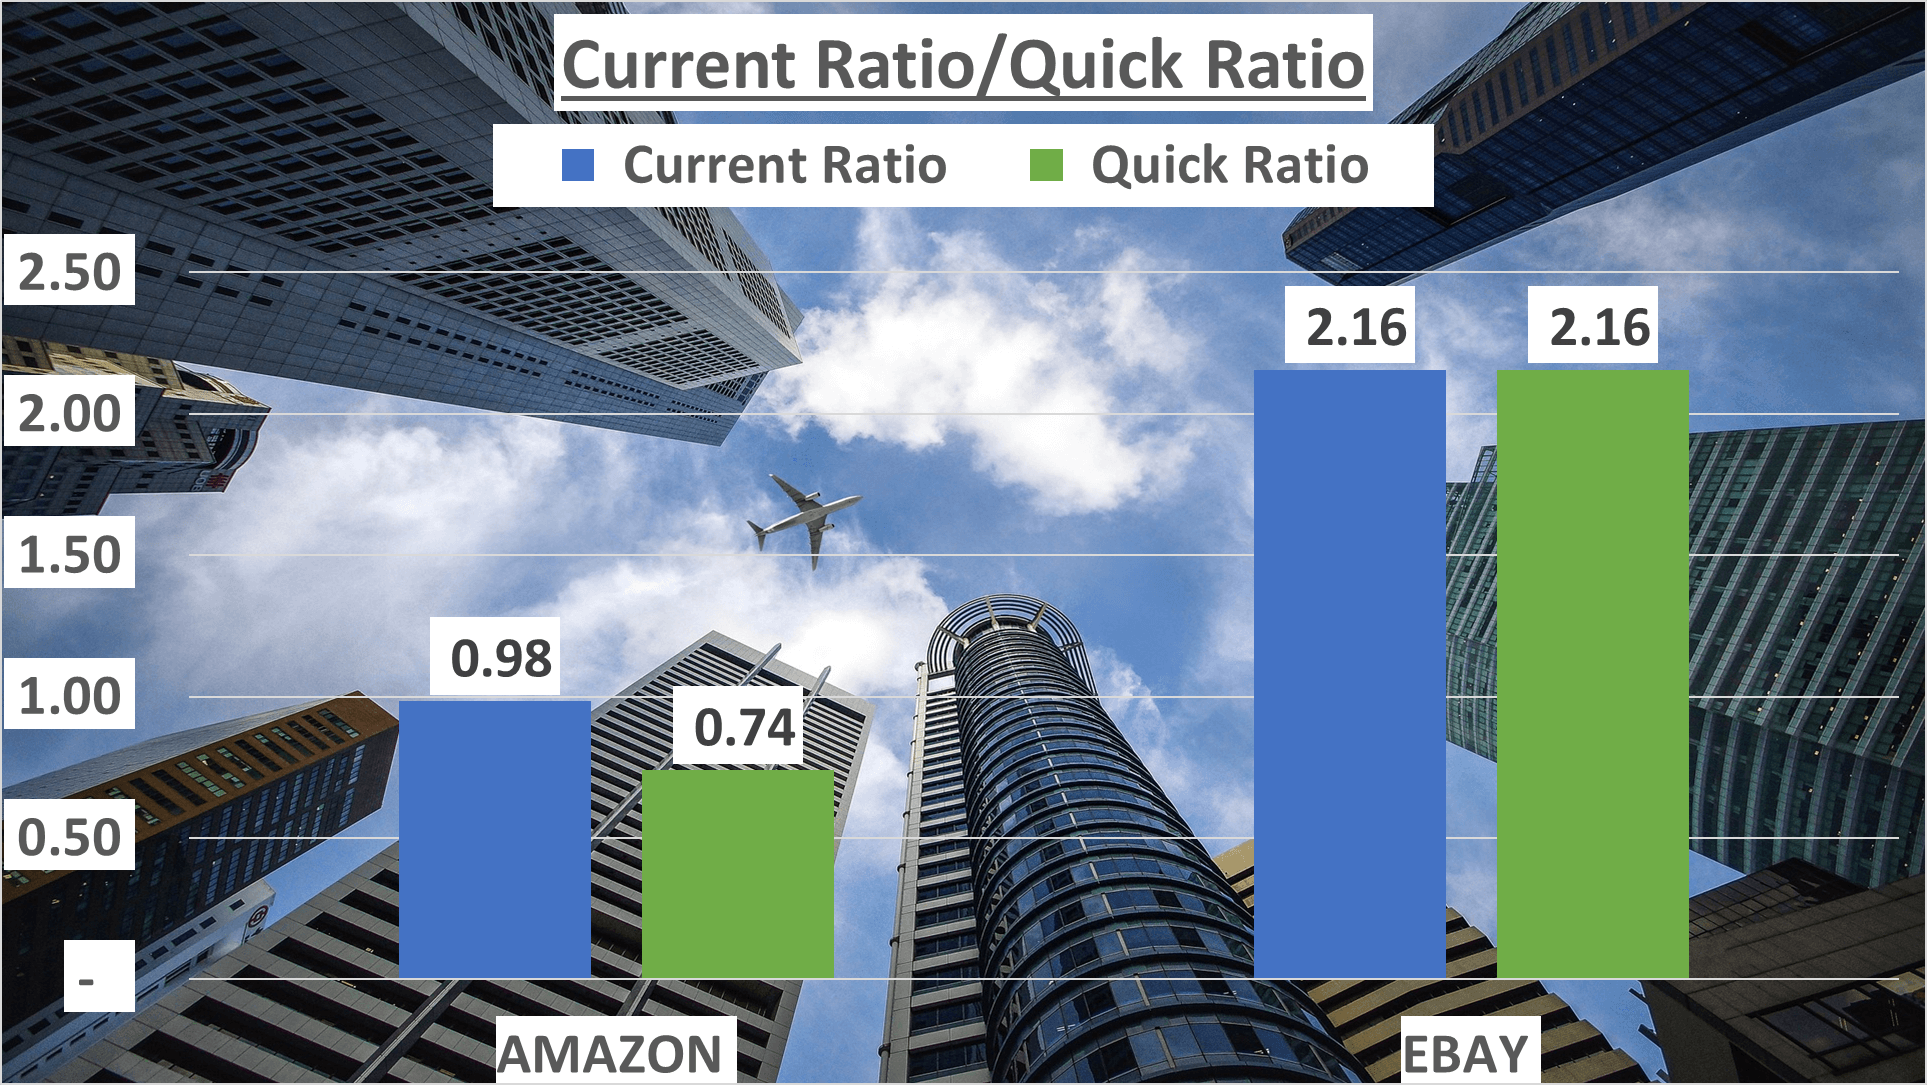
For a stricter measure, the quick ratio excludes inventories from current assets. Amazon’s quick ratio was 0.74, lower than eBay’s impressive 2.16.
What does this imply? While Amazon flaunts a substantial asset base, eBay demonstrates superior liquidity prowess. This positions eBay as better equipped to meet short-term financial obligations, a pivotal consideration for investors.
In summary, eBay outshines Amazon in terms of liquidity capabilities.
Operational Efficiency and Cash Flow – Amazon vs Ebay Stock Analysis
Operational efficiency is a pivotal metric in assessing company performance. Let’s dive in.
Amazon boasts a mere 49 inventory days, showcasing its extensive product range. Conversely, eBay, operating as an intermediary between buyers and sellers, maintains zero inventory days.
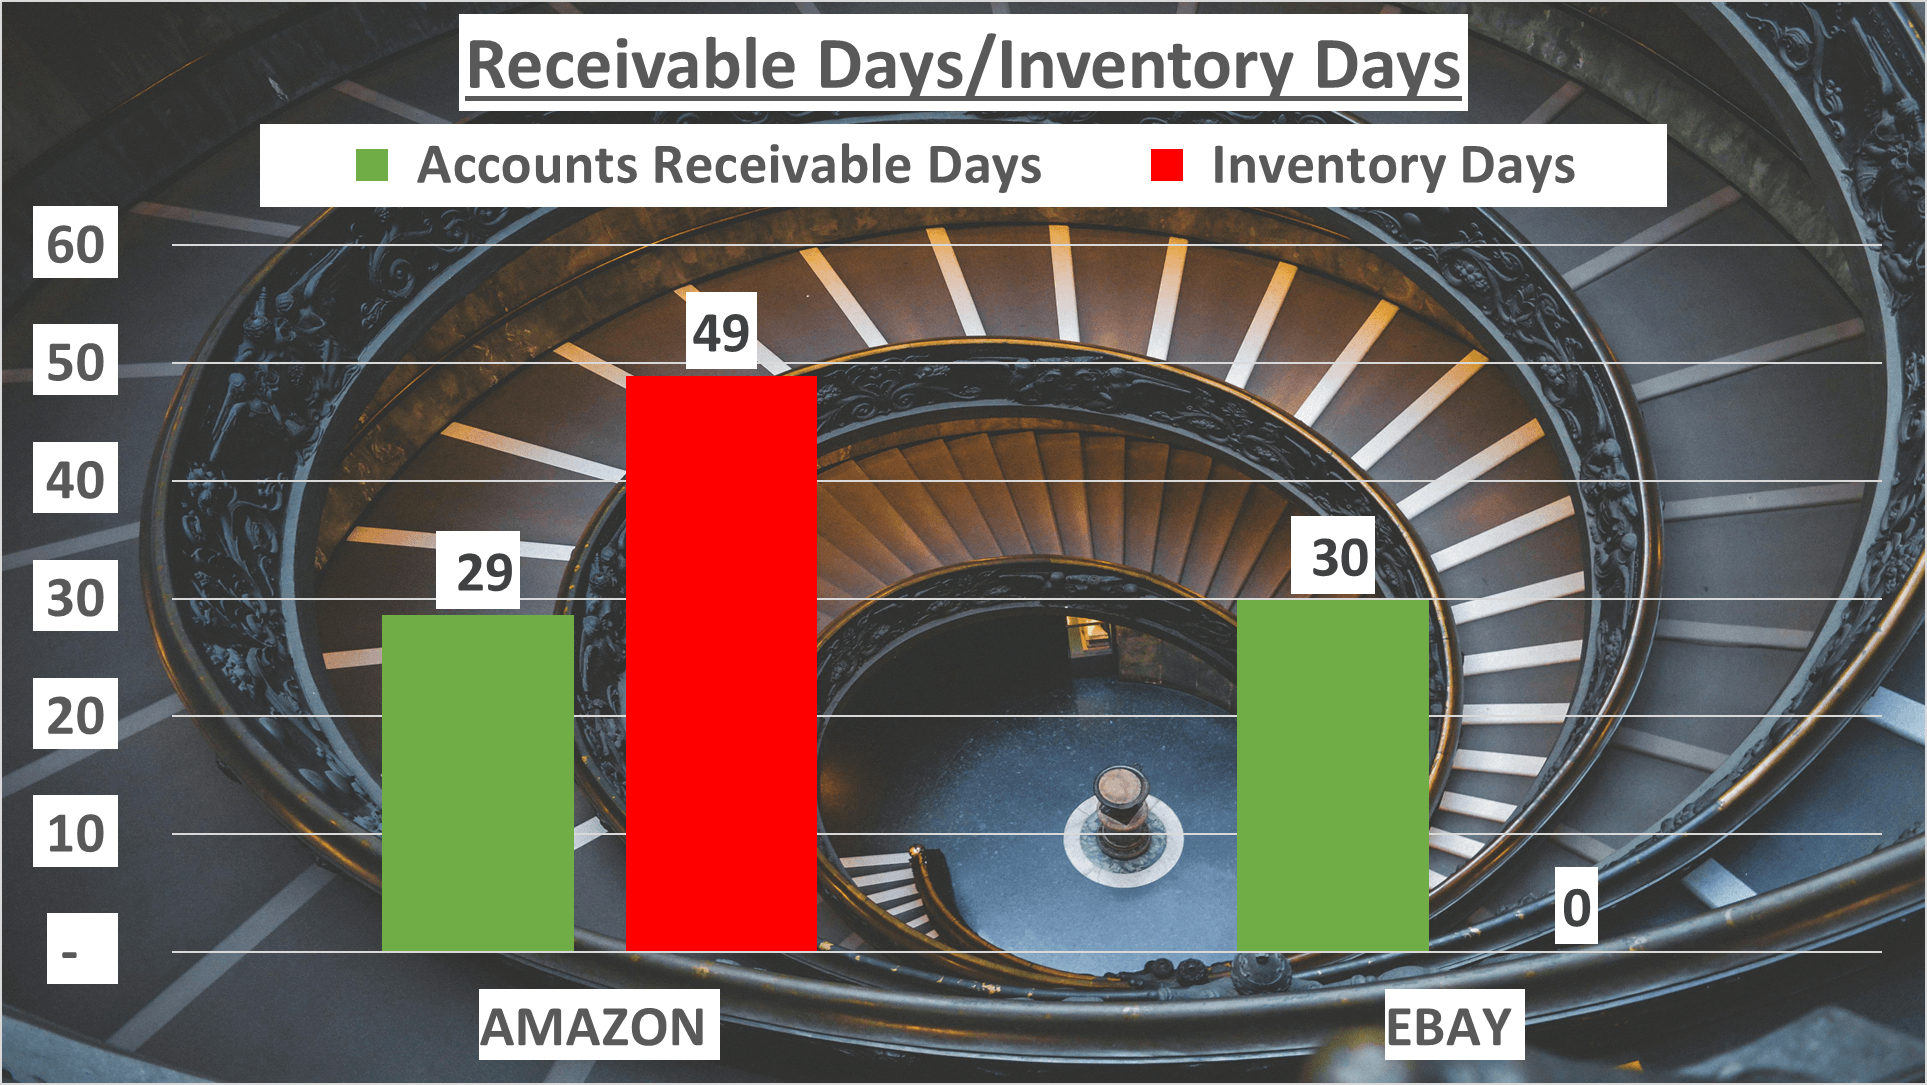
When examining accounts receivable days, a similar trend emerges. Amazon reports 29 days, slightly lower than eBay’s 30 days.
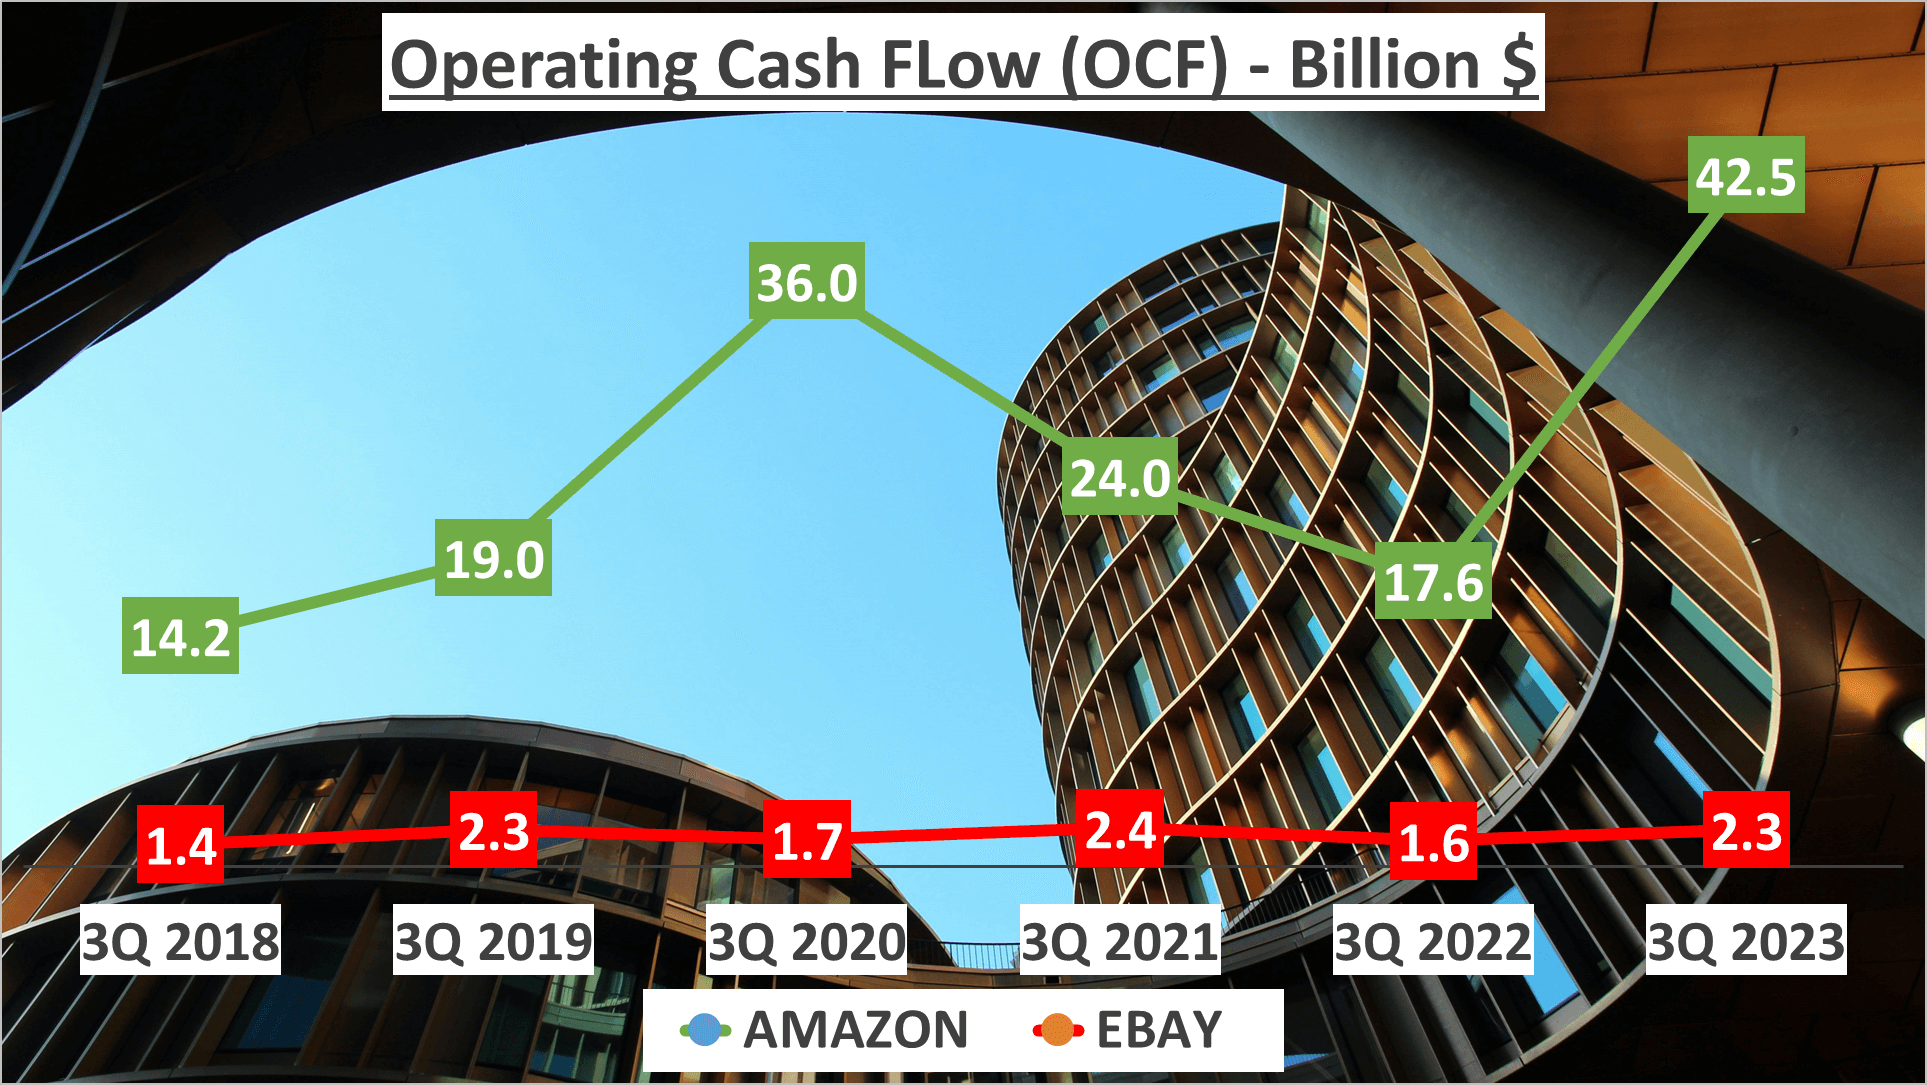
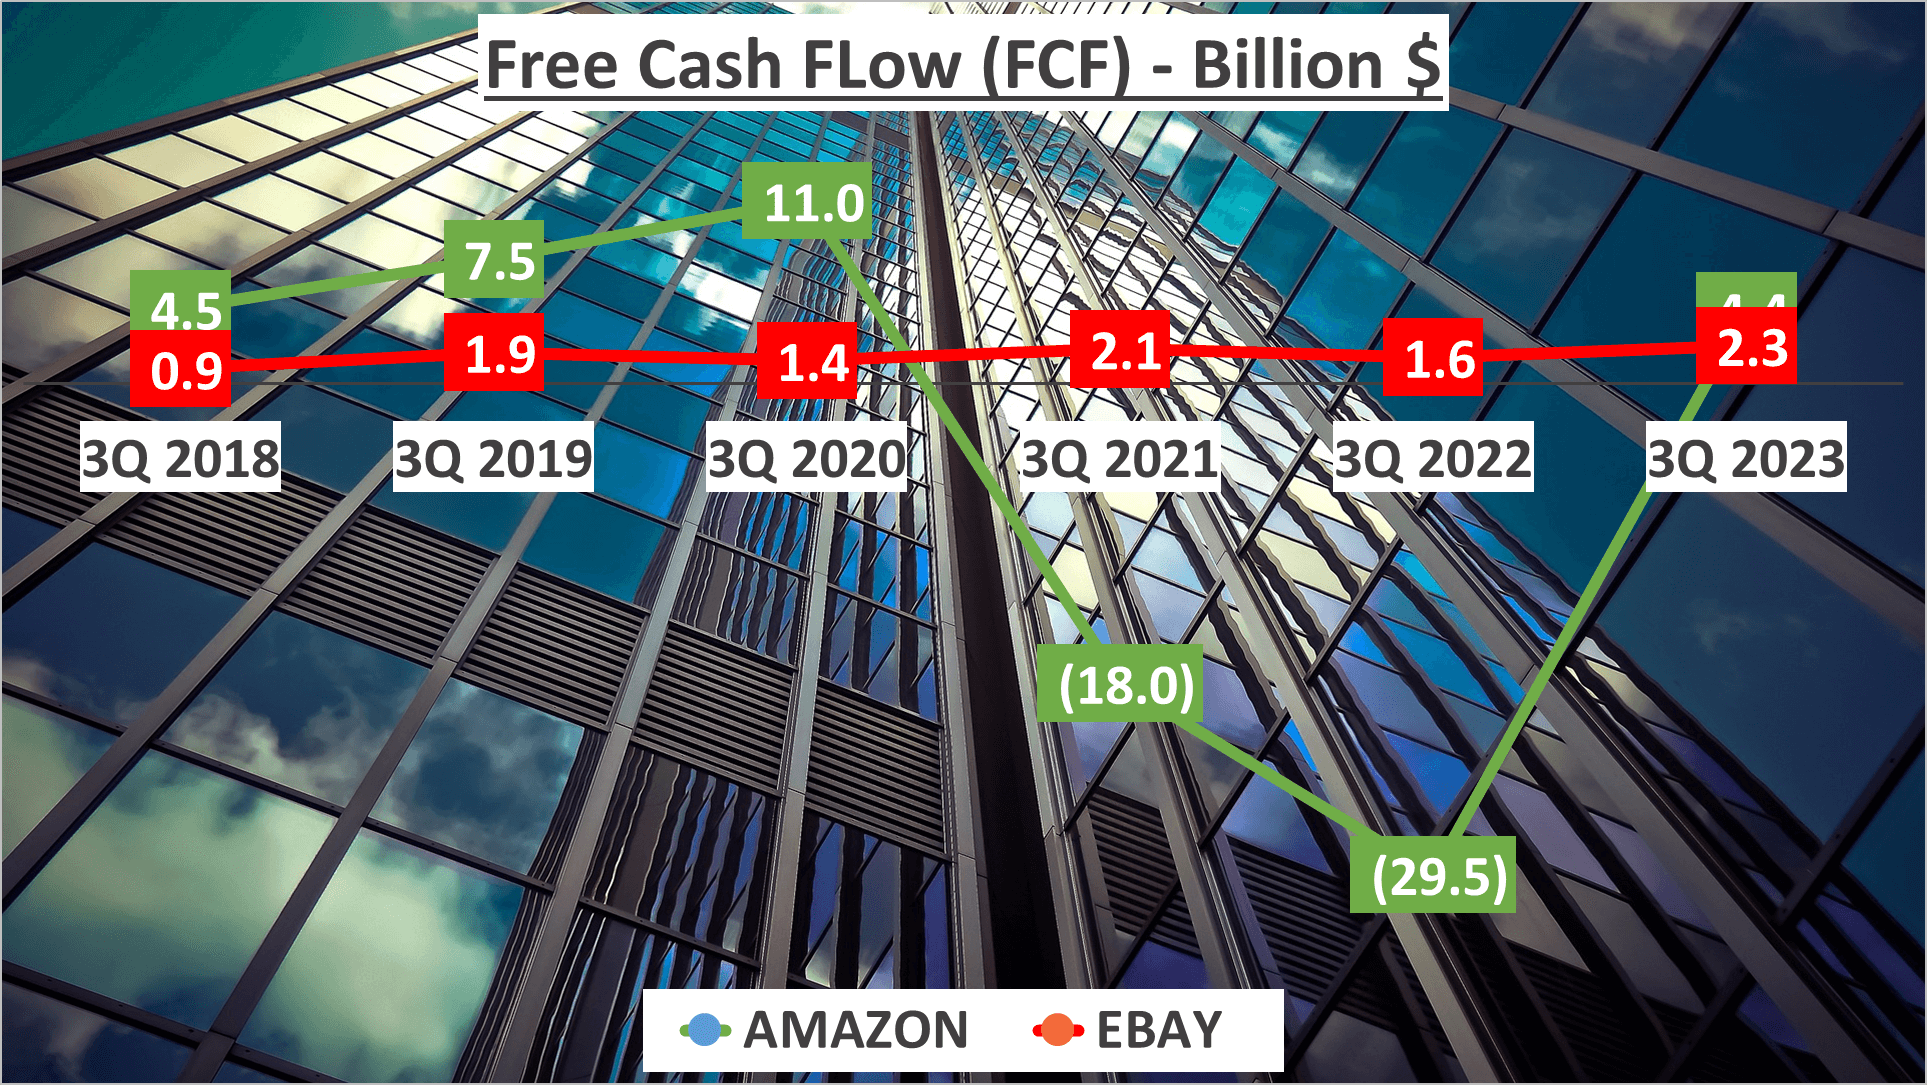
Now, onto cash flows, Amazon’s operating cash flow for Q3 2023 hit a whopping $42.5B, with a free cash flow of $4.4B. In contrast, eBay’s operating and free cash flows amounted to $2.3B.
The notable contrast between Amazon’s operating and free cash flows signifies significant investments in fixed assets.
Amazon’s substantial investment in fixed assets is evident from the variance between its Operating Cash Flow and Free Cash Flow.
Dupont Analysis – Amazon vs Ebay Stock Analysis
To gain a comprehensive insight into the performance of these companies, let’s conduct a Dupont Analysis. This analysis dissects Return on Equity (ROE) into three constituents: Net Profit Margin, Asset Turnover, and Asset-to-Equity ratio.
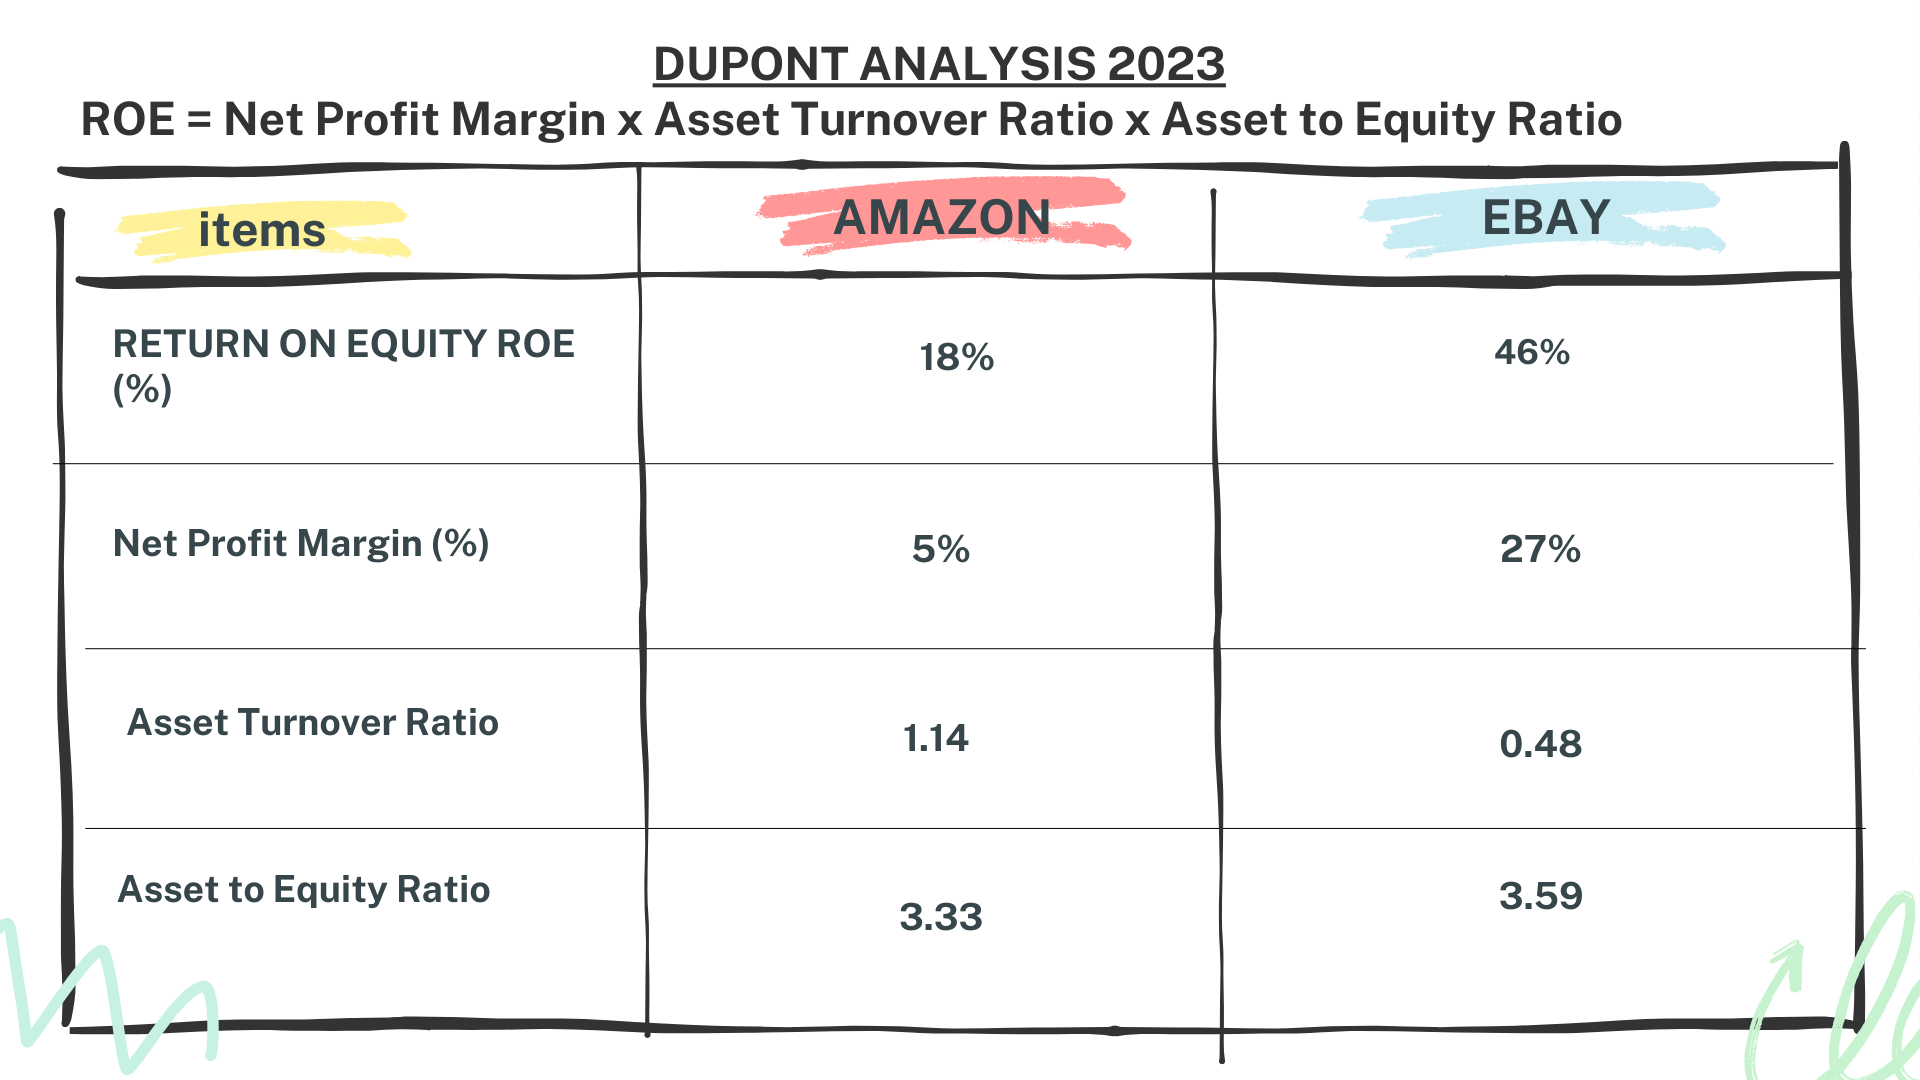
In Q3 2023, Amazon recorded an ROE of 18% with a Net Profit Margin of 5%. Its Asset Turnover stood at 1.14, and the Asset-to-Equity ratio was 3.33.
Conversely, eBay exhibited an ROE of 46%, propelled by a notably higher Net Profit Margin of 27%. While eBay’s Asset Turnover was marginally lower at 0.48, its Asset-to-Equity ratio was slightly higher at 3.59.
This analysis underscores that eBay’s superior ROE is primarily attributable to its elevated Net Profit Margin.
Author: investforcus.com
Follow us on Youtube: The Investors Community

