Amazon vs Walmart Stock Analysis – Curious about how Amazon and Walmart stack up financially? Prepare for an in-depth comparison.
In the upcoming analysis, we’ll delve into the financial landscapes of two of the United States’ foremost retail giants – Amazon and Walmart.
This scrutiny holds paramount importance for potential investors aiming to make well-informed decisions.
We’ll scrutinize crucial financial metrics including total revenues, profit margins, return on equity, and more.
Furthermore, we’ll assess their operational efficiency, cash flows, and other pivotal factors that heavily influence the financial robustness of these retail powerhouses.
By doing so, we aim to provide a comprehensive understanding of their financial standings and their potential for future growth.
So, fasten your seatbelts as we embark on a journey through the financial realms of Amazon and Walmart.
Amazon vs Walmart Stock Analysis: Revenue Comparison
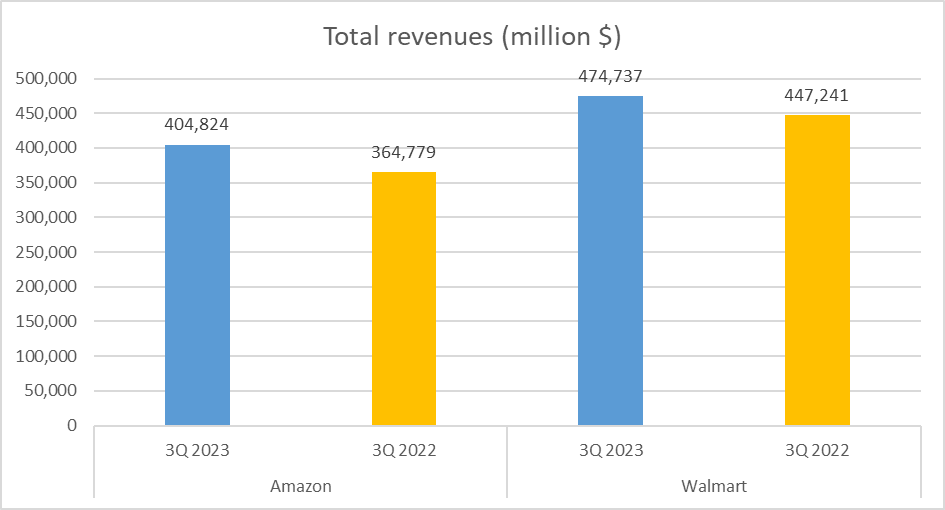
Let’s kick off with a comparison of total revenues, where the competition is neck and neck. In the final quarter of 2023, Amazon reported total revenues of $405B, while Walmart slightly outpaced with $475B.
Now, let’s dissect the composition of these revenues. Amazon’s revenue streams are diversified, with 40% from online stores, 24% from third-party seller services, 16% from AWS, and 8% from advertising services.
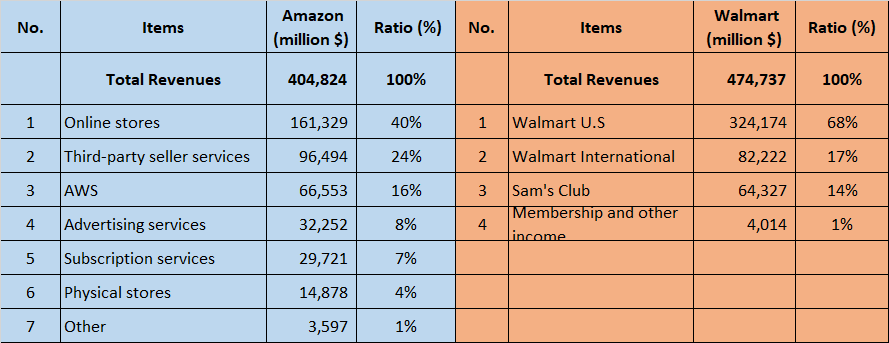
In contrast, Walmart’s revenue structure predominantly revolves around its physical stores, with 68% attributed to Walmart U.S., 17% to Walmart International, 14% to Sam’s Club, and a minor 1% from membership and other income.
These figures underscore the distinct business models of the two entities. While Walmart leads in overall revenue, Amazon’s multifaceted income streams present a compelling narrative.
Amazon vs Walmart Stock Analysis: Profitability and Returns
Transitioning to profitability, it’s not just about revenue generation, but also about maintaining a healthy bottom line. Profitability serves as a pivotal indicator of a company’s financial well-being, epitomizing its ability to exceed expenditure.
Commencing with profit margins, Amazon commands a robust gross profit margin of 52%, signifying that for every dollar in sales, 52 cents constitutes gross profit. In contrast, Walmart holds a gross profit margin of 25%, showcasing a distinct variance attributed to Amazon’s astute pricing strategy and efficient cost control.
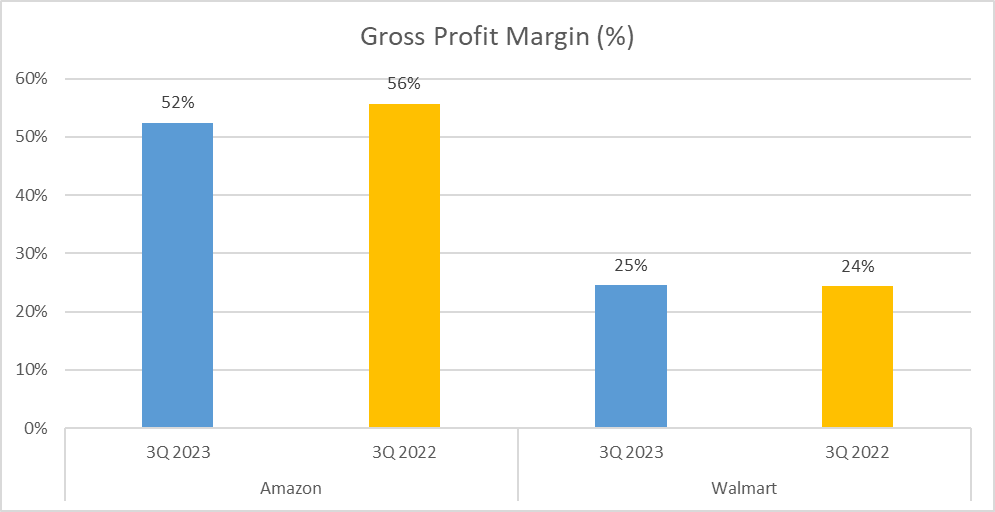
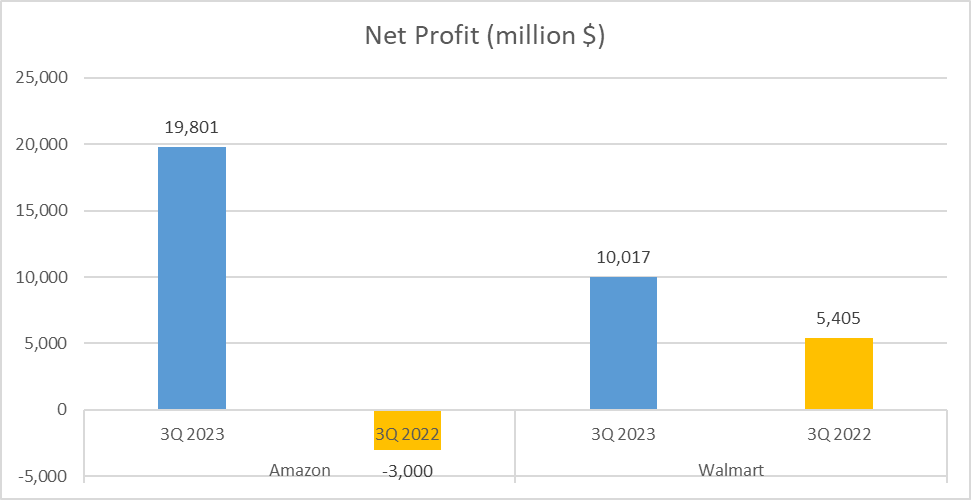
However, gross profit merely forms one facet of the narrative. Net profit, the ultimate yardstick, underscores the true financial prowess. Here, Amazon leads with a net profit of $20B, doubling Walmart’s $10B. This discrepancy extends to net profit margins, with Amazon at 5% and Walmart at 2%.
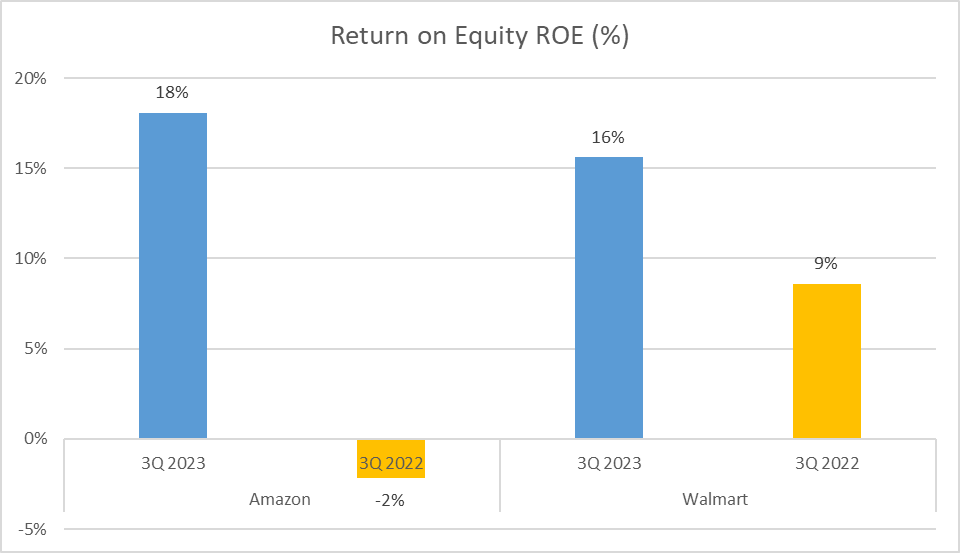
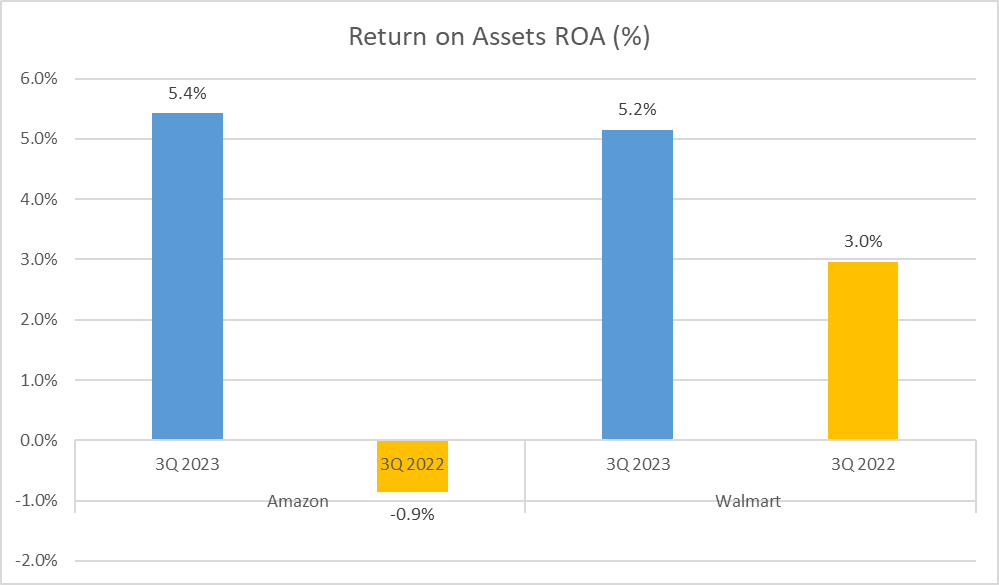
Yet, beyond absolute figures lies the essence of resource utilization efficiency, encapsulated by Return on Equity (ROE) and Return on Assets (ROA). ROE delineates a company’s adeptness in leveraging equity to yield profits, with Amazon boasting an ROE of 18%, slightly surpassing Walmart’s 16%. Conversely, ROA evaluates asset utilization efficiency, where Amazon and Walmart nearly converge, with Amazon at 5.4% and Walmart at 5.2%.
In essence, while Amazon flaunts higher profit margins, Walmart trails closely in terms of returns, indicating a fascinating equilibrium in resource efficiency. Stay tuned as we unravel further insights into the assets and liquidity ratios of these retail juggernauts.
Amazon vs Walmart Stock Analysis: Asset Analysis and Liquidity Ratios
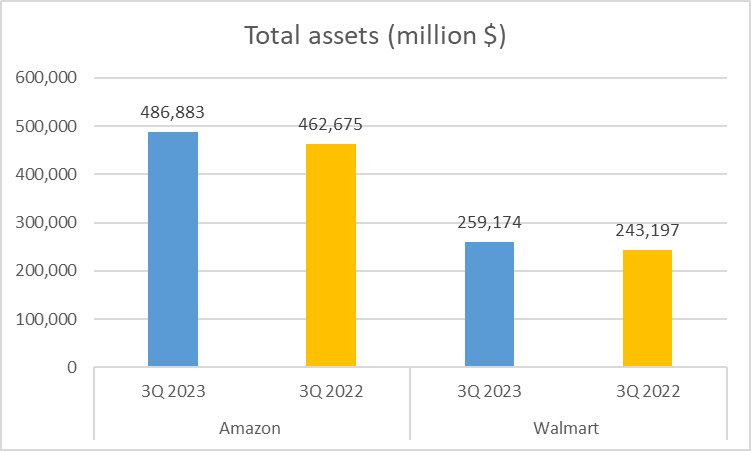
Let’s now delve into the assets and liquidity ratios of these retail giants. Firstly, let’s assess their total assets. Amazon boasts total assets worth $487B, towering over Walmart’s $259B. This underscores Amazon’s expansive scale in terms of resources and business operations.
Equity, or net assets, represents what remains after deducting a company’s liabilities from its assets, constituting shareholders’ claim on company assets. Amazon’s equity stands at $146B, while Walmart’s is at $86B.
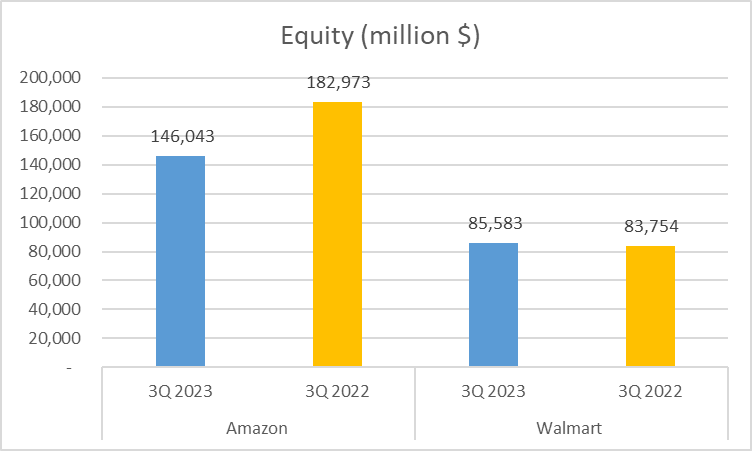
The equity to total assets ratio unveils a company’s financial leverage, portraying the proportion of assets financed by shareholders’ equity. Amazon’s ratio is at 30%, slightly trailing Walmart’s 33%, indicating potentially lower financial risk for Walmart as a larger proportion of its assets are financed by equity.
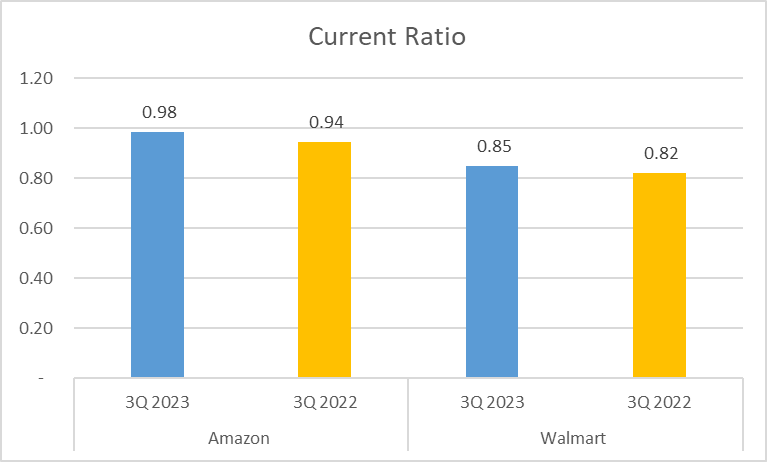
Turning to liquidity ratios, which illuminate a company’s capability to fulfill short-term obligations. Amazon’s current ratio is 0.98, marginally surpassing Walmart’s 0.85, implying Amazon’s relatively better position to settle its short-term liabilities with short-term assets.
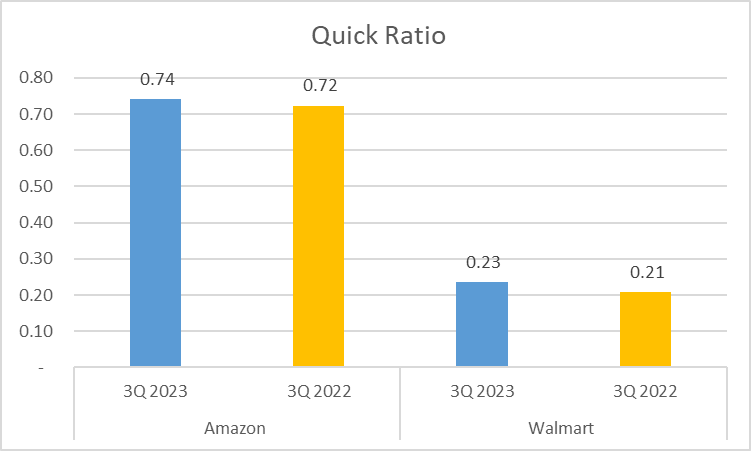
However, when examining the quick ratio, excluding inventory from current assets, the scenario alters. Amazon’s quick ratio stands at 0.74, whereas Walmart’s is notably lower at 0.23. This variance could be attributed to Walmart’s substantial investment in inventory, which isn’t as swiftly convertible to cash as other current assets.
While Amazon boasts a larger total asset base, Walmart exhibits slightly stronger liquidity. Hence, in terms of financial stability and meeting short-term obligations, both companies showcase unique strengths and weaknesses. As prudent investors, it’s imperative to weigh these factors against their overall investment strategy and risk tolerance.
Amazon vs Walmart Stock Analysis: Operational Efficiency and Cash Flows
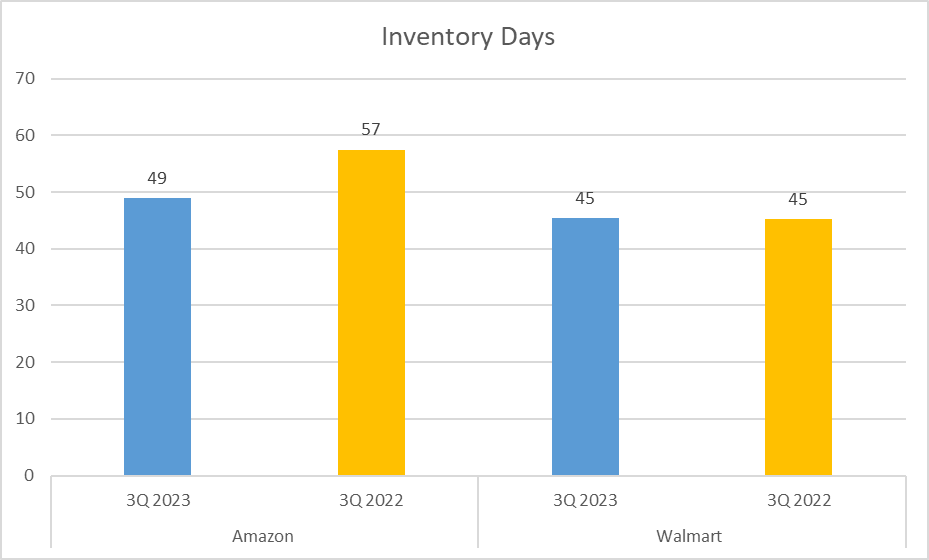
Let’s examine how efficiently these companies operate and generate cash. Inventory Days, indicating the time taken to sell inventory, stand at 49 days for Amazon and 45 for Walmart, suggesting Walmart’s slightly faster inventory turnover.
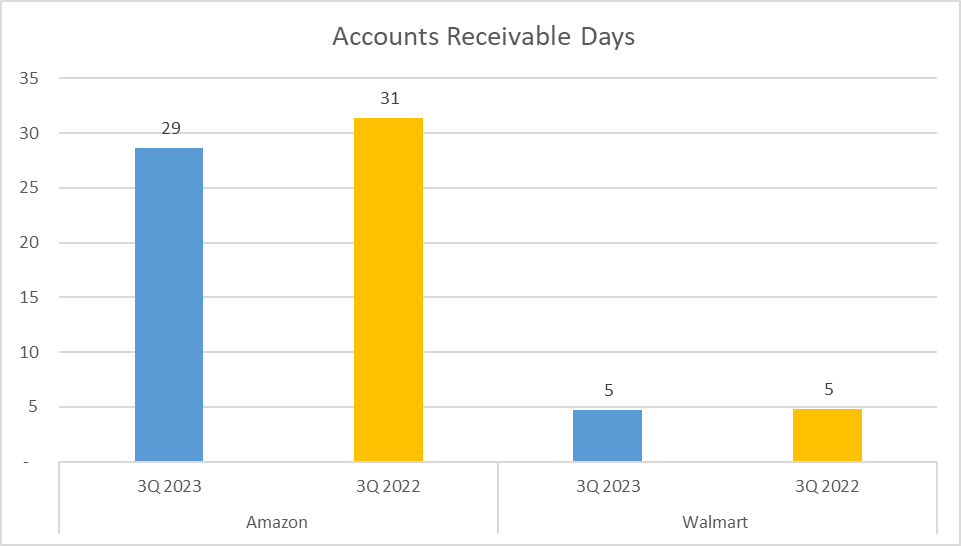
In terms of Accounts Receivable Days, reflecting the speed of payment collection, Amazon records 29 days, while Walmart impressively manages just 5 days. Clearly, Walmart demonstrates superior efficiency in this regard.
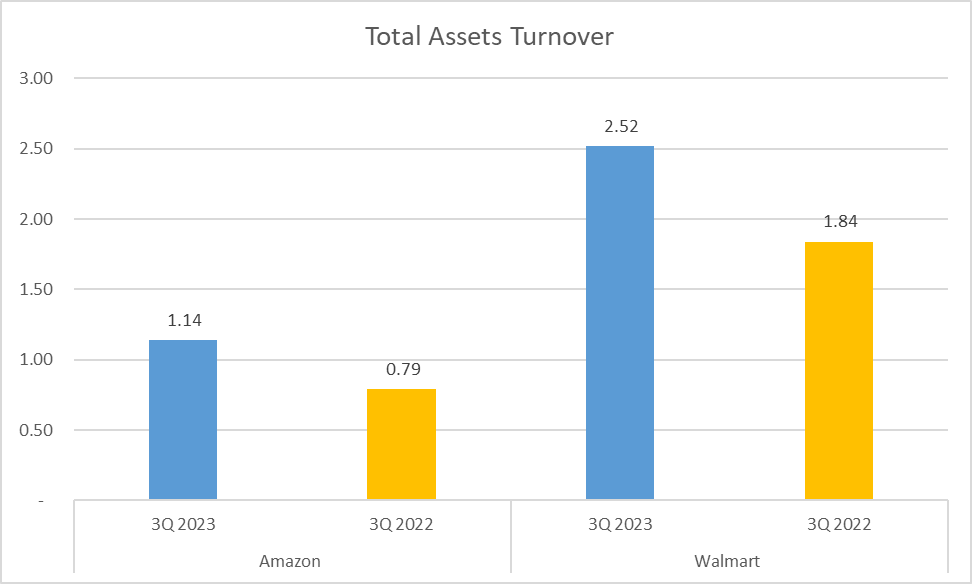
Now, considering Total Assets Turnover, measuring how effectively assets are utilized to generate sales, Amazon stands at 1.14 times, whereas Walmart impressively leads at 2.52 times.
Regarding cash flows, both companies generate substantial amounts from operations. However, the critical metric of Free Cash Flow, representing cash generated after accounting for operational support and capital asset maintenance, remains at $4B for both Amazon and Walmart.
Each company possesses strengths, with Amazon excelling in some areas and Walmart in others.
Amazon vs Walmart Stock Analysis: Conclusion
In summary, both Amazon and Walmart exhibit distinct financial attributes. Amazon reported total revenue of $405 billion at the end of the third quarter in 2023, boasting a gross profit margin of 52% and a net profit of $20 billion. In contrast, Walmart’s total revenue stood at $475 billion, with a gross profit margin of 25% and a net profit of $10 billion.

Regarding assets and liquidity, Amazon holds total assets of $487 billion, whereas Walmart’s total assets amount to $259 billion. Operational efficiency and cash flow also display variations between the two companies.
Understanding these financial intricacies is imperative for making sound investment decisions. Remember, the most informed investor is the wisest investor. Thank you for joining us on this financial journey through Amazon and Walmart.
Author: investforcus.com
Follow us on Youtube: The Investors Community

