AMC Stock Analysis – Have you ever pondered the outcome of investing $1000 in AMC back in 2018? Fast forward to March 2024, and that investment would now be valued at only $35, marking a staggering 97% decline from the initial investment.

What factors could have precipitated such a significant downturn? Was it attributed to inadequate financial management, unfavorable market conditions, or other unforeseen circumstances? To unravel the mystery behind this dramatic decline, let’s embark on a comprehensive financial analysis of AMC.
Revenue Analysis – AMC Stock Analysis
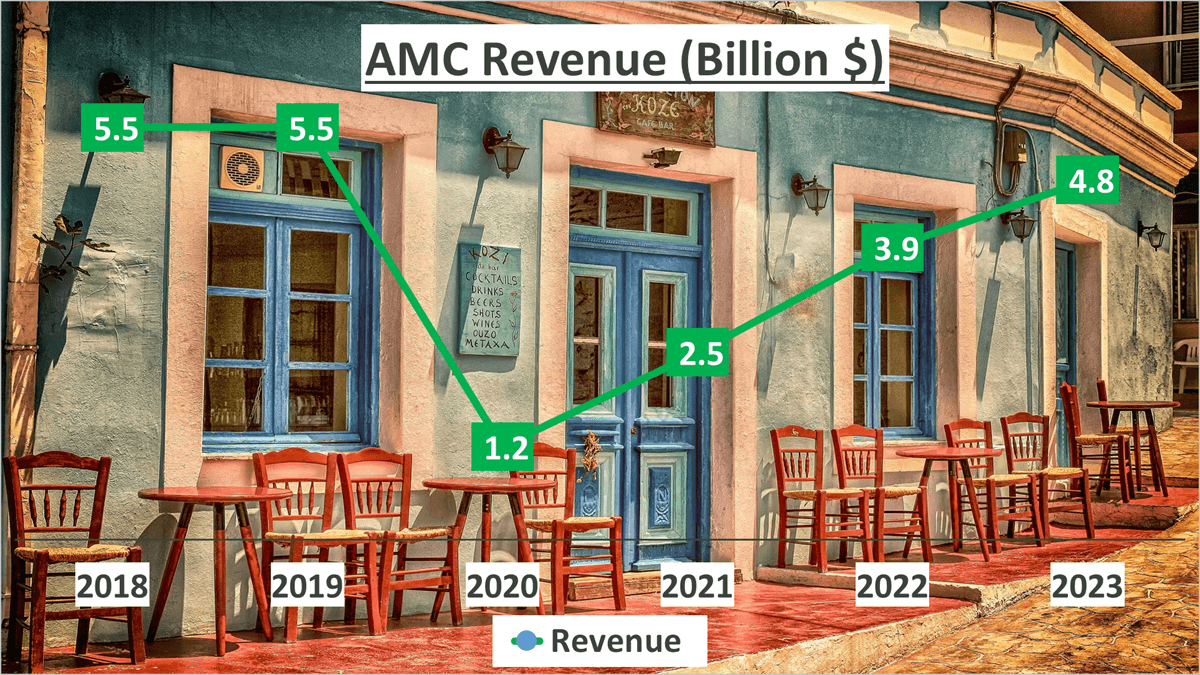
Let’s delve into AMC’s revenue trajectory. From 2018 to 2023, the company experienced fluctuating revenue patterns, resembling a roller coaster ride.
Between 2018 and 2019, revenue remained stagnant, showing no growth. However, 2020 witnessed a sharp decline with a negative growth rate of 77%, primarily attributed to the global pandemic.
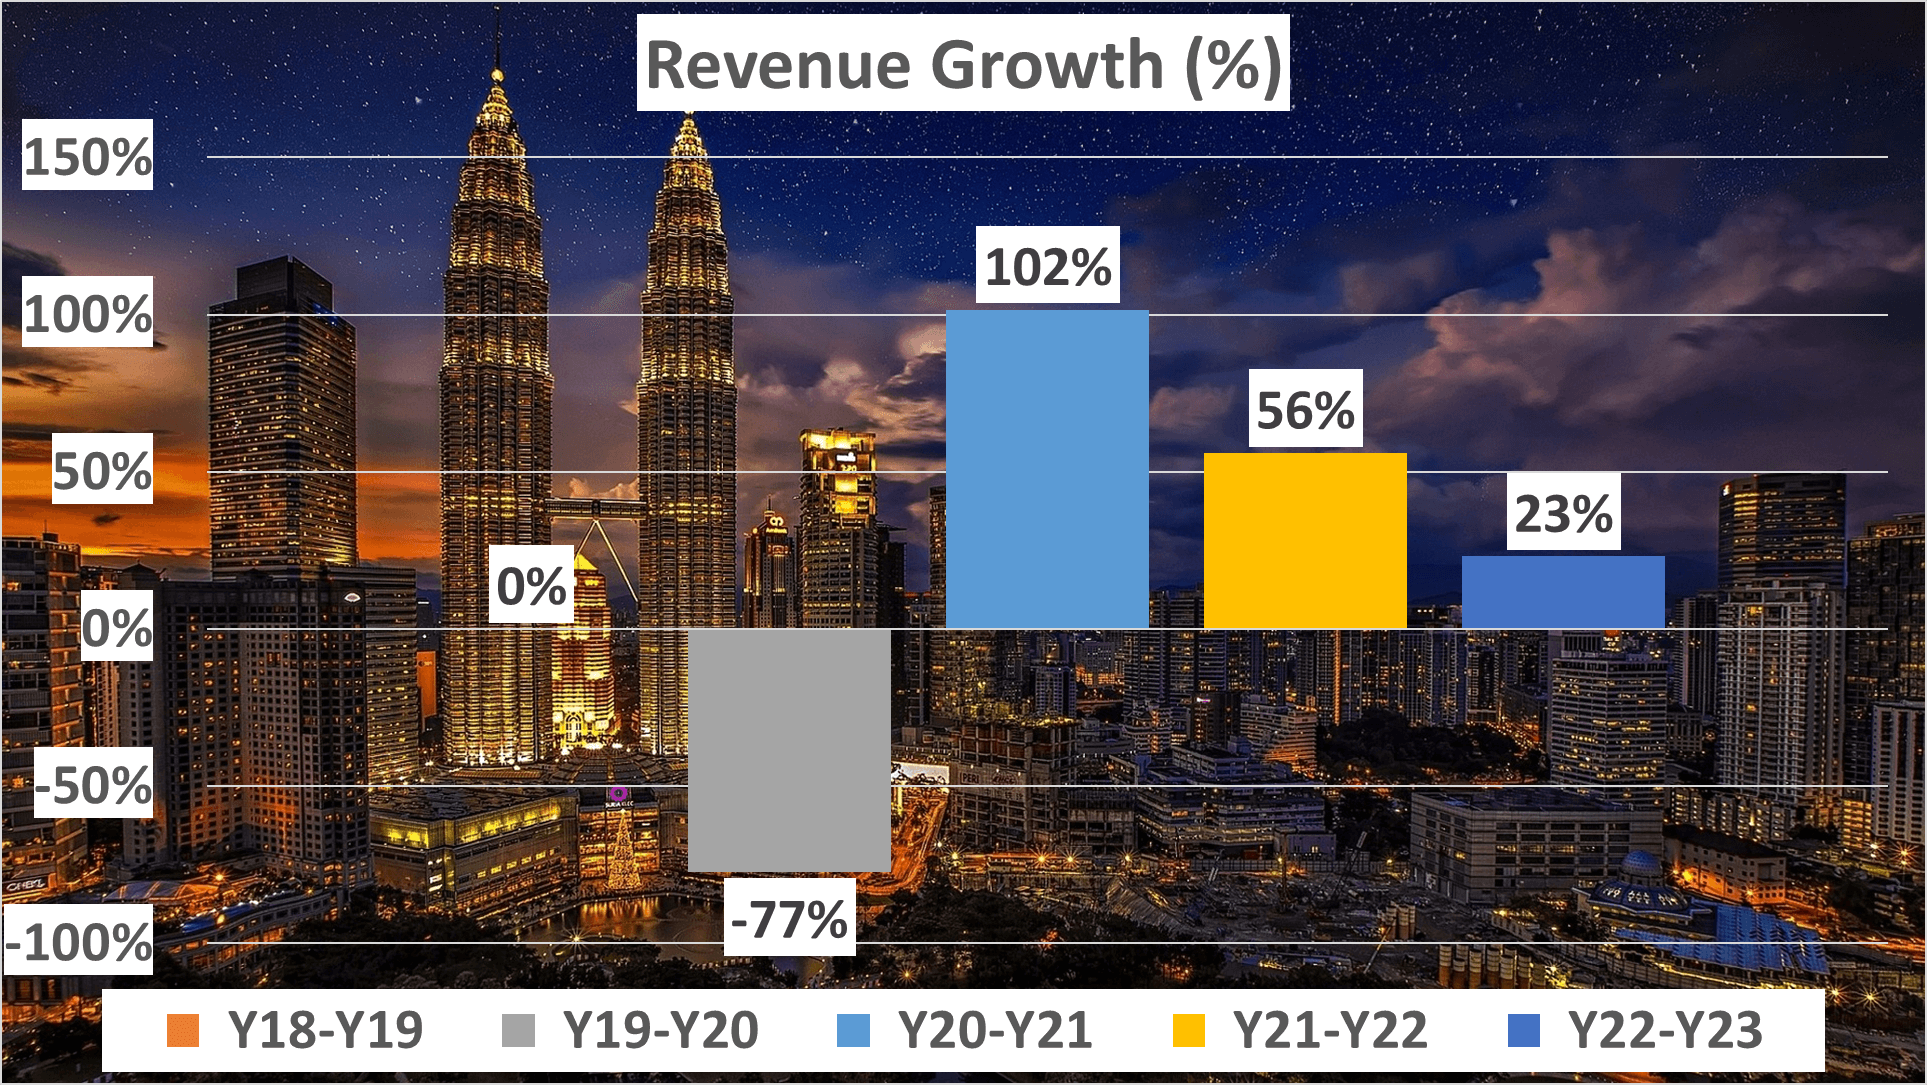
Encouragingly, revenue rebounded in 2021, boasting a growth rate of 102%. This upward momentum persisted into 2022 and 2023, with growth rates of 56% and 23% respectively.
Despite these positive trends, AMC’s 2023 revenue of $4.8B still falls short of pre-2020 levels, which peaked at $5.5B, indicating that the company has yet to fully recover from the pandemic’s impact.
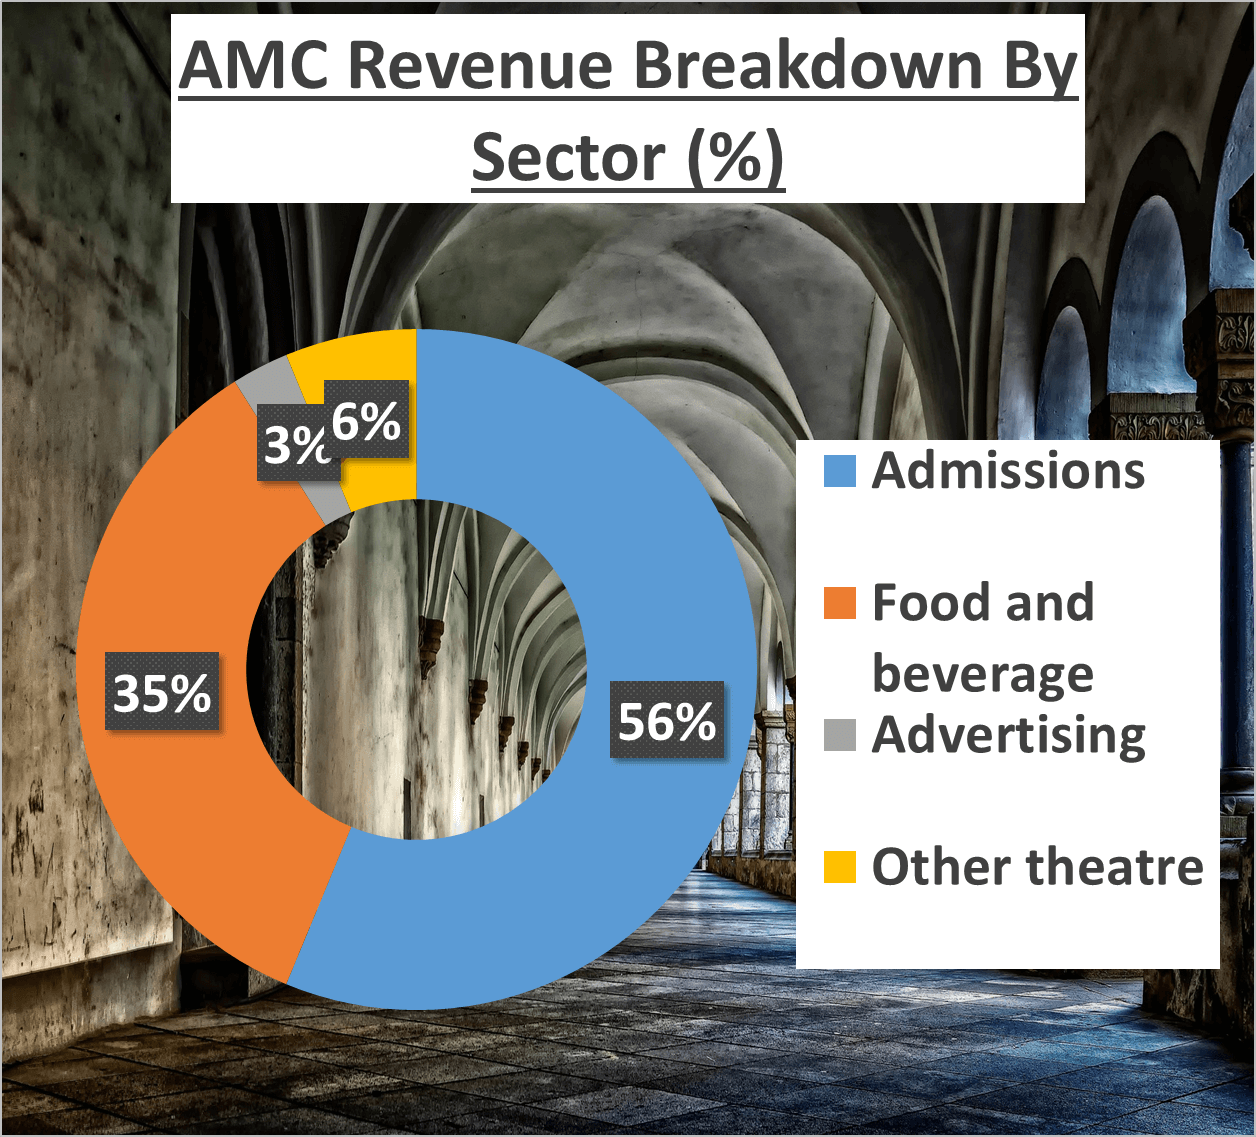
Now, let’s dissect the revenue by segments. In 2023, admissions contributed 56% to revenue, followed by food and beverages at 35%, advertising at 3%, and other theatre activities at 6%, highlighting the significant contribution of theatre-related revenue streams.
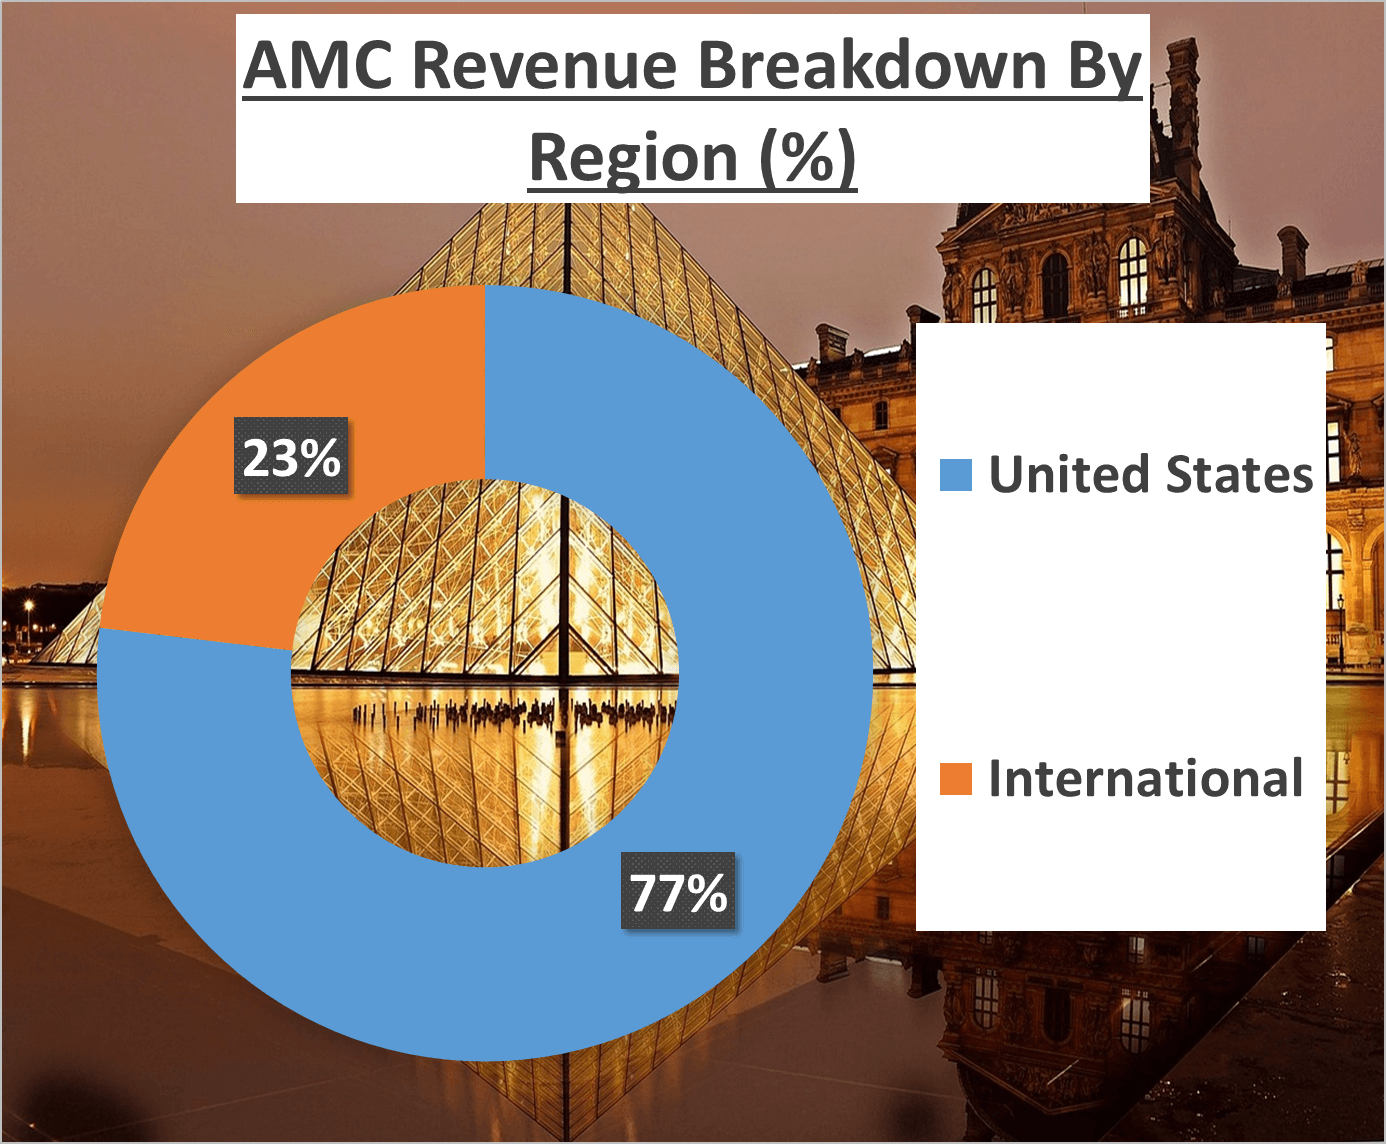
Geographically, 77% of revenue stemmed from the United States, with the remaining 23% originating from international markets, emphasizing AMC’s strong presence in the US market.
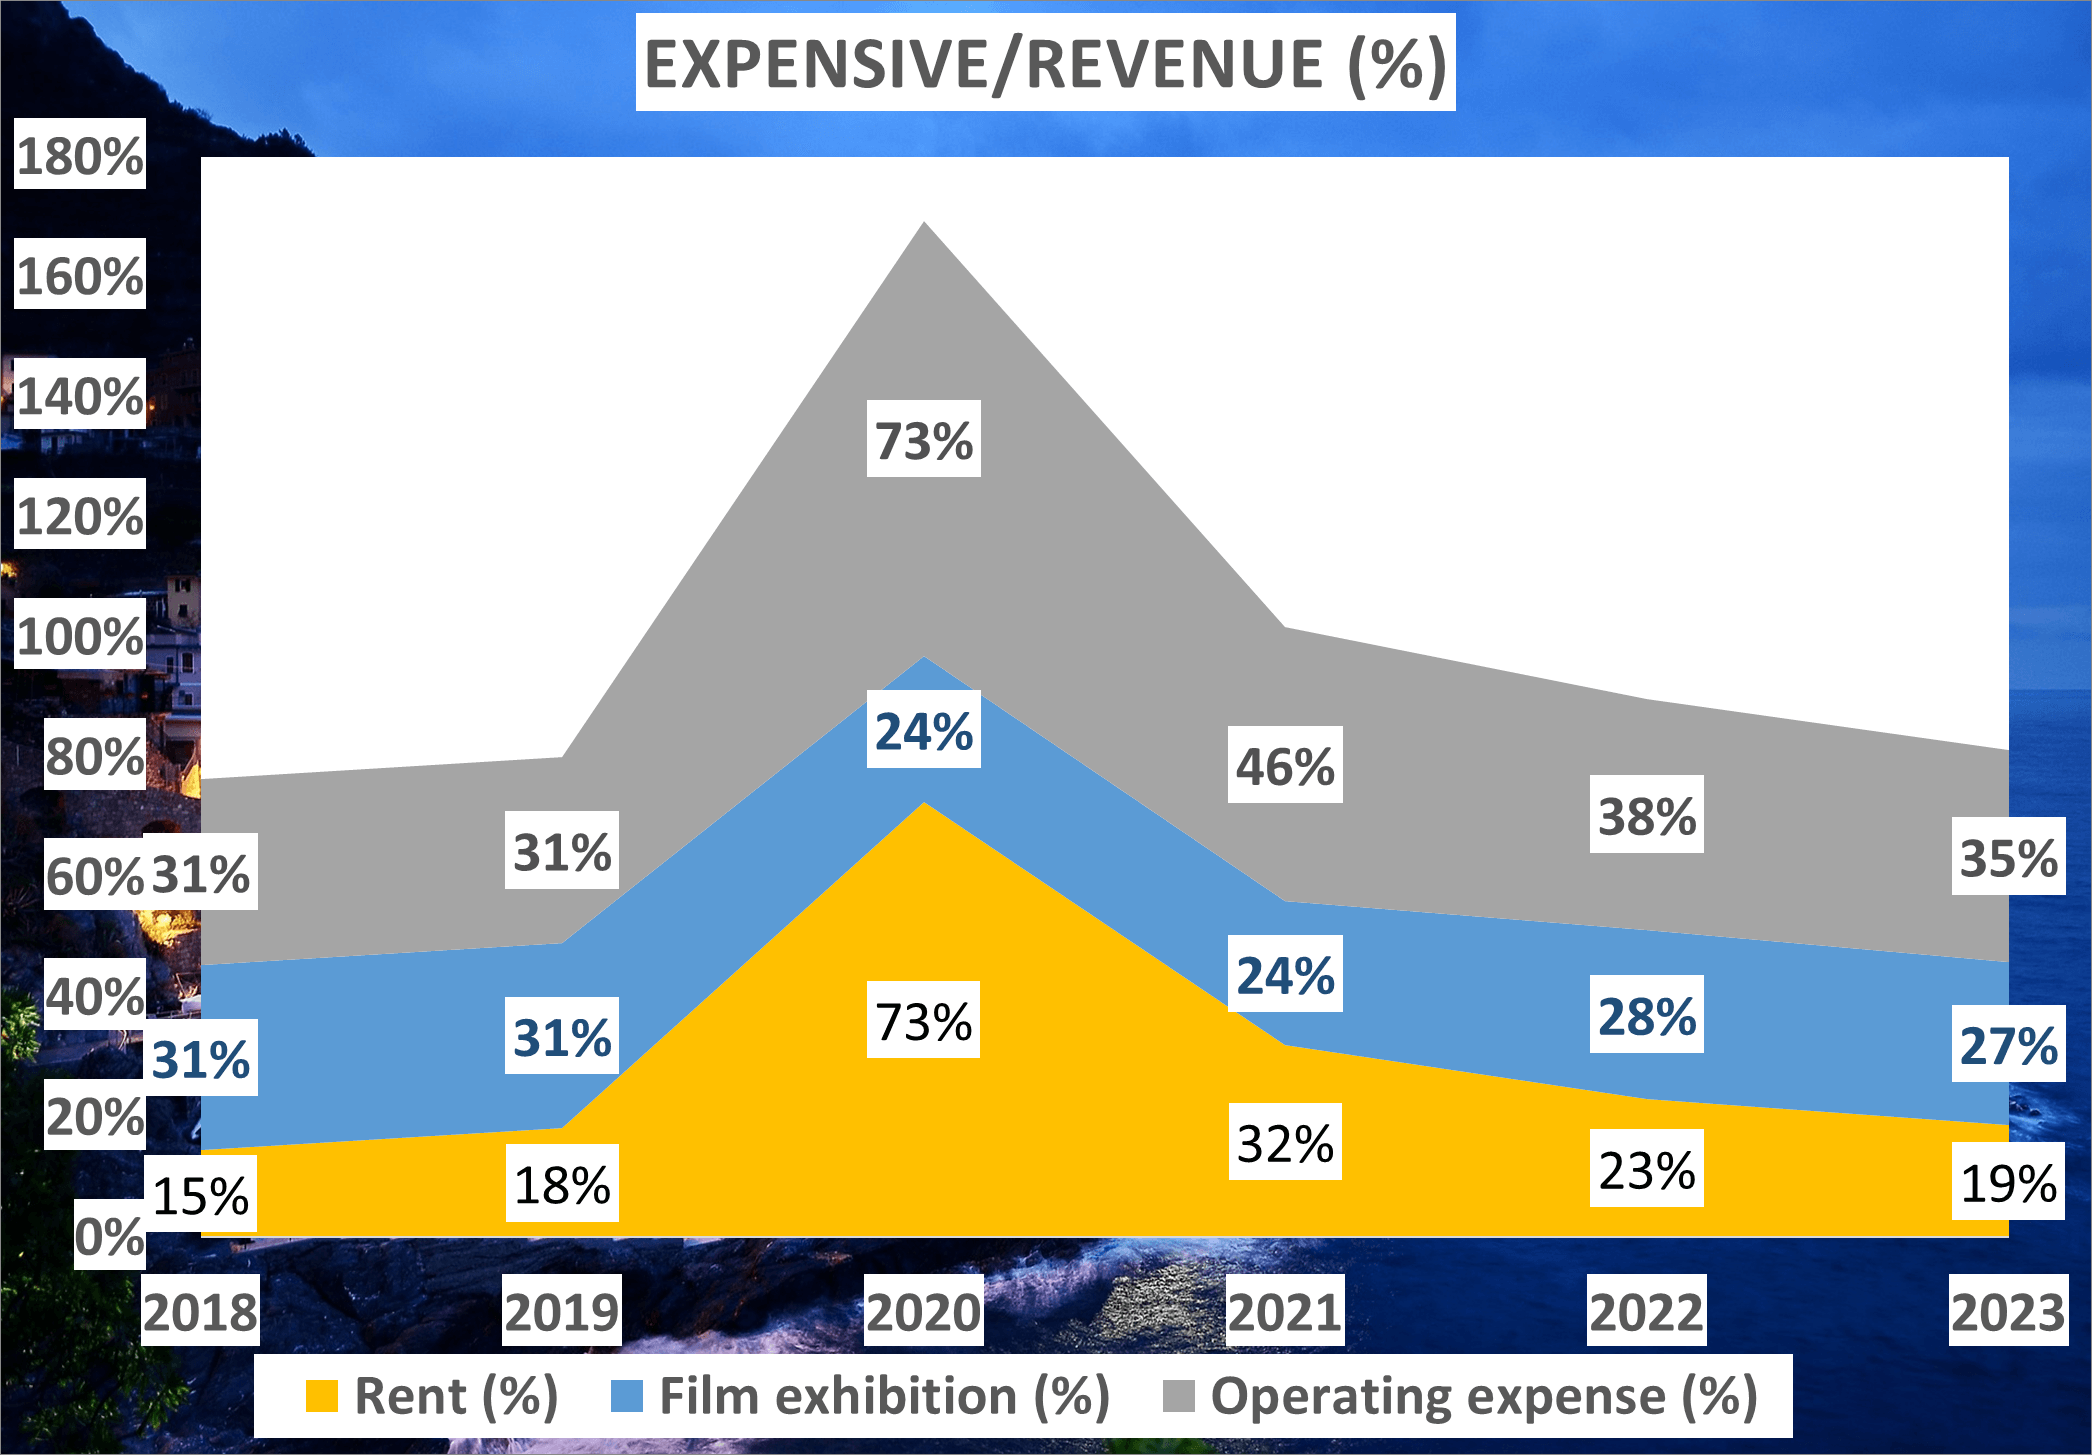
Examining expenses relative to revenue in 2023, rent constituted 19%, film exhibition costs occupied 27%, and operating expenses comprised 35% of revenue. The declining trend in the expenses-to-revenue ratio since 2020 presents a positive indicator for AMC’s financial outlook.
In conclusion, while AMC has shown growth, it’s evident that revenue has not fully recovered to pre-2020 levels. The company must sustain its momentum, focusing on revenue enhancement while prudently managing expenses to bolster overall financial well-being.
Profit and Asset Analysis – AMC Stock Analysis
Let’s delve into AMC’s profit margins and assets, pivotal aspects in assessing the company’s financial well-being.
Firstly, the Net Profit Margin for AMC in 2023 stands at -8%. While this figure reflects a downward trend since 2020 when it plummeted to -371%, subsequent years saw gradual reductions in losses, with margins of -52% in 2021 and -26% in 2022.
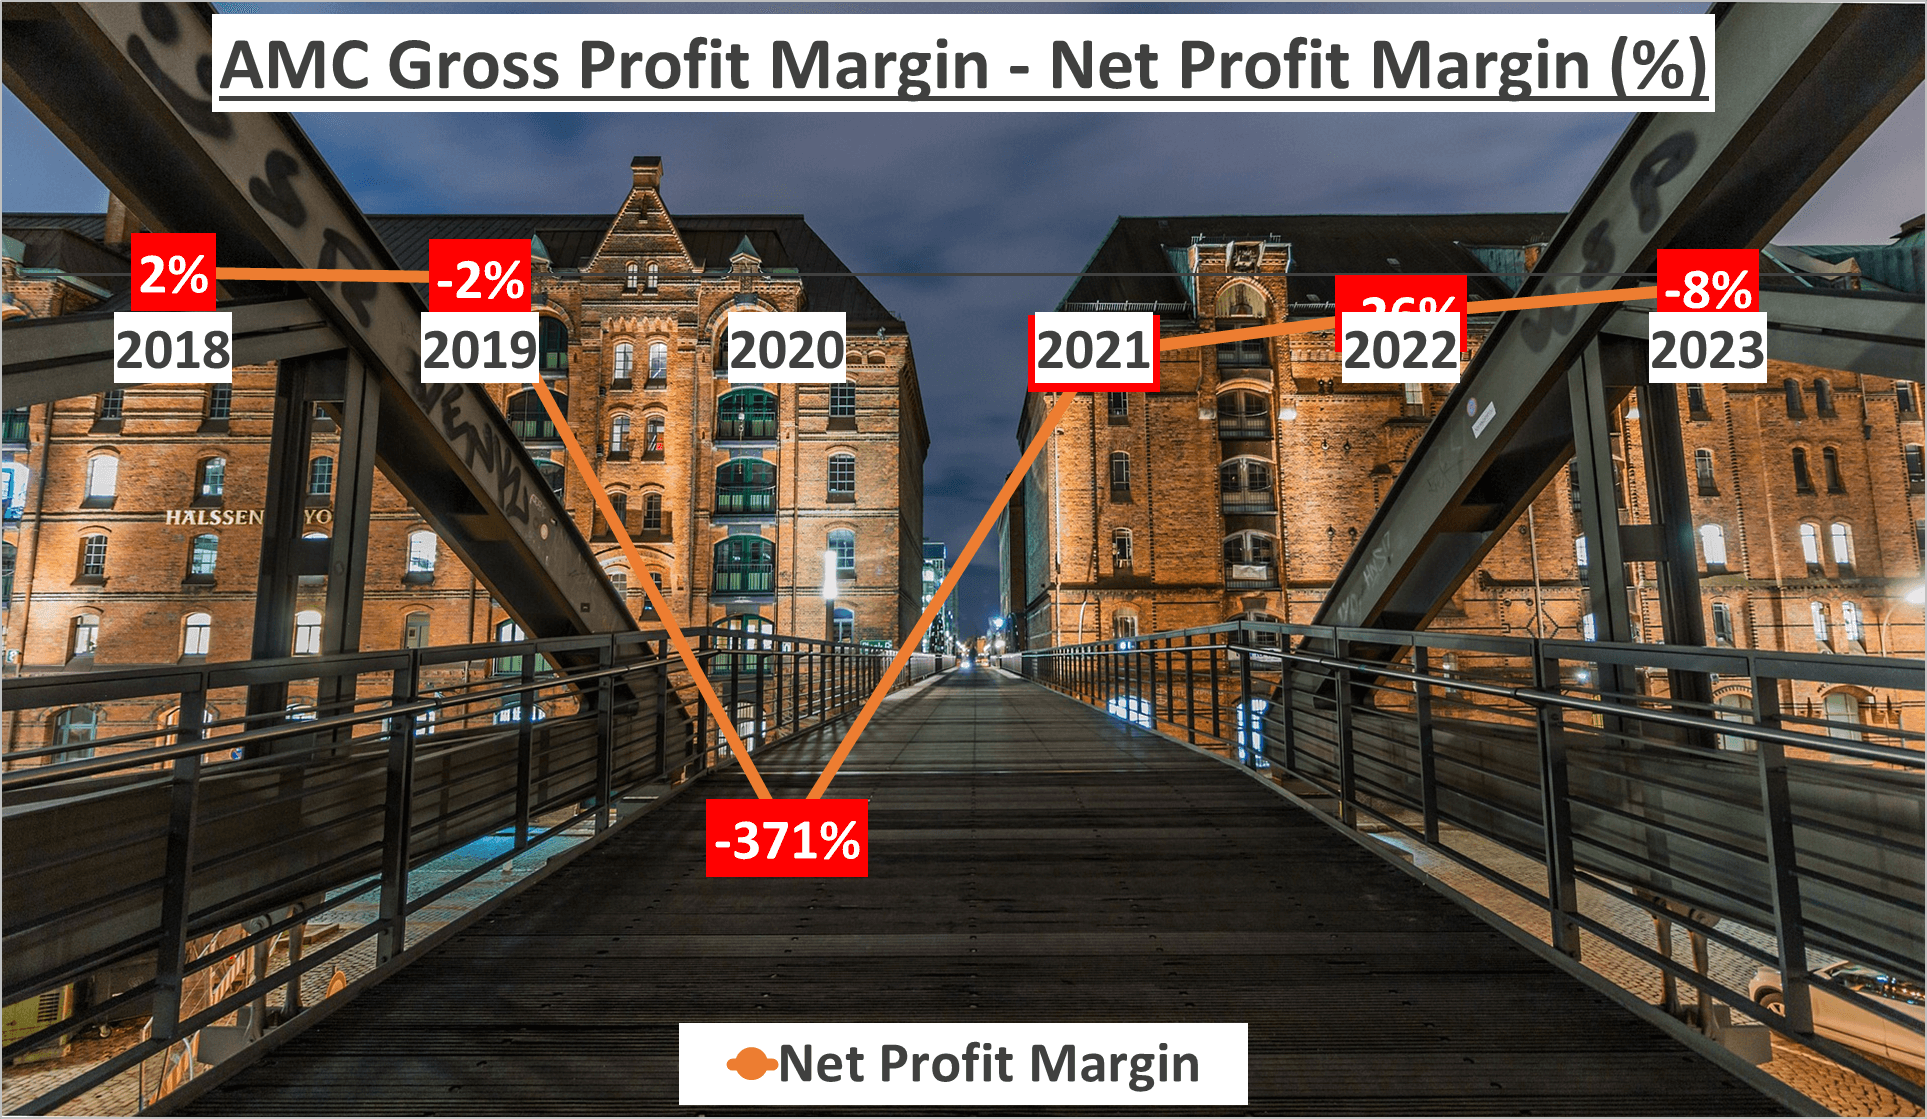
Despite being negative, this consistent decrease in losses suggests AMC is progressing towards achieving a positive Net Profit Margin, potentially by 2024.
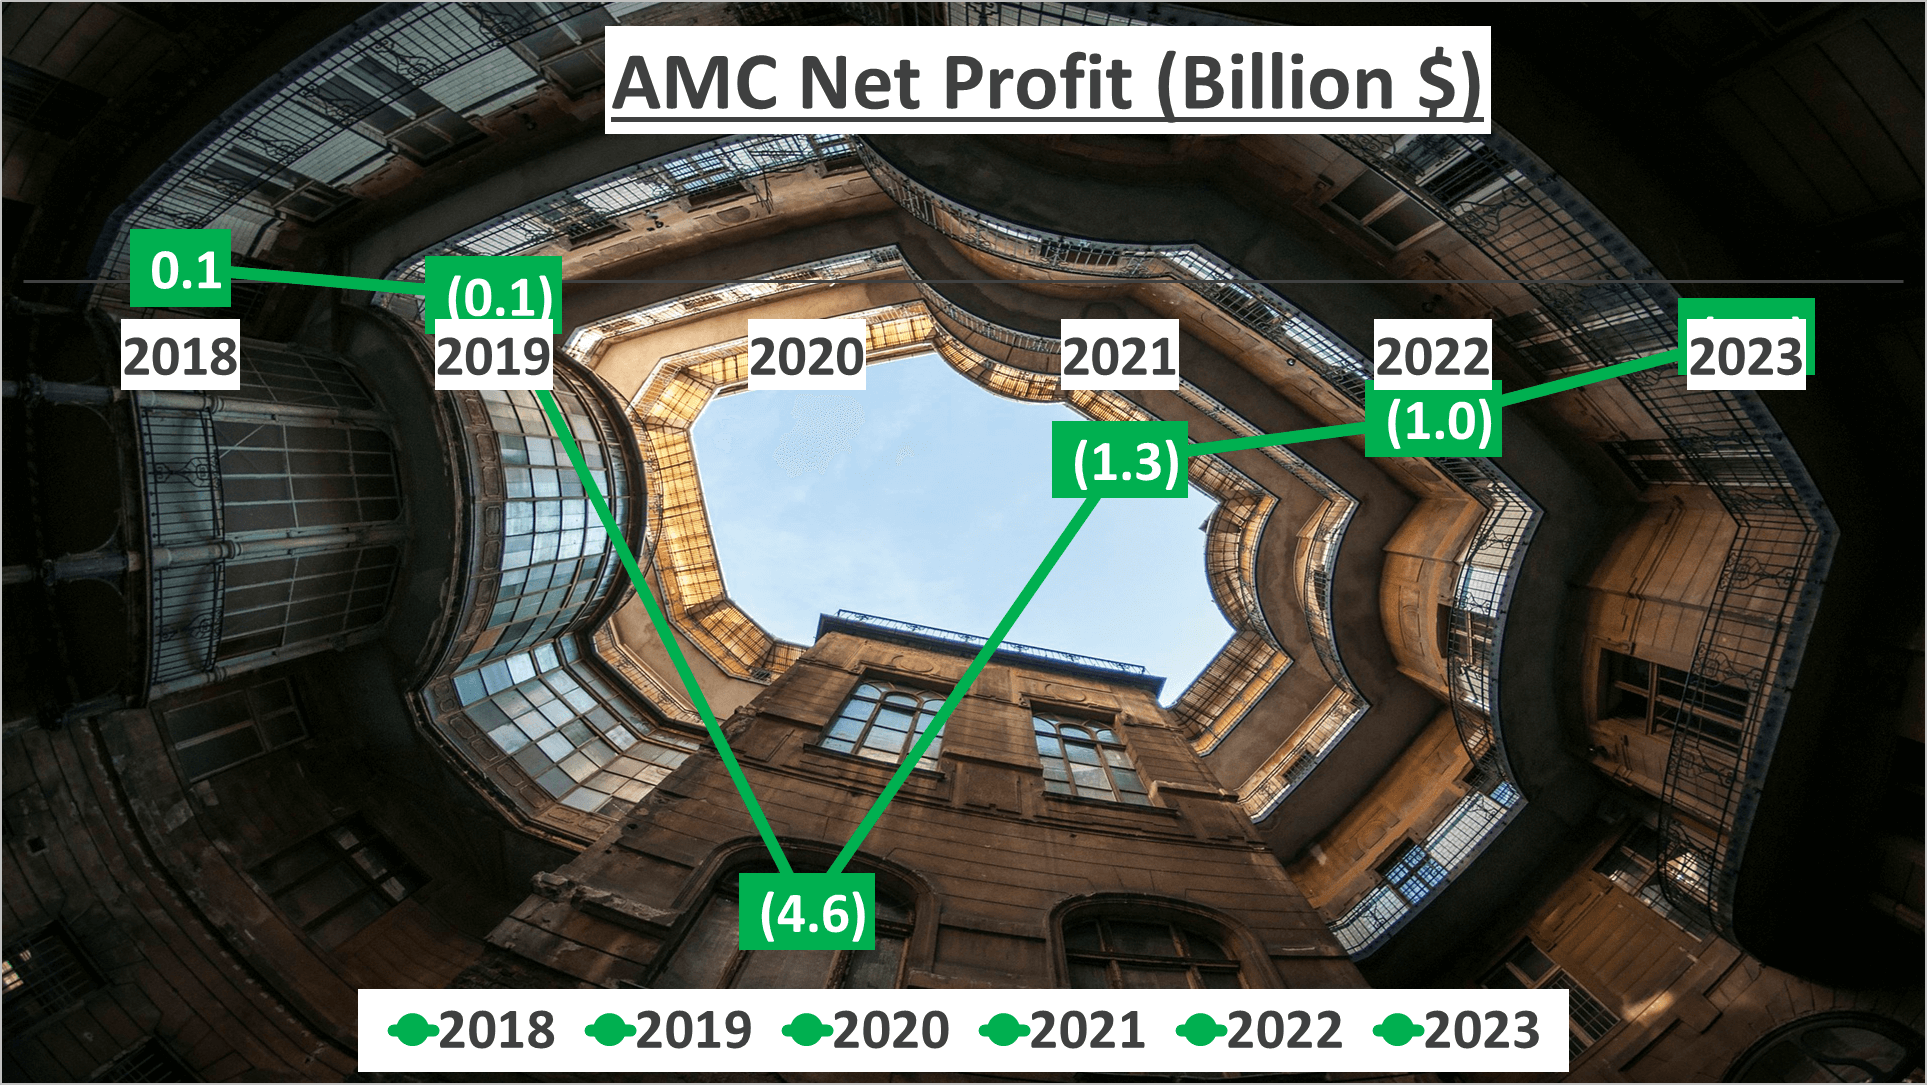
Moving on to Net Profit, another crucial profitability metric, AMC reported a negative $400 million in 2023. Similar to the Net Profit Margin, Net Profit has witnessed a decline over the years, signaling an improving financial stance for AMC, with expectations of achieving positive figures by 2024.
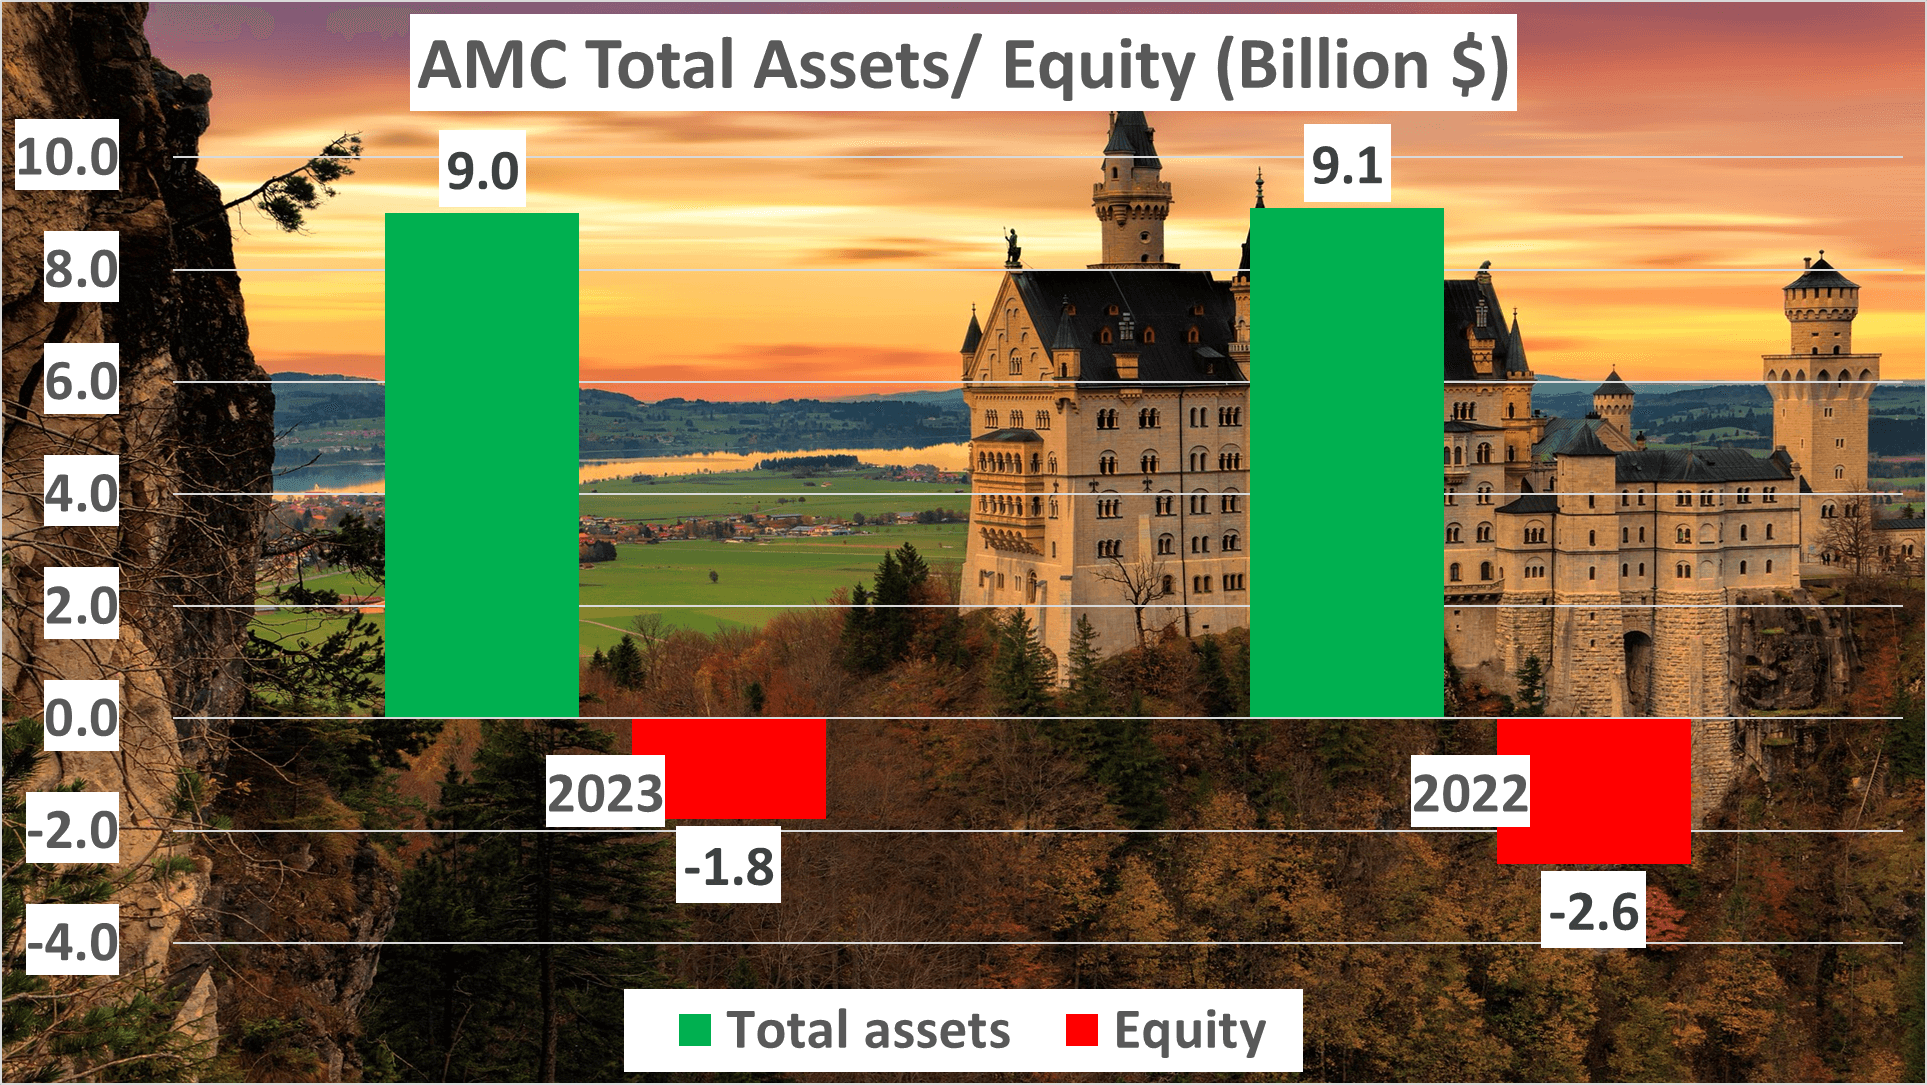
Now, let’s shift our focus to assets. In 2023, AMC’s total assets amounted to $9 billion, marginally lower than $9.1 billion in 2022. Conversely, Net Assets improved to -$1.8 billion in 2023 from -$2.6 billion in 2022. Despite being suboptimal, the trend of enhancing Net Assets indicates positive momentum for AMC.
In conclusion, while AMC’s profit margins and assets may seem discouraging, the consistent improvements signify a ray of hope. Despite negative figures, there’s a clear trajectory towards positivity in the near future. This trend of enhancement underscores AMC’s potential for financial recovery and resilience.
Liquidity and Cash Flow Analysis – AMC Stock Analysis
Let’s explore AMC’s liquidity and cash flow status.
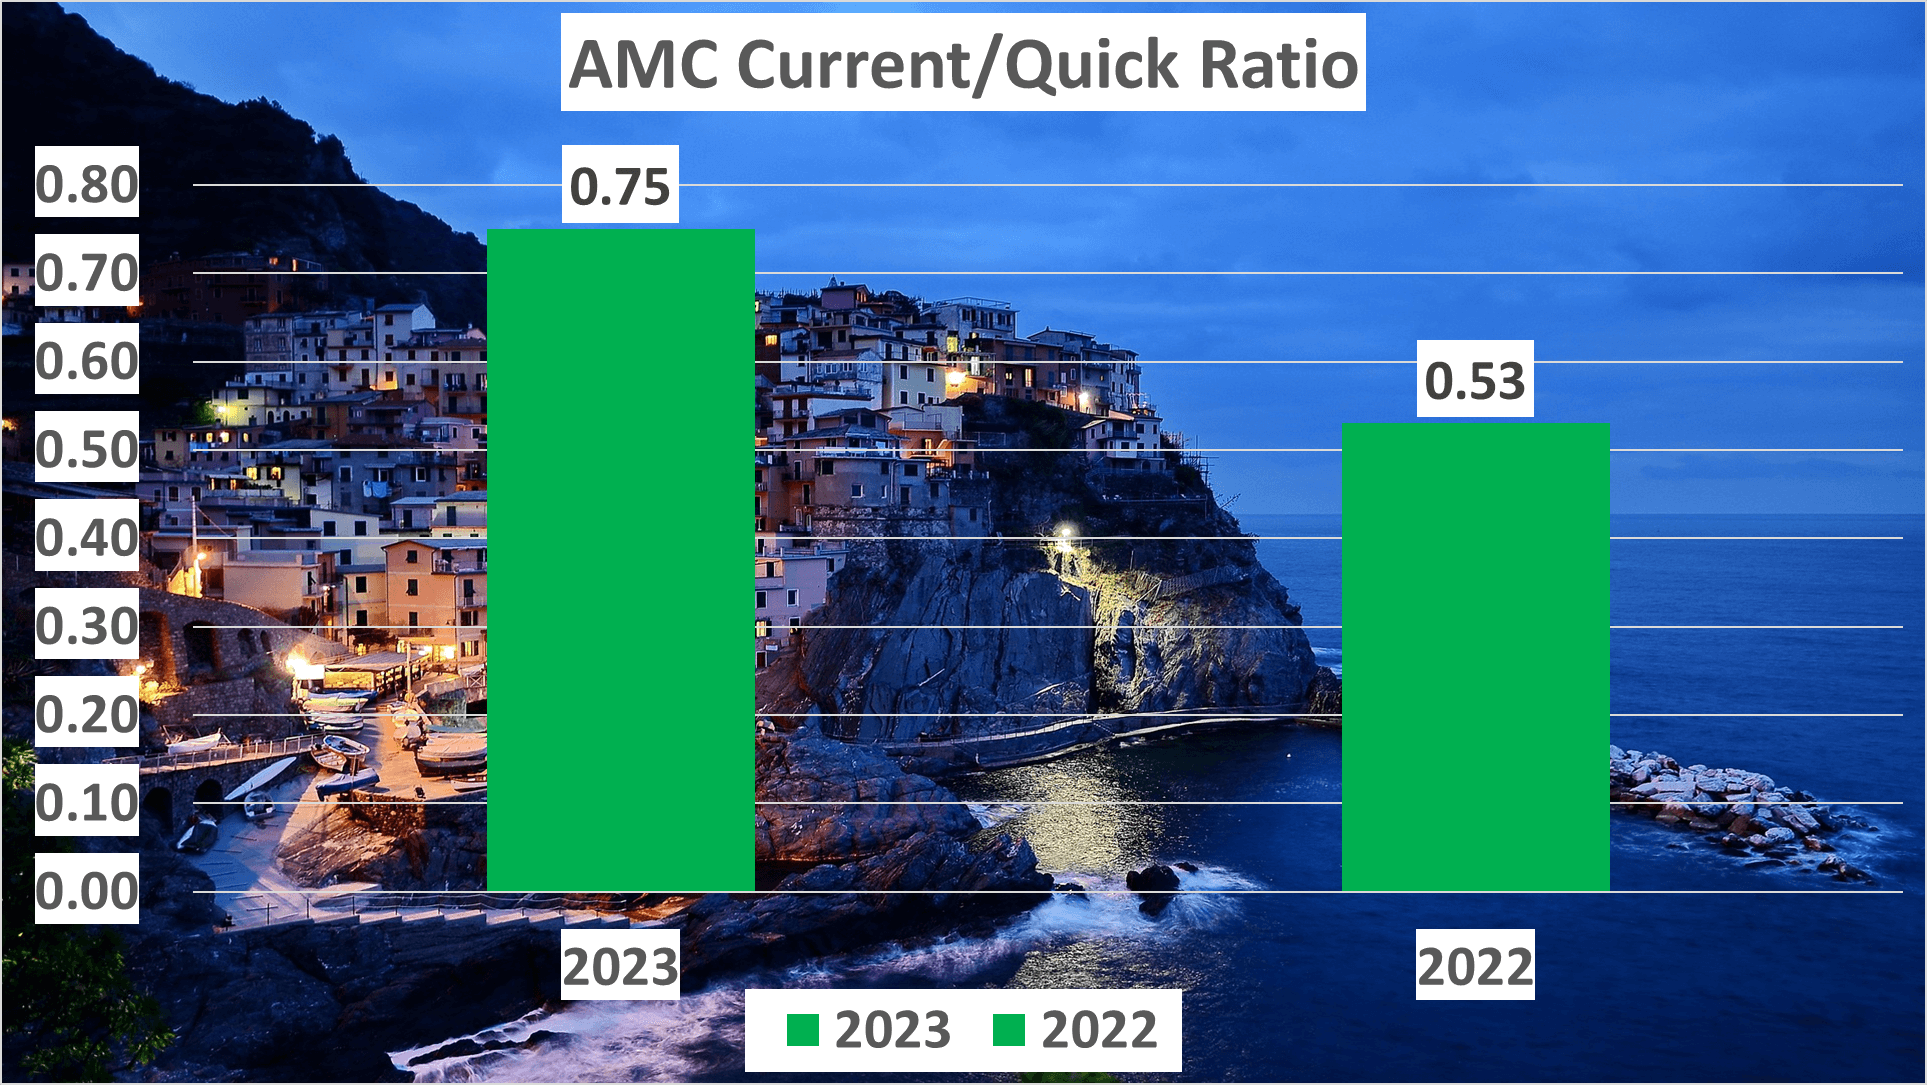
Starting with liquidity, it’s pivotal for a company to meet short-term obligations. The Current Ratio, calculated by dividing Current Assets by Current Liabilities, indicates AMC’s liquidity. In 2023, AMC’s Current Ratio is 0.75, compared to 0.53 in 2022. A ratio below one suggests AMC’s liquidity is not optimal, hinting at potential difficulty in fulfilling short-term obligations.
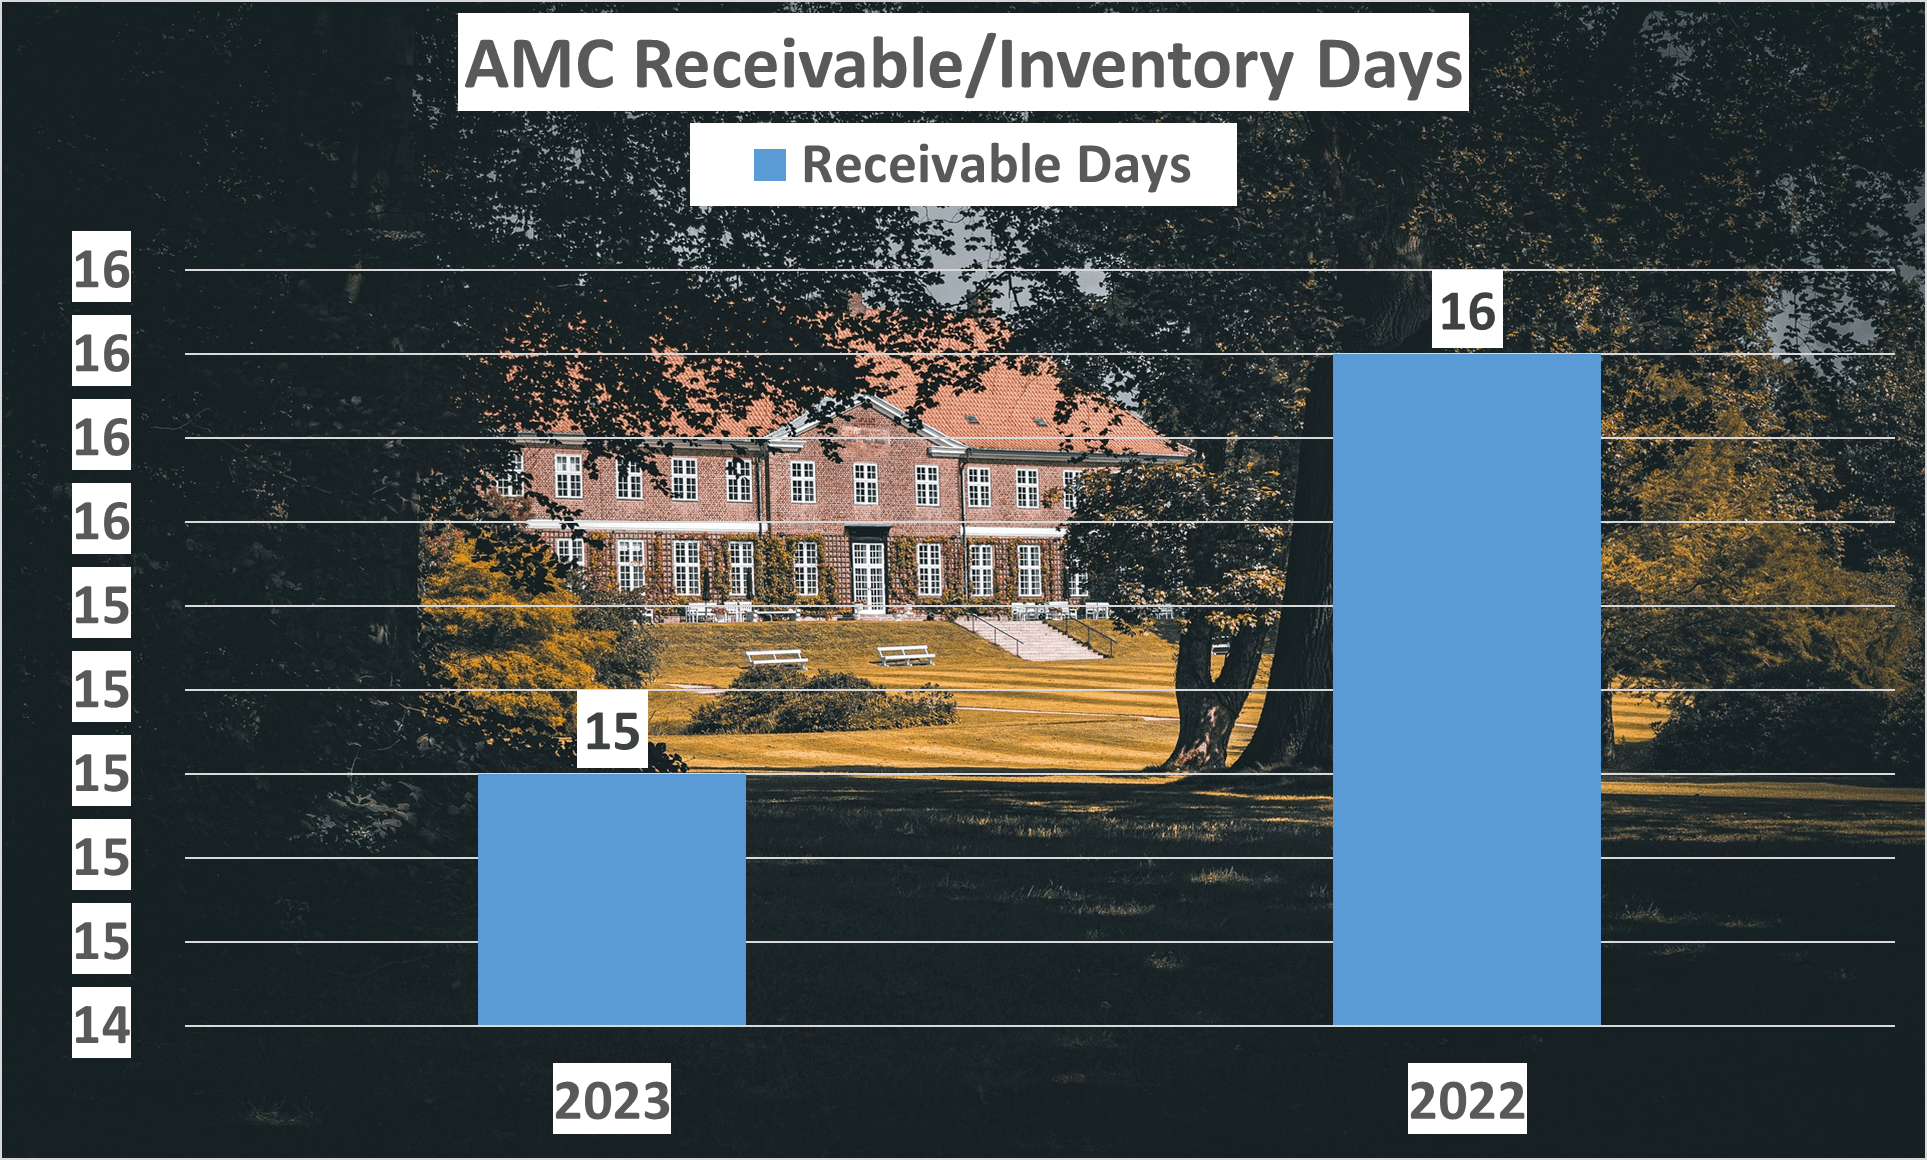
Next, Receivable Days measures how swiftly a company collects payments. AMC’s Receivable Days for 2023 is 15, slightly lower than 16 in 2022. This decrease signifies AMC is collecting payments faster, a positive indicator for cash flow.
Now, let’s focus on cash flow. It’s the net cash and cash equivalents flowing in and out of a company. A positive cash flow implies increasing liquid assets, facilitating debt settlement, reinvestment, shareholder returns, expenses, and safeguarding against financial hurdles.
In 2023, AMC’s Operating Cash Flow, generated from core operations, is -$0.2 billion, while Free Cash Flow, after necessary investments, is -$0.4 billion. Despite negativity, these figures depict improvement, indicating AMC’s cash flow is growing less negative, a promising sign. Negative cash flow isn’t always detrimental if directed towards growth.

Though there’s room for progress, AMC’s liquidity and cash flow are on an upward trajectory, instilling hope for the future.
Dupont Analysis – AMC Stock Analysis
Let’s delve into AMC’s Return on Equity (ROE) using Dupont Analysis, which dissects ROE into three components: Net Profit Margin, Asset Turnover, and Equity Multiplier, providing unique insights into AMC’s financial landscape.
In 2023, AMC’s ROE stood at 22%. However, a deeper analysis reveals a negative Net Profit Margin of -8%, an Asset Turnover of 0.53, and a negative Equity Multiplier of -5. Comparing these with 2022 figures, where ROE was higher at 38%, but Net Profit Margin was -26%, Asset Turnover was 0.43, and Equity Multiplier was -3.5, intriguing trends emerge.
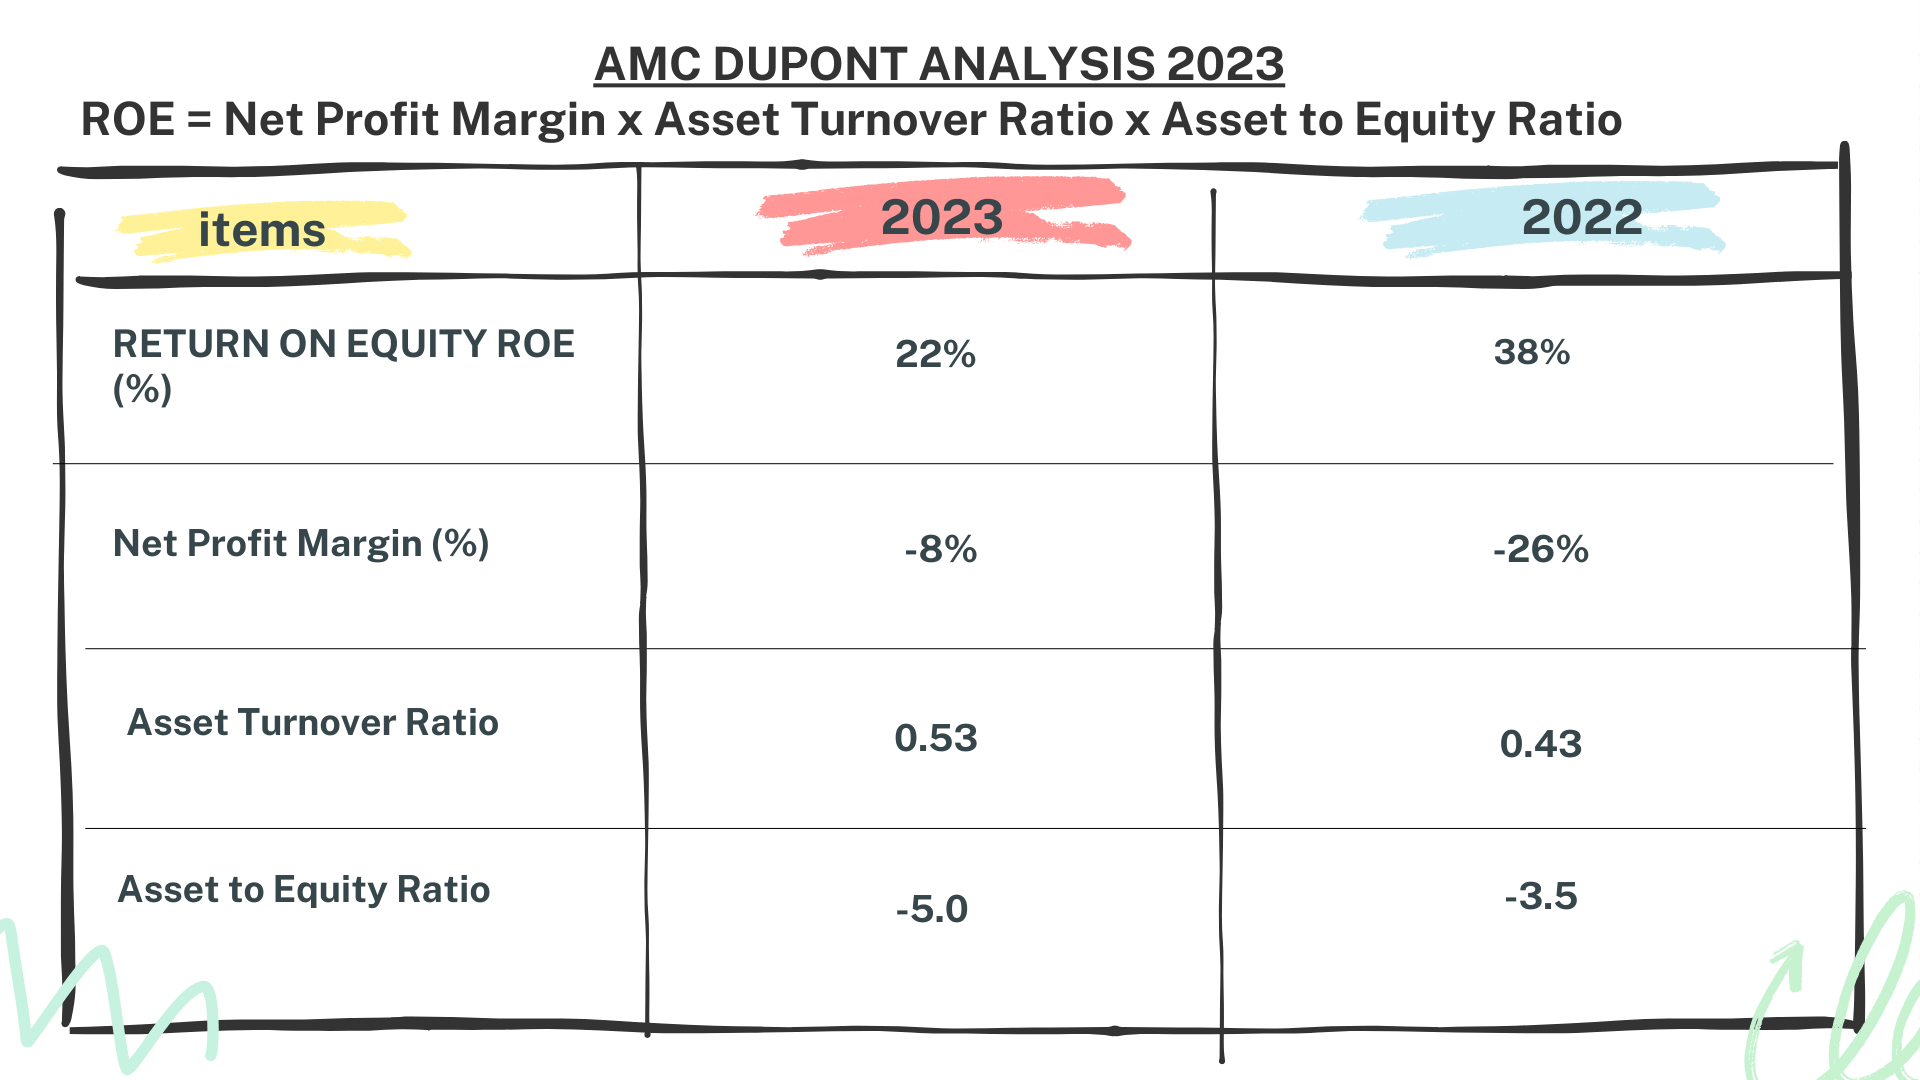
Despite seemingly positive ROE, negative net profit and equity underpin these figures. This scenario could mislead investors, as a positive ROE may mask underlying financial challenges.
Understanding the intricacies of these negative components is crucial for investors to make informed decisions amidst seemingly positive ROE.
Author: investforcus.com
Follow us on Youtube: The Investors Community

