AMD Stock Analysis – Picture investing $1000 into AMD back in 2018. Fast forward to March 2024, and that investment would have burgeoned to $10,430, marking a remarkable tenfold increase with an impressive annual return of 60%.
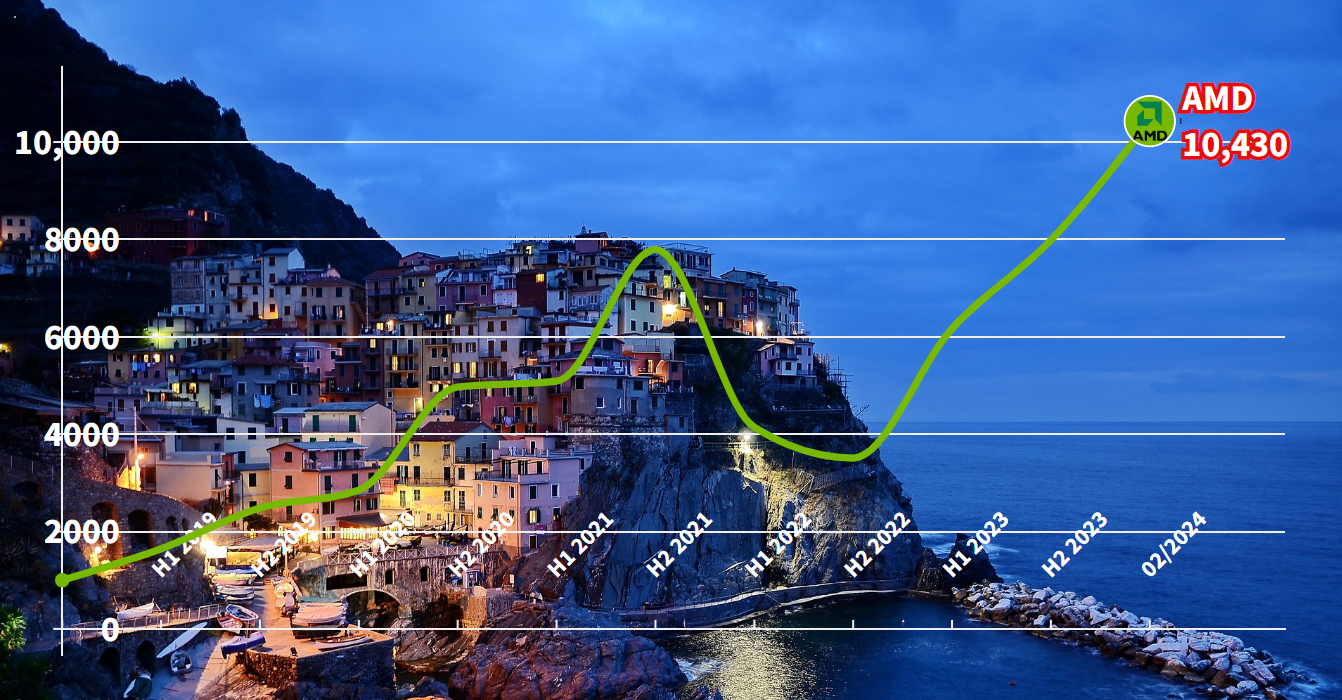
The numbers are undeniably striking, but what truly captivates is the narrative behind this growth. These figures are the culmination of strategic decisions and performances that have steered the trajectory of this tech giant over the years.
In this analysis, we delve beyond mere numbers. We unravel AMD’s financial and business performance, shedding light on the pivotal factors driving this extraordinary growth. Our exploration spans revenues, profit margins, net profits, assets, liquidity, and operational efficiency, among other crucial aspects.
What catalyzed this phenomenal growth? Join us as we delve deep into AMD’s business performance to uncover the driving forces behind its remarkable ascent.
AMD Stock Analysis: Deep Dive into Revenue Trends
In 2023, AMD disclosed a revenue of $22.7B, boasting an impressive annual growth rate of 28% since 2018. This growth trajectory wasn’t linear, featuring notable fluctuations across different years.
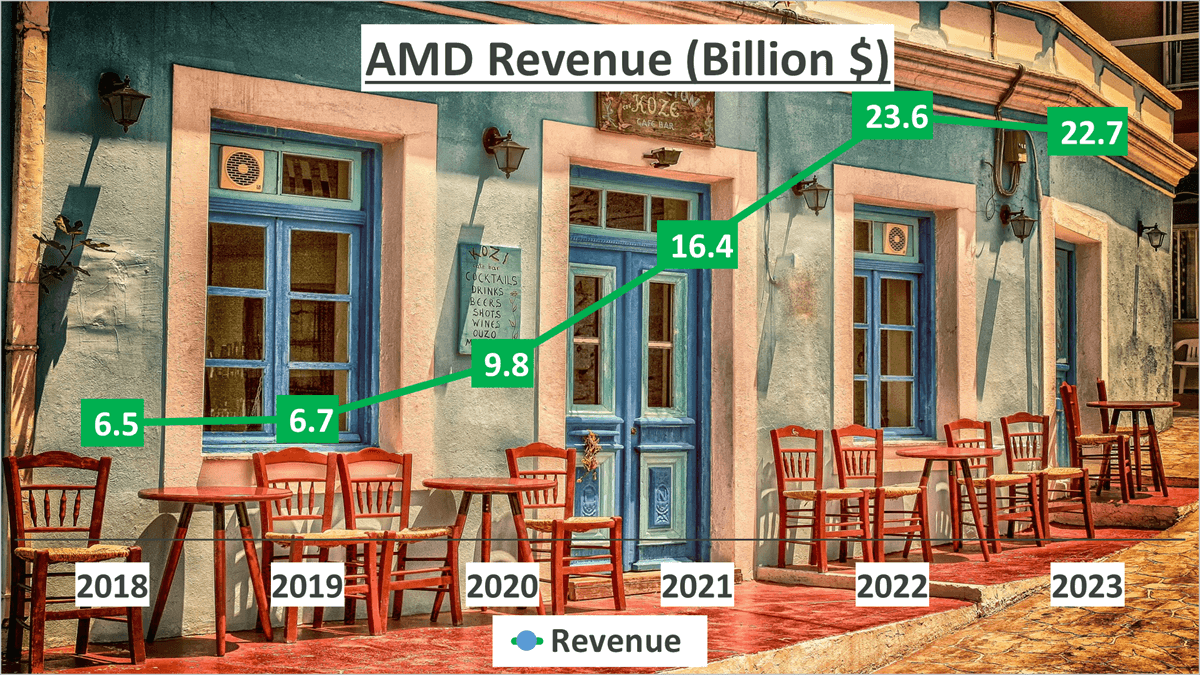
Between 2018 and 2019, growth was modest at 3%. However, the subsequent year witnessed a remarkable surge with AMD’s revenue skyrocketing by 46%. The upward momentum continued in 2021 with an impressive 67% increase.
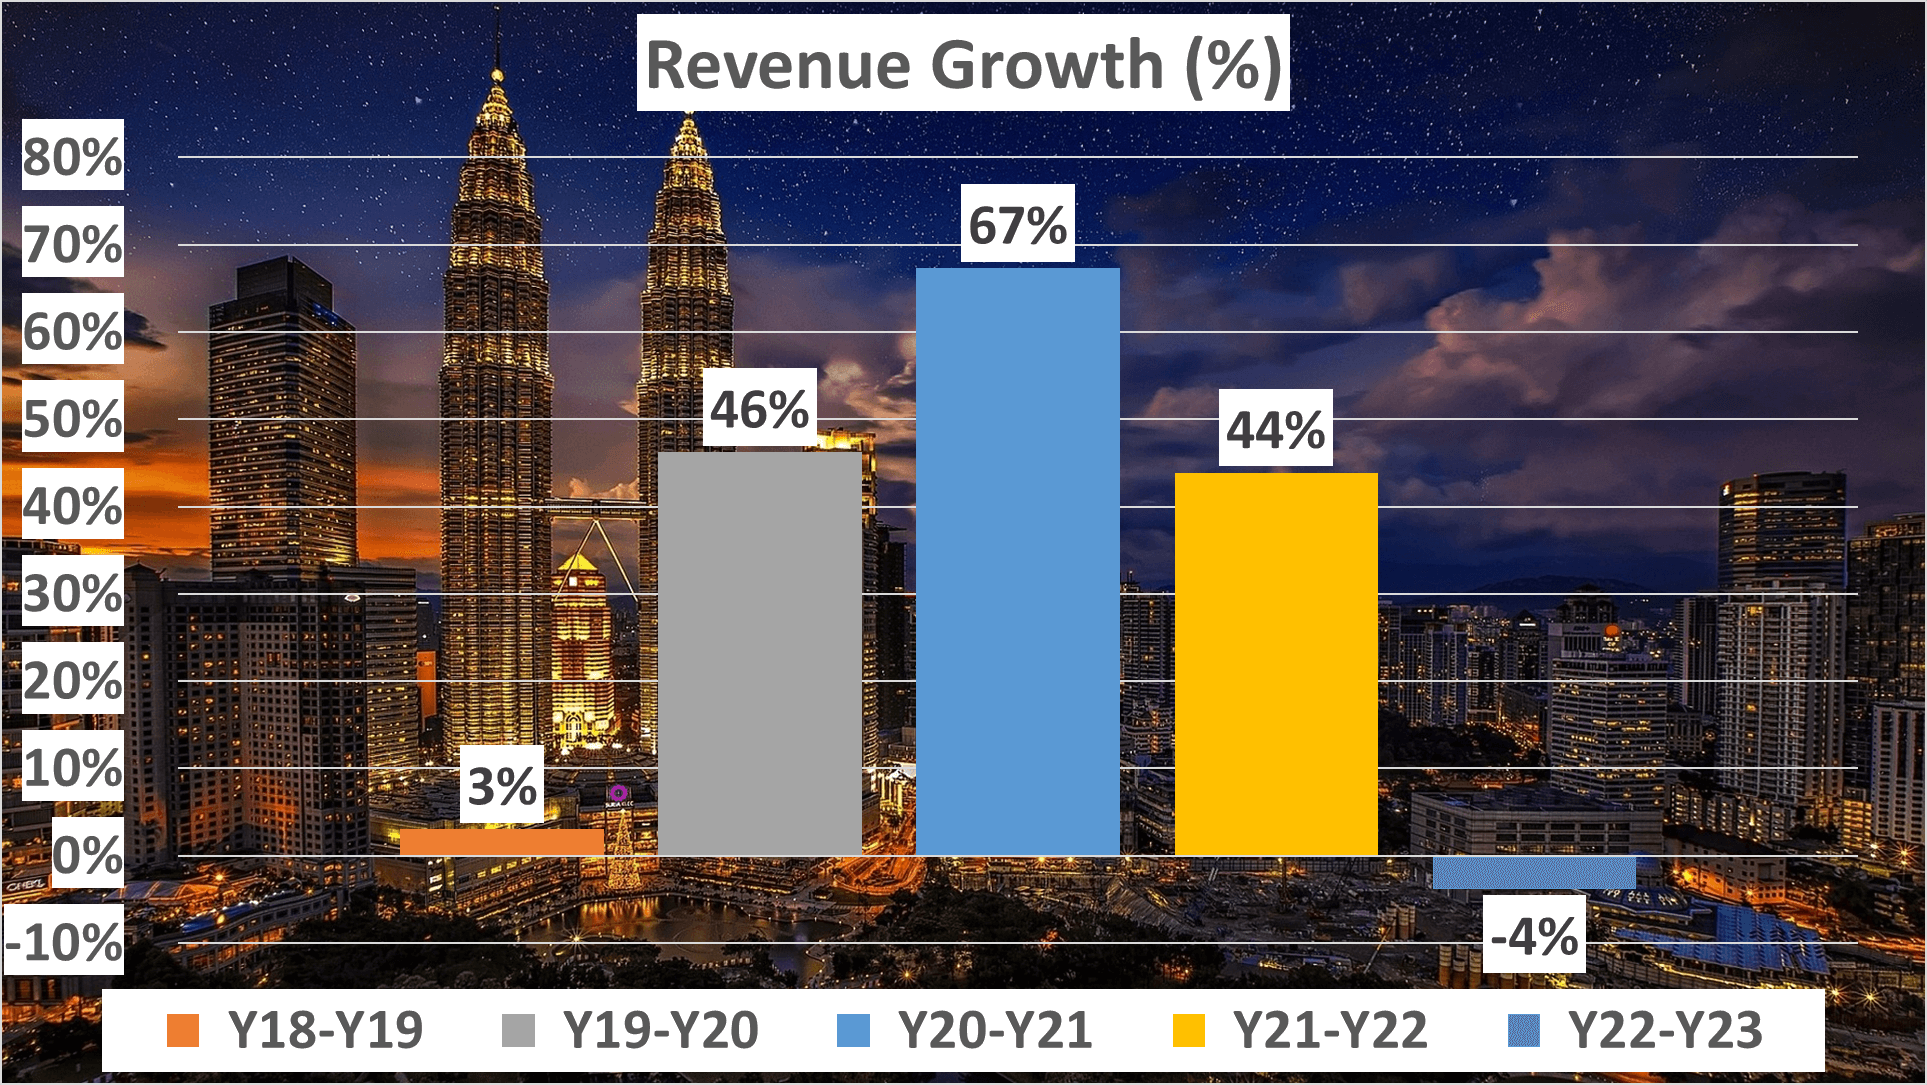
There was another significant leap of 44% in 2022. However, in 2023, AMD encountered a slight downturn, experiencing a 4% decrease.
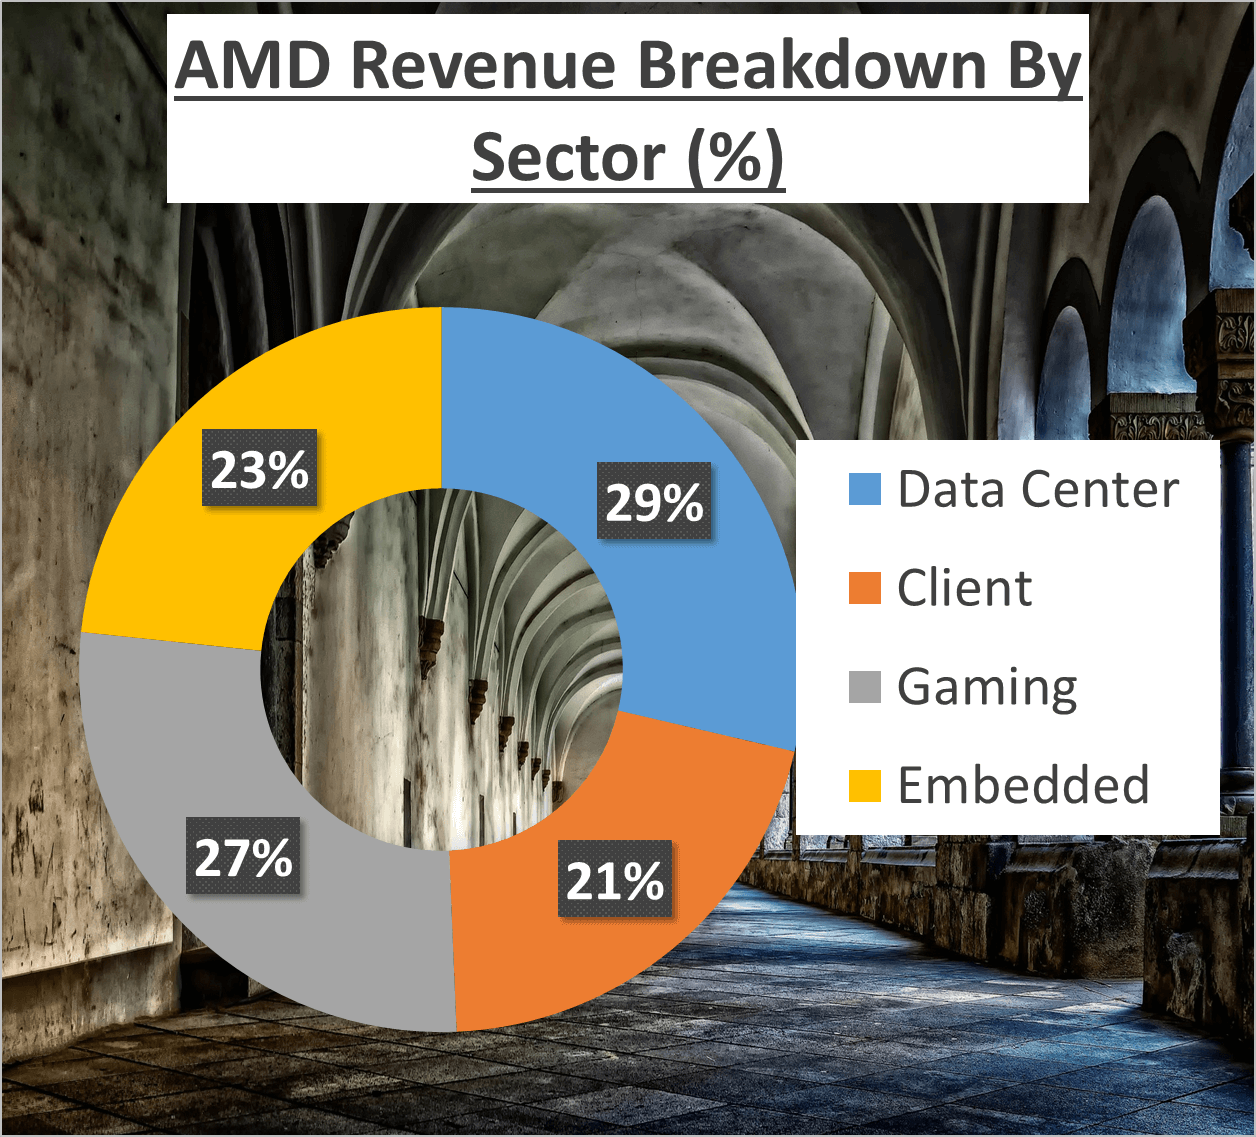
AMD’s revenue structure is diverse and balanced, indicative of a robust business model. Data Center contributes 29% of the revenue, Client accounts for 21%, Gaming for 27%, and Embedded for the remaining 23%.
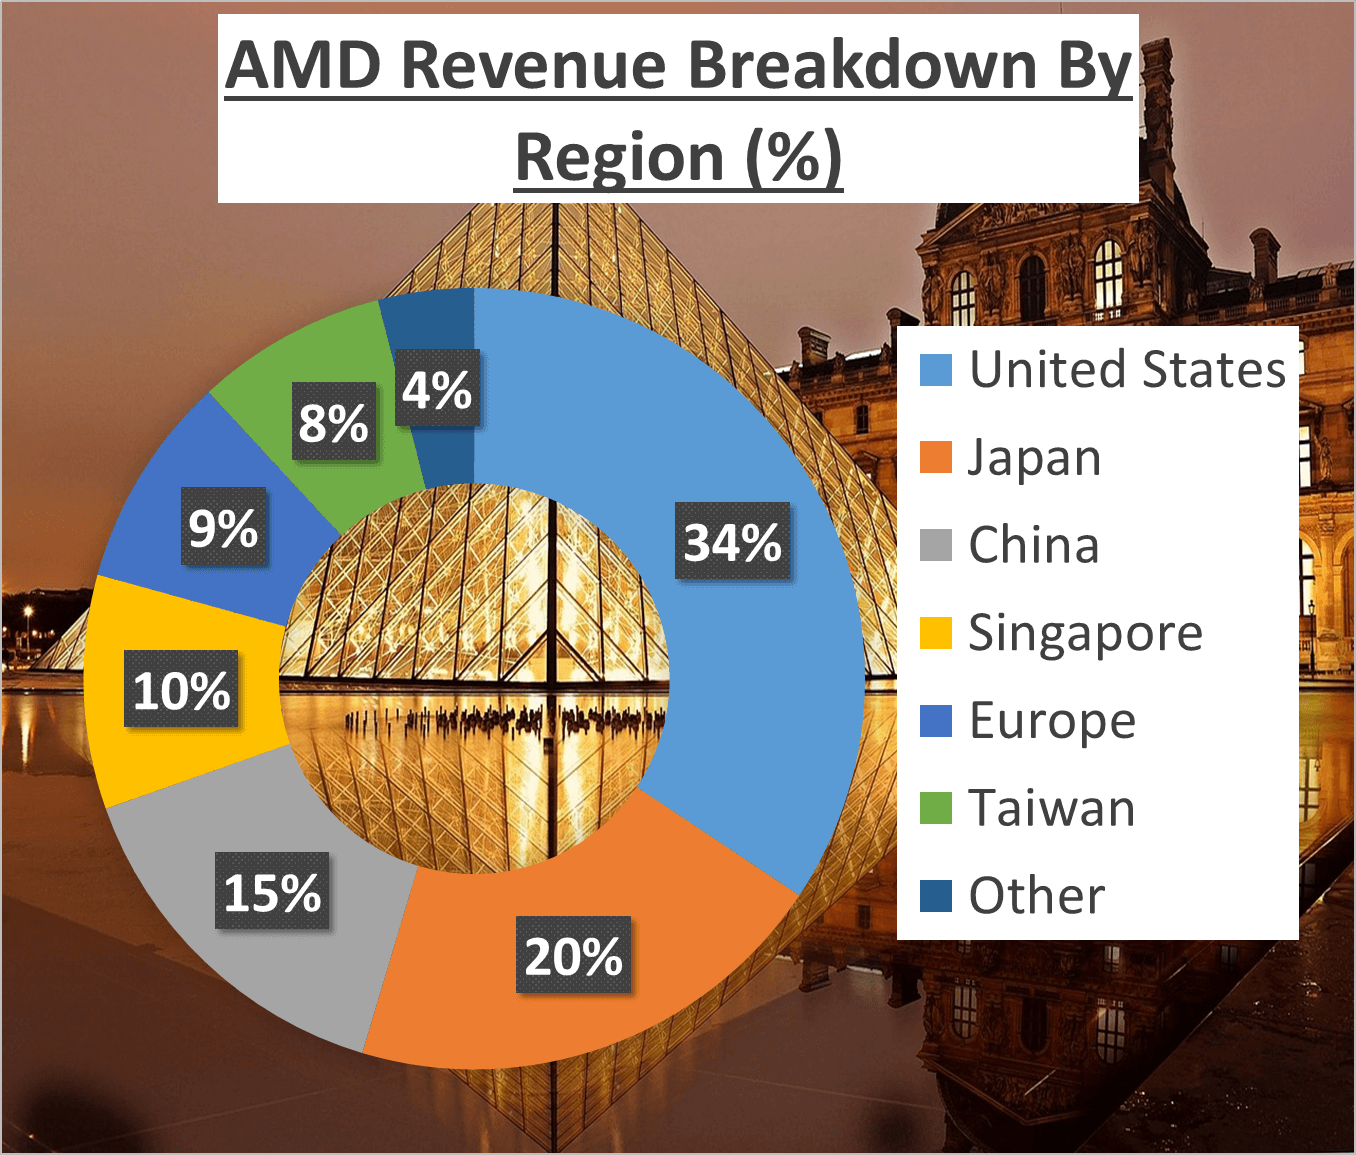
This diversified revenue stream mitigates reliance on any single vertical for income. Geographically, AMD’s revenue is well spread out. The United States contributes 34%, Japan 20%, China 15%, and Singapore 10%. Europe and Taiwan contribute 9% and 8%, respectively, with the remaining 4% from other regions.
AMD’s revenue growth is particularly intriguing due to its strategic alignment with rising demand for high-performance computing, gaming, and data center solutions, while maintaining a balanced product portfolio.
What does this mean for investors? Despite the slight dip in 2023, AMD’s consistent revenue growth over the years signifies stability. The company’s adeptness at diversifying income sources, both in terms of products and geography, establishes a solid foundation for future expansion.
Coupled with increasing demand for AMD’s products across various sectors, this paints a promising outlook for the future. Despite the minor setback in 2023, AMD’s sustained revenue growth remains a positive indicator for investors.
AMD Stock Analysis: Examining Profitability Metrics
In 2023, AMD’s Gross Profit Margin stood at 50%, slightly surpassing the five-year average of 46%. This uptick underscores AMD’s adeptness in managing production costs while maximizing product pricing.
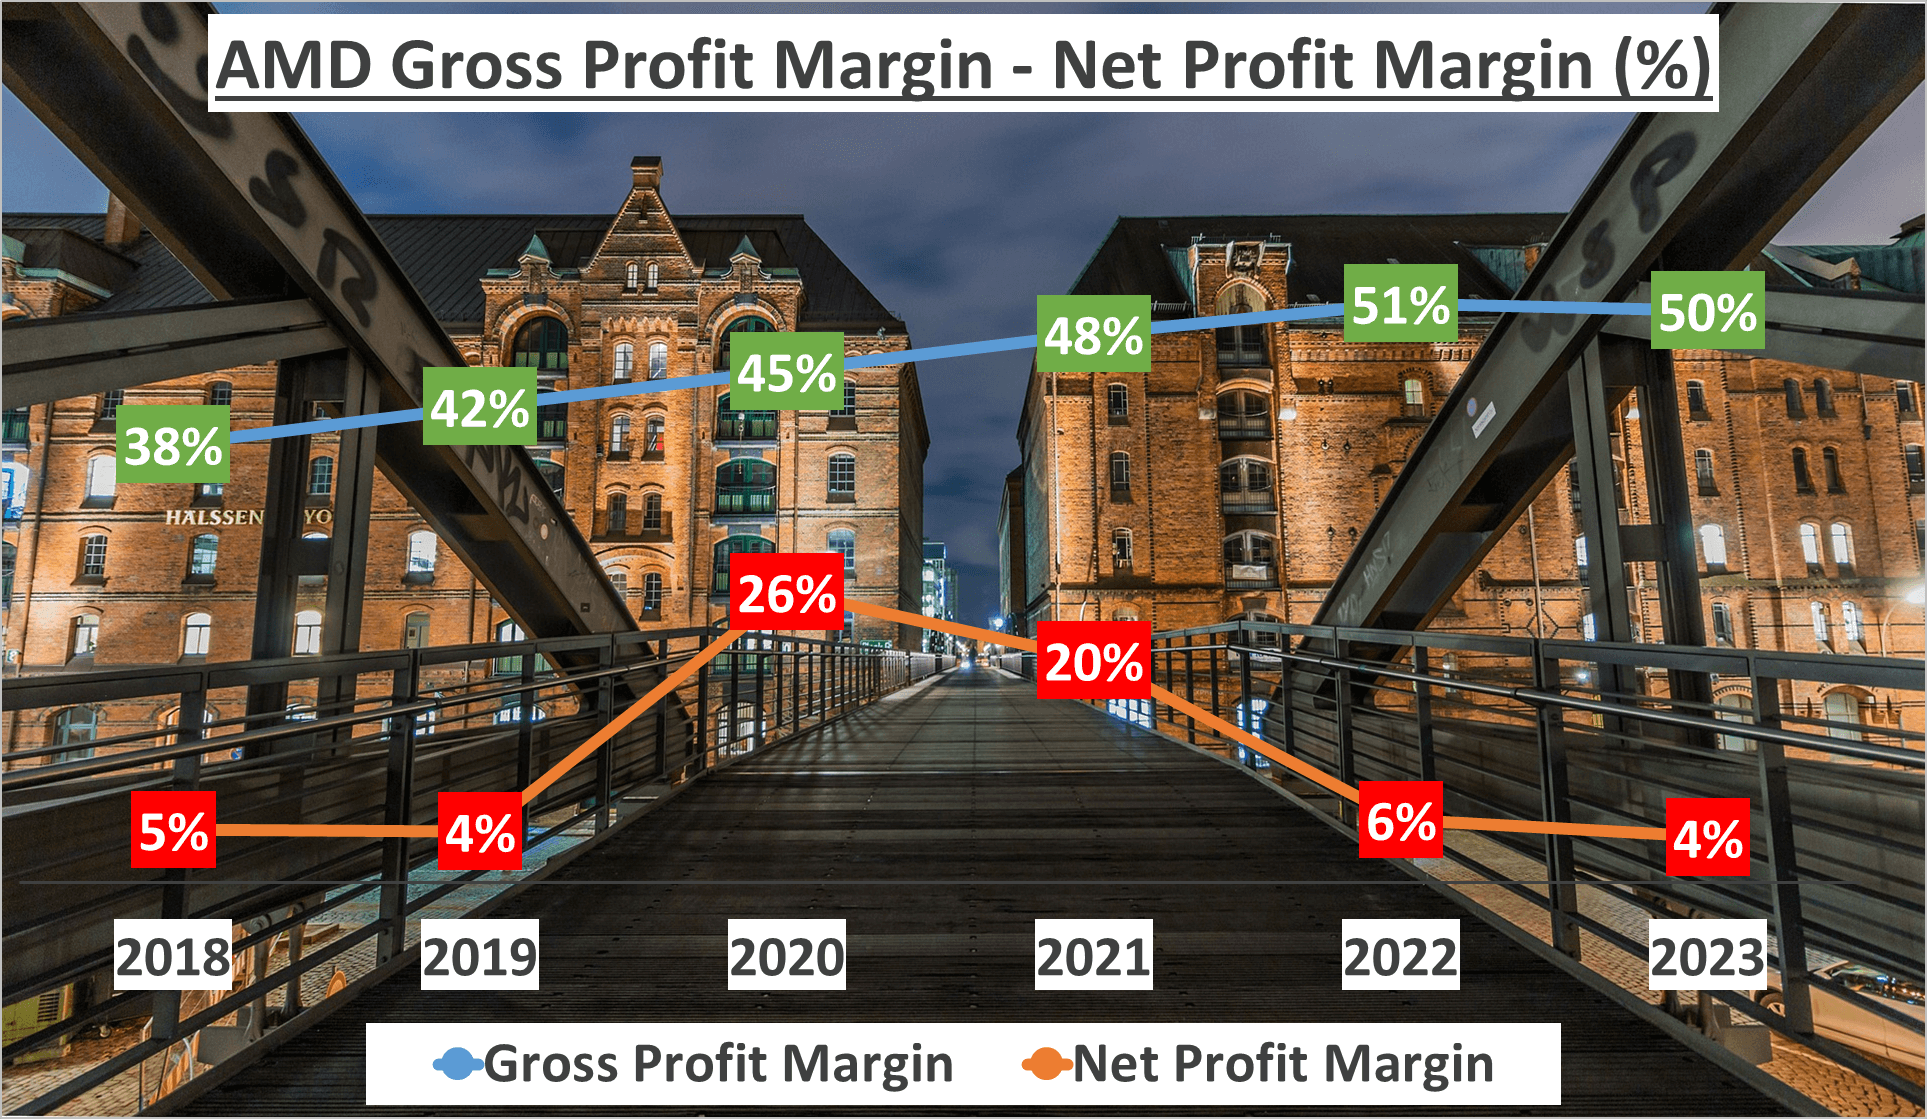
However, the Net Profit Margin for the same year was 4%, notably lower than the five-year average of 11%.
What accounts for this variance? The primary reason for the dip in Net Profit Margin was a surge in costs in 2022 and 2023, largely stemming from the Amortization of Goodwill following AMD’s acquisition of semiconductor company XilinX. This non-cash expense impacted net income and subsequently, the Net Profit Margin.
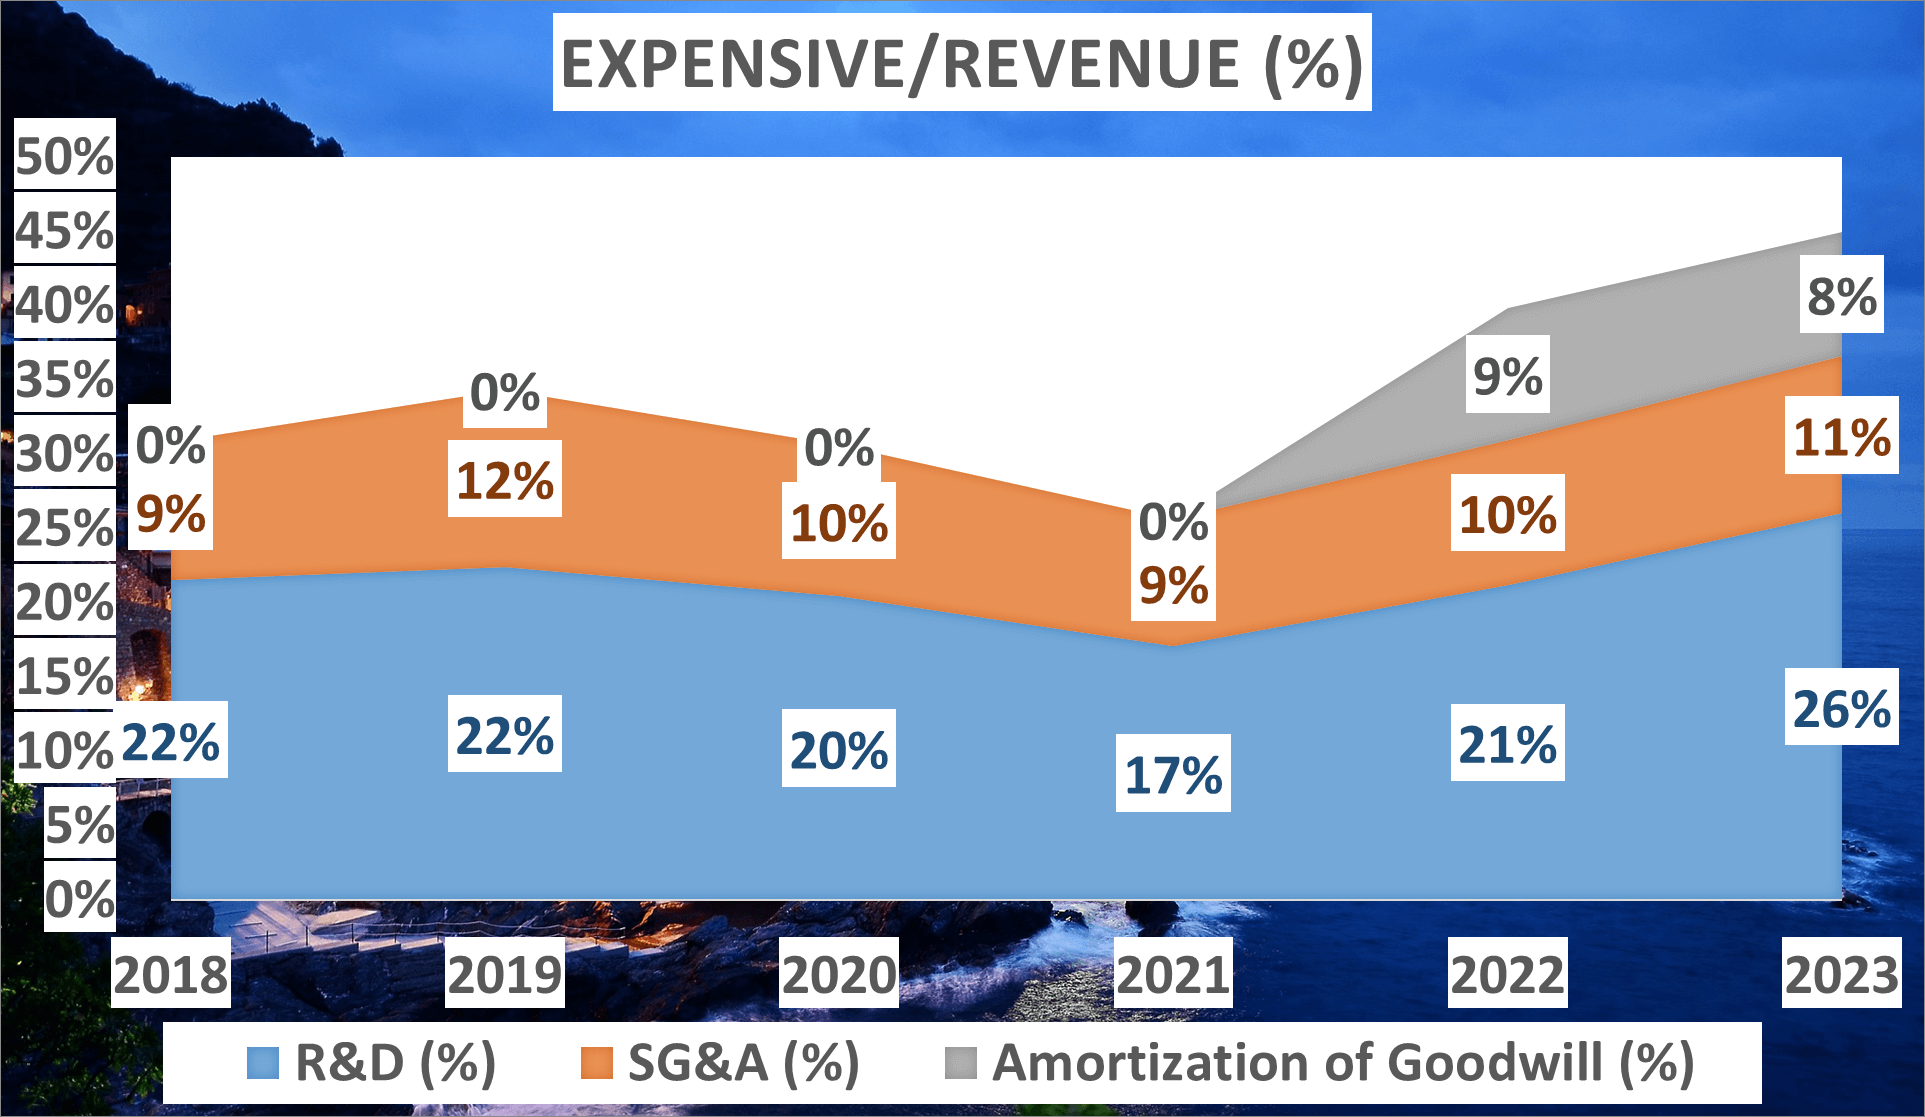
It’s pertinent to note that such costs are transient and typically decrease over time post-acquisition. Now, let’s focus on Net Profit. In 2023, AMD’s Net Profit reached $900M, reflecting a Compound Annual Growth Rate (CAGR) of 25% compared to 2018.
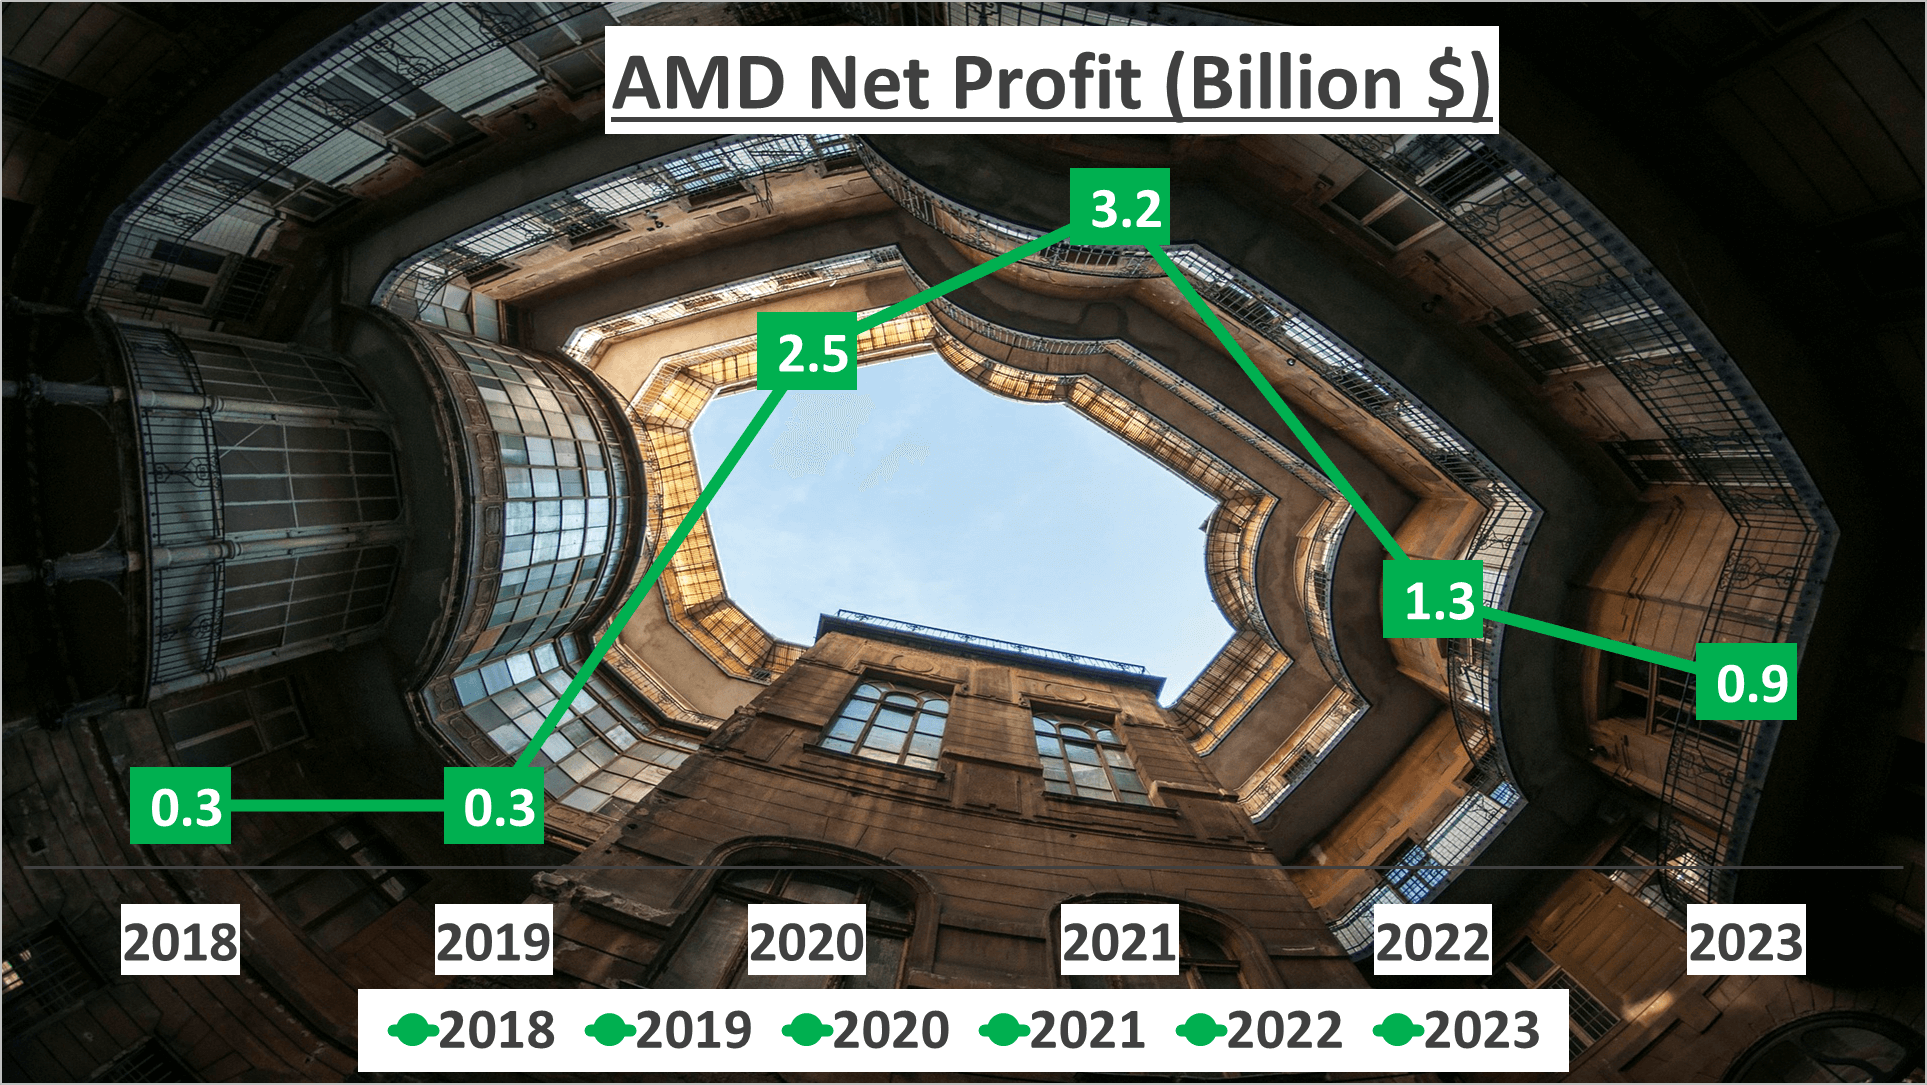
This growth rate underscores AMD’s consistent profitability despite temporary cost increases from the XilinX acquisition. Additionally, it’s crucial to understand that while the Gross Profit Margin centers on AMD’s core operations, the Net Profit Margin accounts for all expenses, including those beyond primary business operations such as costs associated with acquisitions like XilinX.
Therefore, while the Net Profit Margin saw a dip, the Gross Profit Margin offers a clearer depiction of AMD’s operational efficiency. Despite escalated costs, AMD’s profit margins and net profit growth signify robust financial performance.
Even amidst a temporary dip in Net Profit Margin, the company has demonstrated its ability to generate profits and augment shareholder value, affirming its potential for sustained long-term growth and stability.
AMD Stock Analysis: Assessing Assets and Liquidity
In 2023, AMD’s total assets reached $67.9B, with net assets totaling $56B. This reflected a marginal increase from the previous year, where total assets were $67.6B and net assets stood at $55B. A company’s assets gauge its wealth, while net assets depict its value after settling all debts.
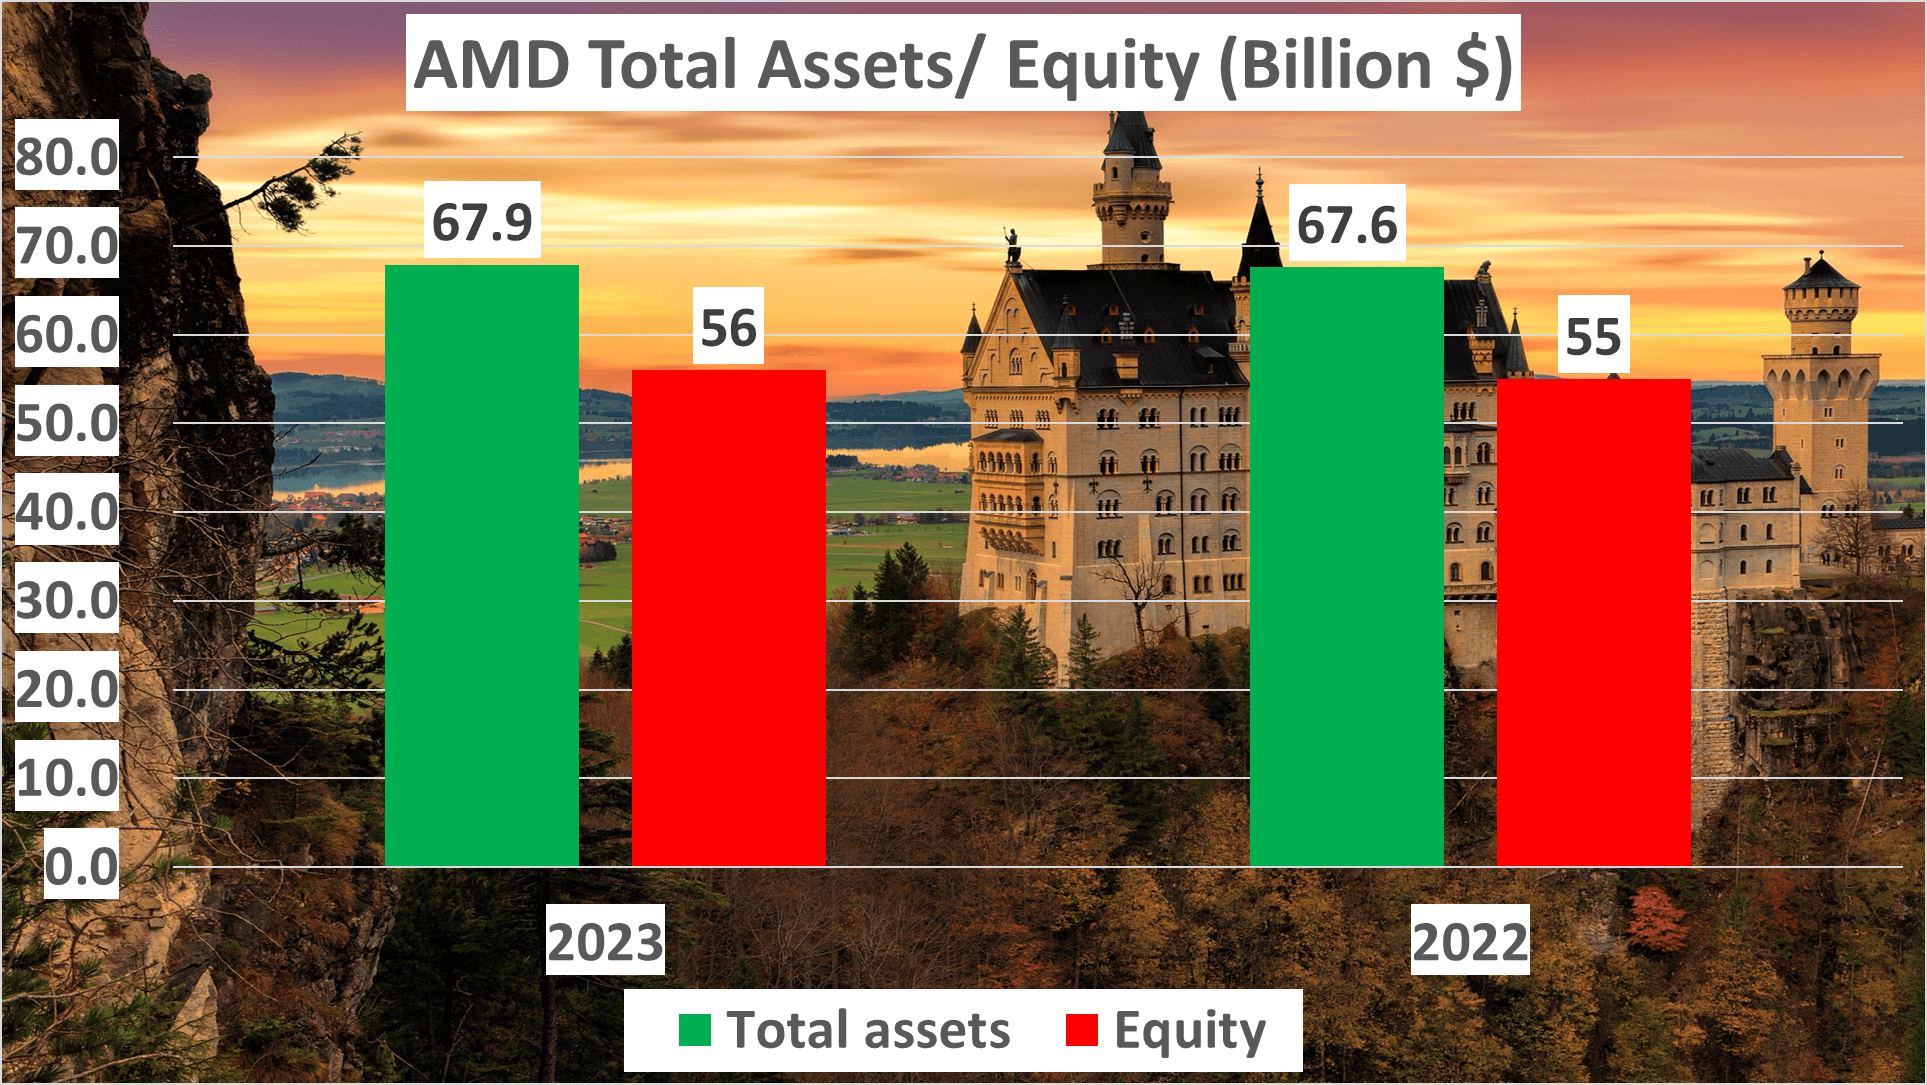
Examining the Equity to Total Assets ratio, it was 82% in 2023, slightly up from 81% in 2022. This ratio signifies a company’s financial leverage. A higher ratio suggests that a company finances its growth more with equity than debt, a favorable sign for investors. For AMD, it underscores the company’s robust financial standing and debt servicing capability.
Now, let’s delve into the Current Ratio and Quick Ratio. The Current Ratio, a liquidity metric, measures a company’s ability to settle short-term obligations. In 2023, AMD’s Current Ratio was 2.51, up from 2.34 in 2022. This healthy ratio indicates that for every dollar of current liabilities, AMD possesses $2.51 of current assets, signifying ample resources to cover short-term debts.
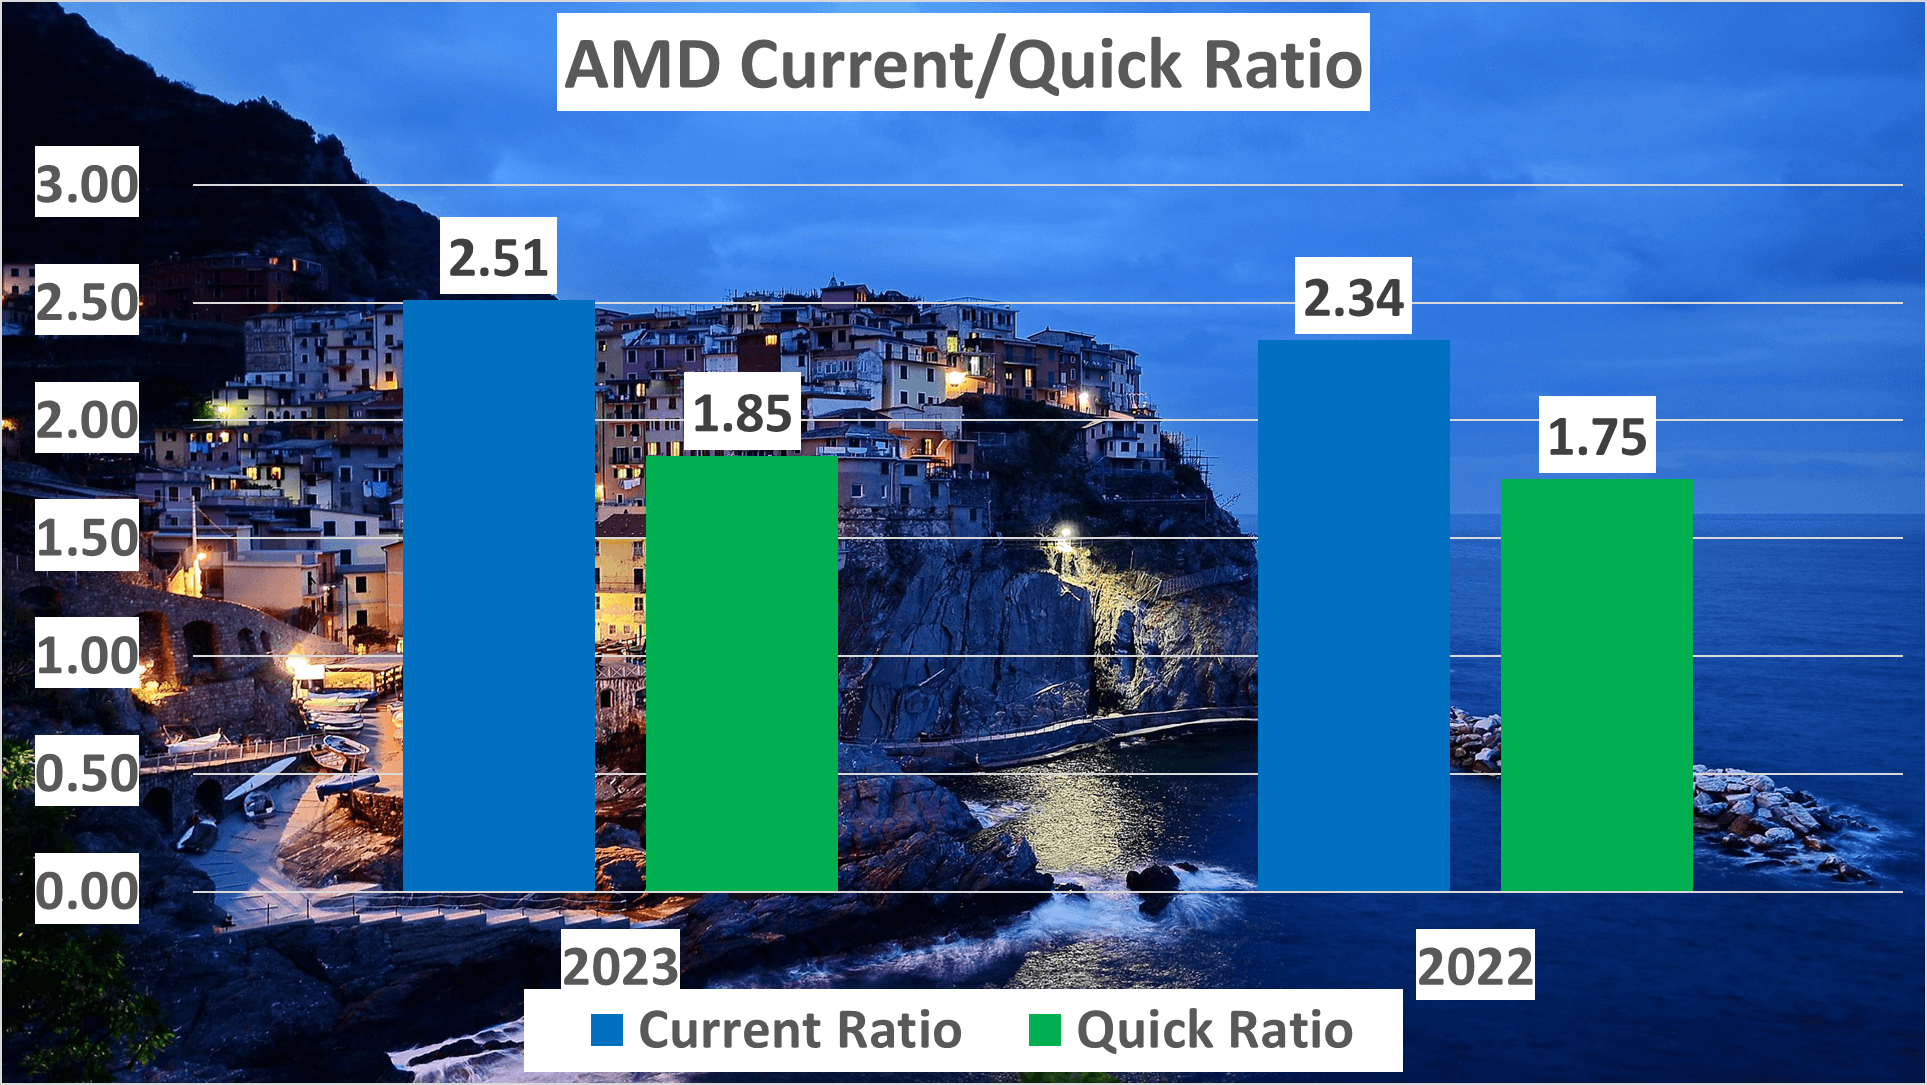
The Quick Ratio, also known as the acid-test ratio, further assesses liquidity by excluding inventory from current assets. AMD’s Quick Ratio in 2023 was 1.85, up from 1.75 in 2022. This suggests that even without considering inventory, AMD could comfortably meet short-term liabilities.
These ratios, in conjunction with the company’s sturdy asset base, depict a financially stable entity. AMD’s robust asset base and liquidity ratios underscore its financial stability, making it an appealing prospect for investors.
AMD Stock Analysis: Evaluating Operational Efficiency
AMD’s operational efficiency is evidenced by its Inventory Days and Receivable Days for 2023. Inventory Days, measuring the average time inventory is held before sale, increased to 132 days in 2023 from 120 days in 2022. This suggests a longer inventory holding period, influenced by factors like increased production or decreased sales.

Conversely, Receivable Days, indicating the average time taken to collect payment after a sale, rose to 76 days in 2023 from 63 days in 2022. This uptick suggests AMD may be offering more lenient credit terms to customers or experiencing delays in payment collection.
Shifting focus to cash flows, AMD’s Operating Cash Flow amounted to $1.7B in 2023, reflecting the cash generated from core business operations. This signifies AMD’s ability to generate sufficient cash to sustain and expand operations.
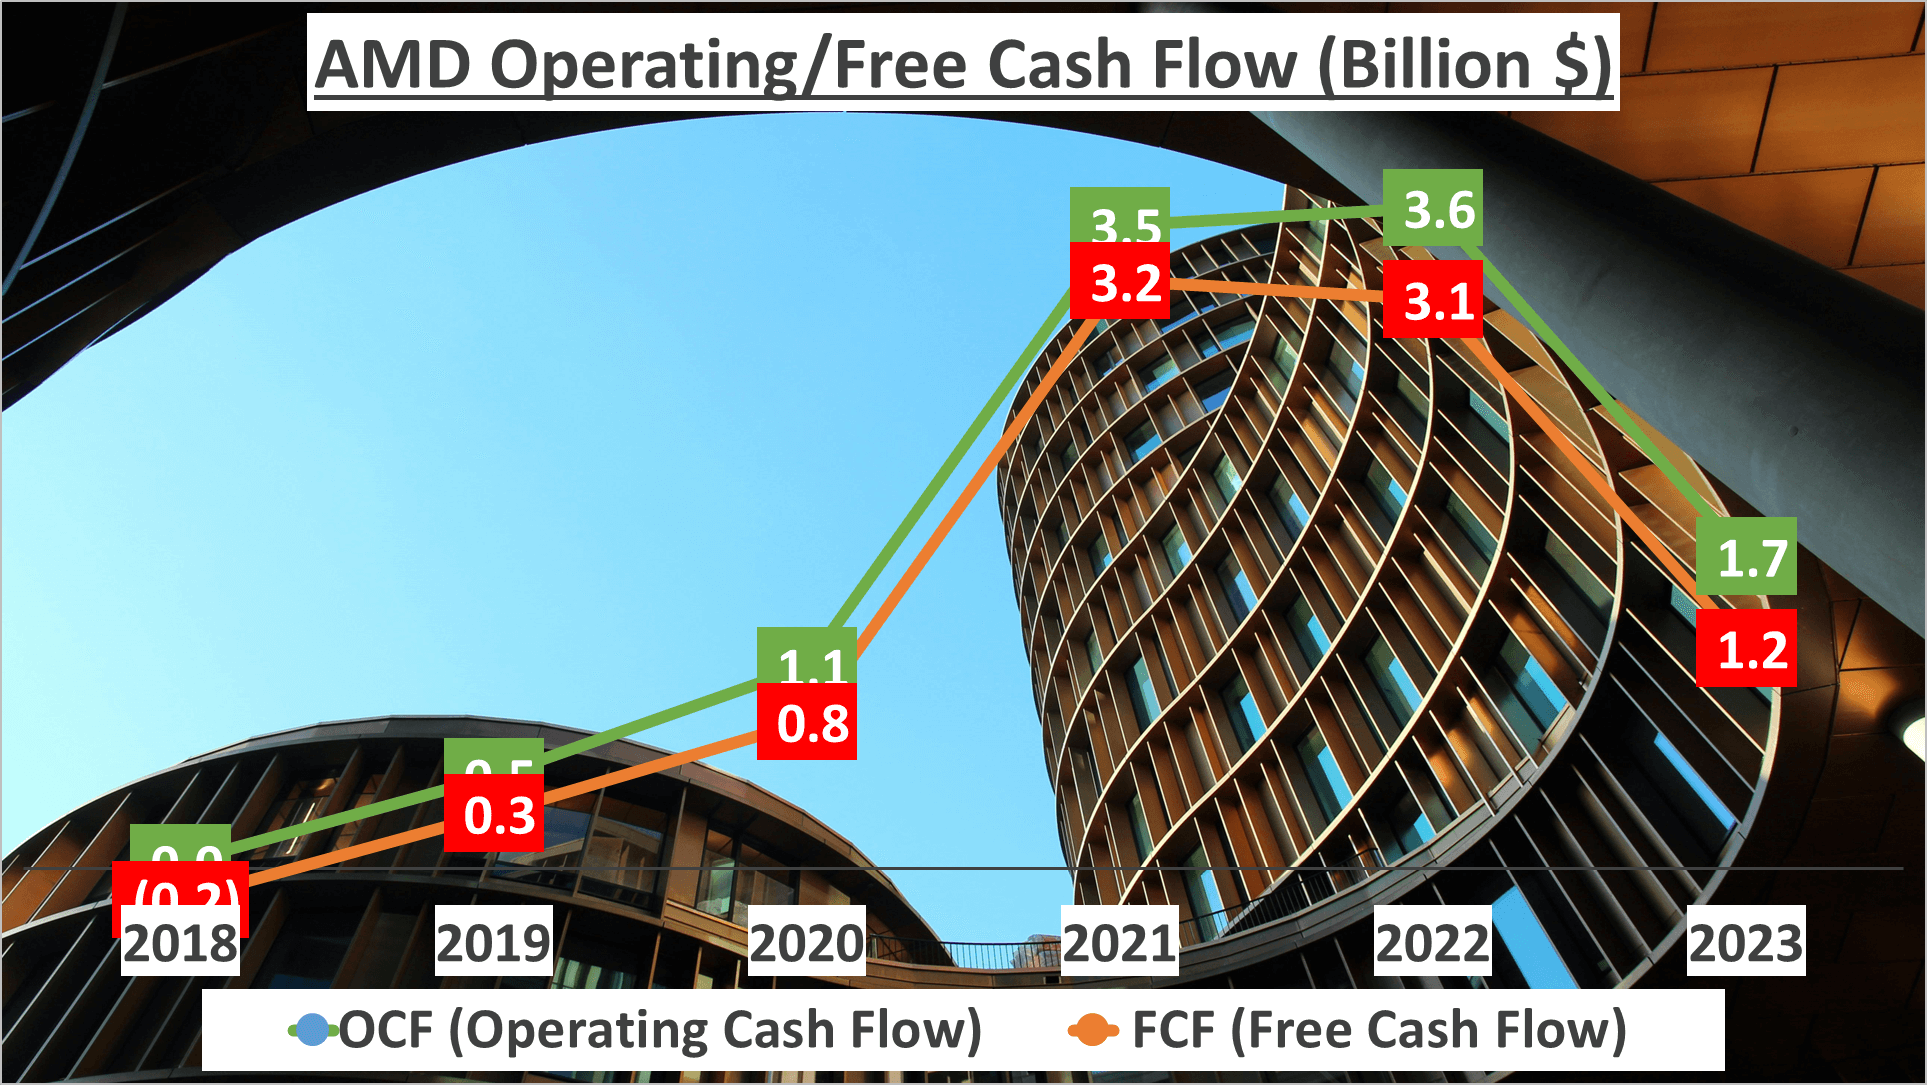
Furthermore, Free Cash Flow, representing cash generated after accounting for capital expenditures, reached $1.2B in 2023. This positive figure indicates AMD’s capability to repay debts, distribute dividends, and invest in new opportunities.
Now, let’s delve into the Dupont Analysis, dissecting Return on Equity (ROE) into three components: Net Profit Margin, Asset Turnover, and Asset to Equity. In 2023, AMD’s ROE stands at 2%, with a Net Profit Margin of 4%, Asset Turnover of 0.34, and Asset to Equity of 1.21.
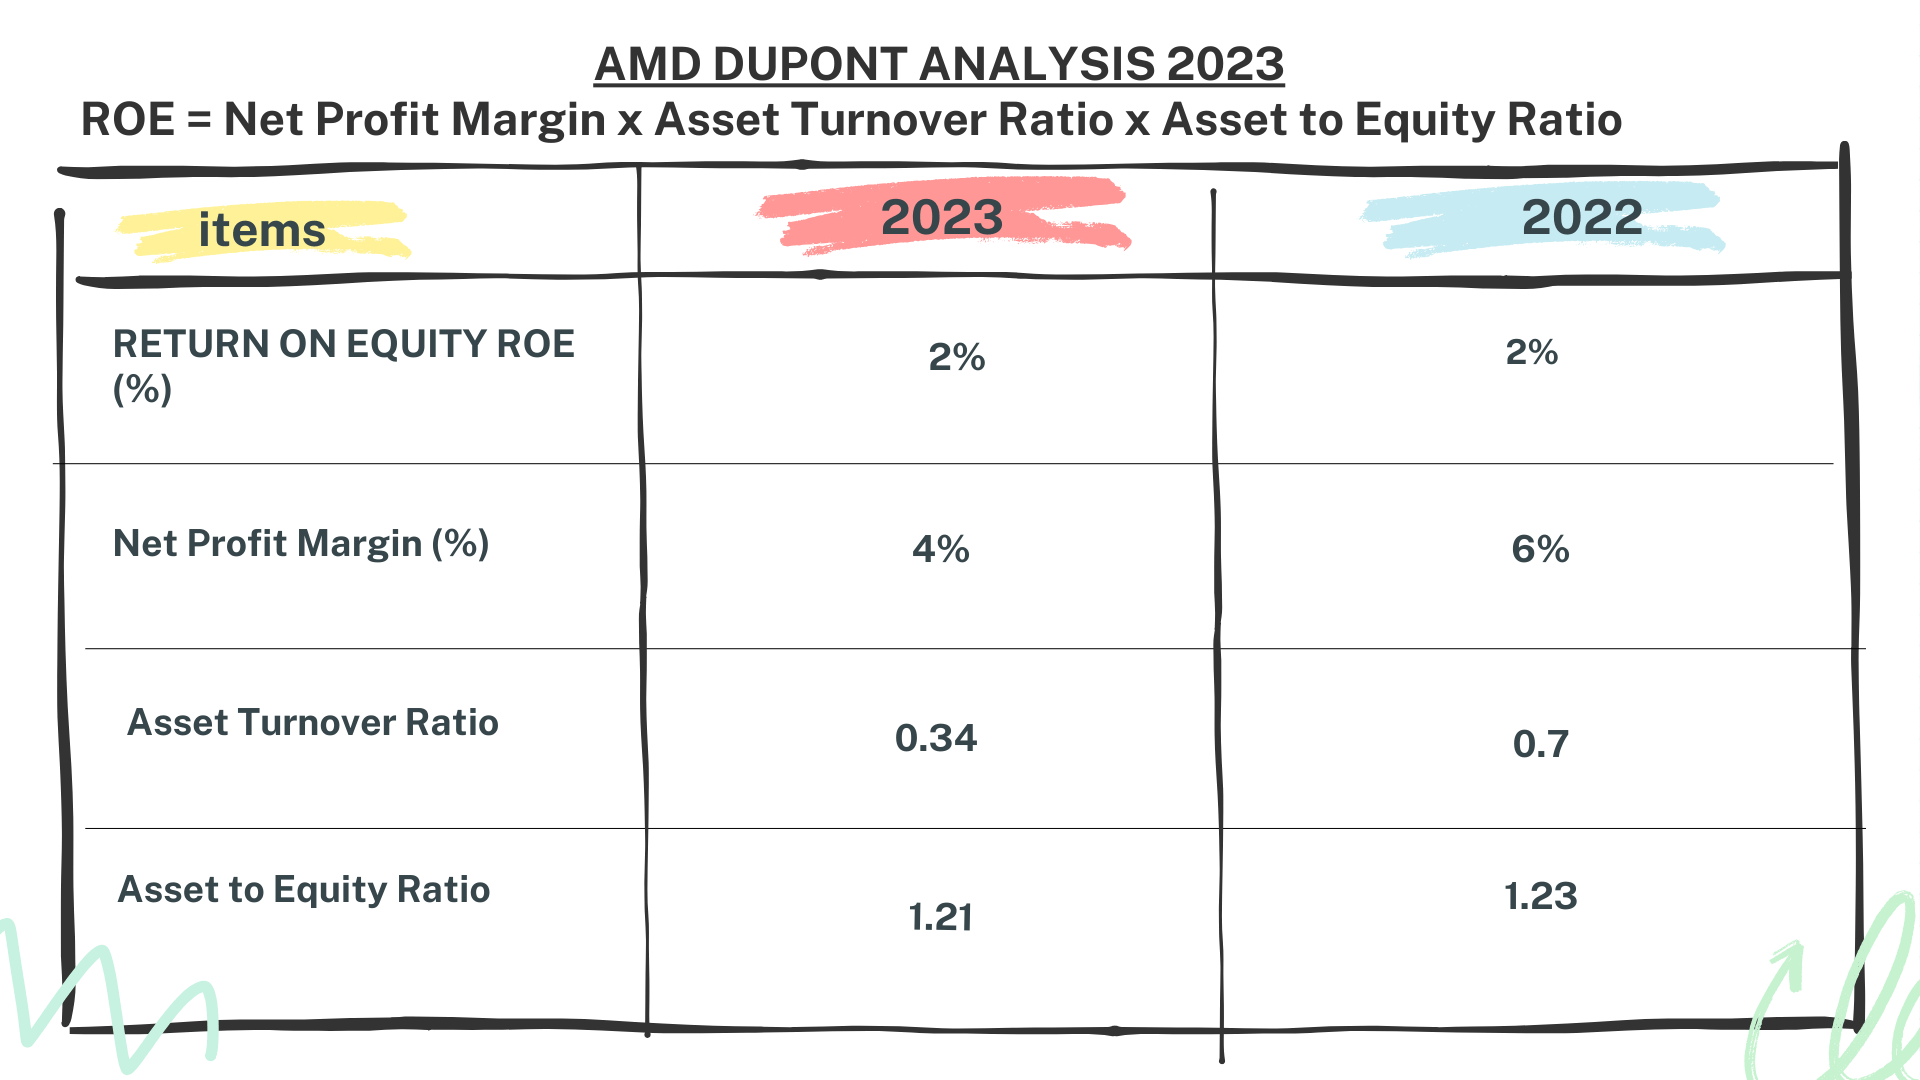
This analysis reveals that AMD’s ROE is predominantly driven by its Net Profit Margin and to a lesser extent by Asset Turnover and Leverage. Despite fluctuations, AMD’s operational efficiency and ROE indicate a solid financial performance, underlining a robust business model and strong financial health.
AMD Stock Analysis: Concluding Insights
What insights have we gleaned from our thorough examination of AMD’s financials?
The company has demonstrated consistent revenue growth, boasting a Compound Annual Growth Rate (CAGR) of 28% since 2018.
We’ve delved into the revenue stream distribution, noting significant contributions from diverse sectors such as Data Center, Client, Gaming, and Embedded.
AMD’s profit margins have remained robust, with a Gross Profit Margin of 50% in 2023, slightly surpassing the five-year average.
Despite cost escalations due to the Xilinx acquisition in recent years, net profit has steadily grown at an annual rate of 25%.
AMD’s asset base has steadily expanded, and its liquidity ratios indicate a healthy financial stance.
The company’s operational efficiency shines through Inventory and Receivable Days, while the Dupont Analysis offers insights into its Return on Equity.
Investing in AMD in 2018 would have proven astute, given its enduring financial prowess.
Stay tuned to our channel for more enlightening investment analyses.
Author: investforcus.com
Follow us on Youtube: The Investors Community

