Ever wondered how the financial performances of the two leading semiconductor companies in the United States, AMD vs. INTEL Stock Analysis, stack up? Advanced Micro Devices, or AMD, and Intel Corporation are titans of the semiconductor industry, each boasting unique strengths and market niches. AMD, a force in the gaming and data center sectors, has seen a positive growth trend in the past five years, while Intel, with its stronghold in client computing and data center and AI, has faced some challenges.
It’s a fascinating tale of two companies, each with its own strategies and trajectories in an industry that’s always evolving and innovating.
So, how do these tech giants fare when we take a closer look at their financials?
What do the numbers tell us about their successes, their challenges, and their potential future performance?
Let’s dive into their financials to get a clearer picture.
Revenue Overview – AMD vs. INTEL Stock Analysis
First, we’ll examine their total revenues. Advanced Micro Devices, or AMD, reported total revenues of 16.5 billion dollars over the past three quarters of 2023. Intel, on the other hand, reported a total revenue of 39 billion dollars for the same period.
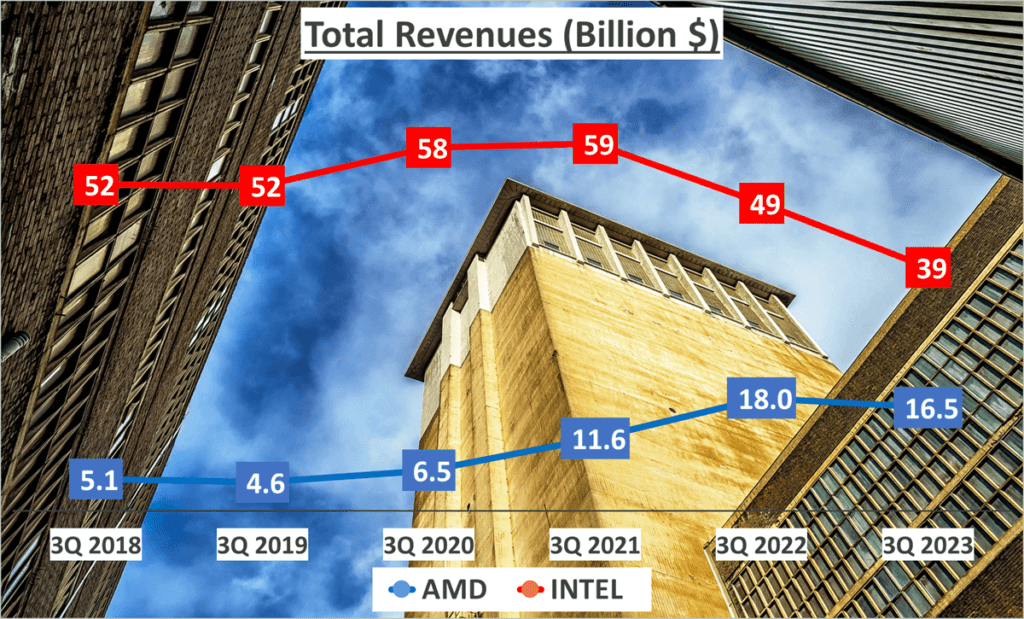
Now, let’s take a step back and look at the bigger picture. Over the last five years, AMD has grown its revenues at a Compound Annual Growth Rate, or CAGR, of 26%. Intel, however, has seen a negative CAGR of -6%. For those unfamiliar with the term, CAGR is a useful measure of growth over multiple periods. It provides a constant rate at which the company would have grown if the growth had compounded annually.
So, what does this tell us? AMD has been consistently increasing its revenues, showing positive growth over the past five years. Contrastingly, Intel has experienced a decline in its revenue growth.
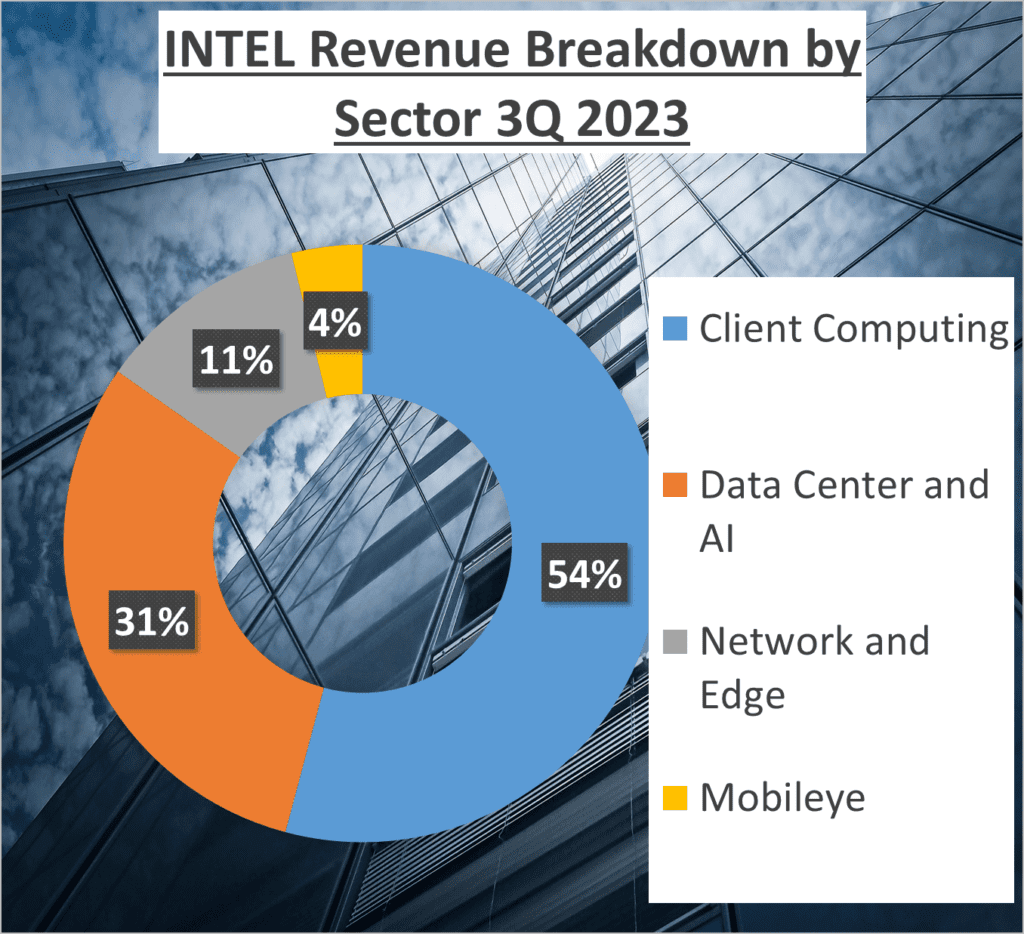
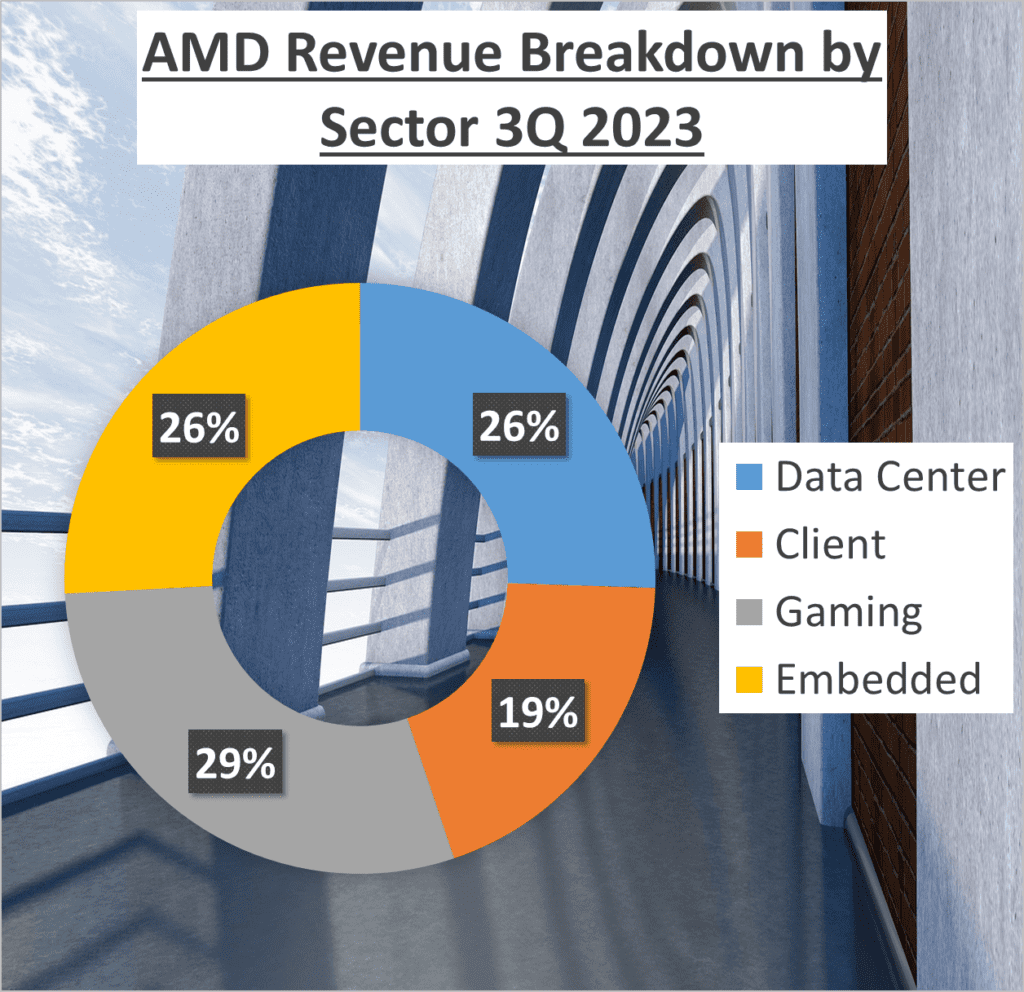
Now, let’s break down the revenue structure of both companies. AMD’s revenue comes from four main sectors – 26% from Data Center, 19% from Client, 29% from Gaming, and 26% from Embedded. Intel’s revenue, on the other hand, is split between 53% from Client Computing, 30% from Data Center and AI, 11% from Network and Edge, and 4% from Mobileye.
It’s interesting to see how each company diversifies its revenue streams. AMD has a more balanced revenue structure, with almost equal contributions from its four sectors. Intel, however, relies heavily on its Client Computing sector, which accounts for over half of its total revenue.
As we can see, both companies have shown different trends in revenue growth. AMD has displayed a steady rise, while Intel has struggled to maintain its revenue figures. This disparity in growth rates and revenue structure provides valuable insight into their financial health and strategic focus. In the next section, we will delve deeper into their profit margins to further understand their financial performance.
Profit Margins – AMD vs. INTEL Stock Analysis
Now, let’s look at profit margins, another key financial indicator.
Profit margins, both gross and net, are crucial in assessing a company’s profitability. They show how much of each dollar in sales a company keeps in earnings. Let’s start with gross profit margin. This is calculated by subtracting the cost of goods sold from total revenue and dividing that number by total revenue. It’s a measure of a company’s manufacturing and distribution efficiency during the production process.
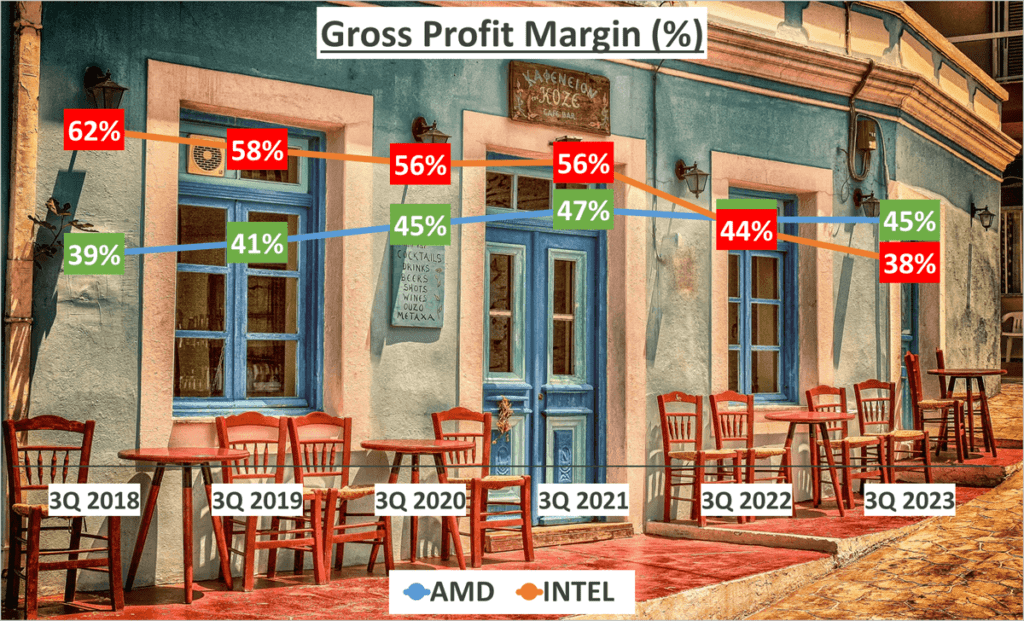
In the past three quarters of 2023, AMD’s gross profit margin was 45%, a slight increase from an average of 44% over the past five years. On the other hand, Intel’s gross profit margin was 38%, a marked decrease from an average of 52% over the same period. This suggests AMD maintained its production efficiency, while Intel experienced a significant decline.
Now, let’s move on to net profit margin. This is the percentage of revenue remaining after all operating expenses, interest, taxes and preferred stock dividends have been deducted from a company’s total revenue.
AMD’s net profit margin was 1% in the past three quarters of 2023, compared to an average of 8% over the past five years. Intel, however, posted a -3% net profit margin, a sharp decline from an average of 21% over the same period. This indicates that both companies have seen a decrease in profitability, with Intel experiencing a more significant drop.
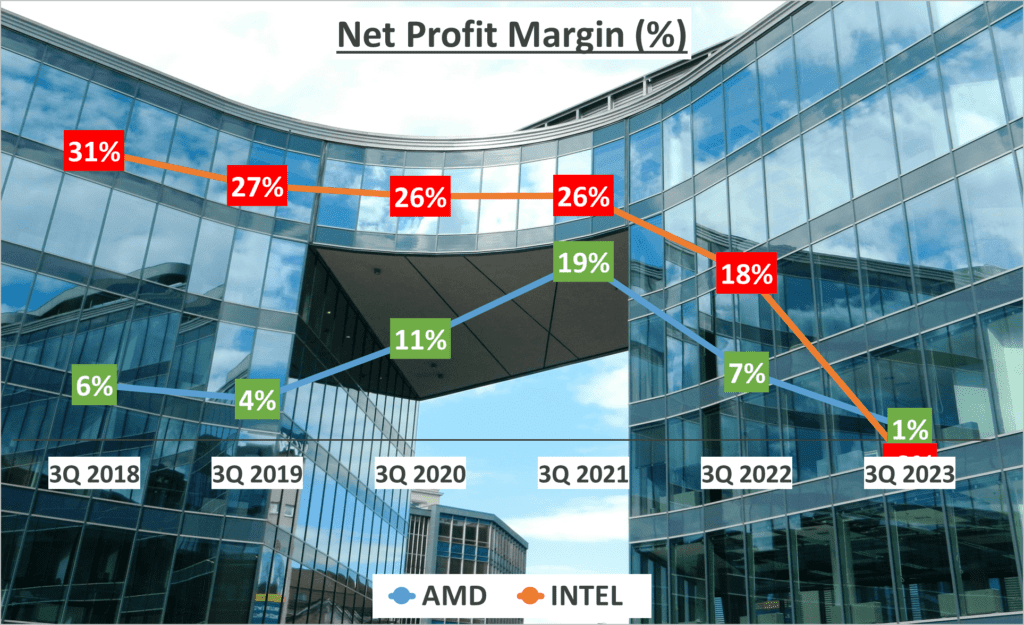
So, what does all this mean? Well, profit margins are a key measure of how well a company is managing its costs. A decrease in profit margins over time can indicate a company is having trouble controlling its costs, which could impact its bottom line and, ultimately, its stock price.
It’s clear that both companies have experienced changes in their profit margins. The question for potential investors is whether they believe these companies can reverse these trends and improve their profitability in the future. After all, profitability is a key driver of shareholder value.
Balance Sheet Analysis – AMD vs. INTEL Stock Analysis
Let’s move on to the balance sheet analysis.
In this part, our focus will be on three main elements: total assets, net assets, and the equity to total assets ratio. To start with, total assets represent everything a company owns, including cash, investments, property, and so on. It’s the sum of a company’s liabilities and shareholders’ equity.
As of the third quarter in 2023, AMD’s total assets amounted to 68 billion dollars, while Intel boasted a significantly higher figure of one hundred and 89 billion dollars.
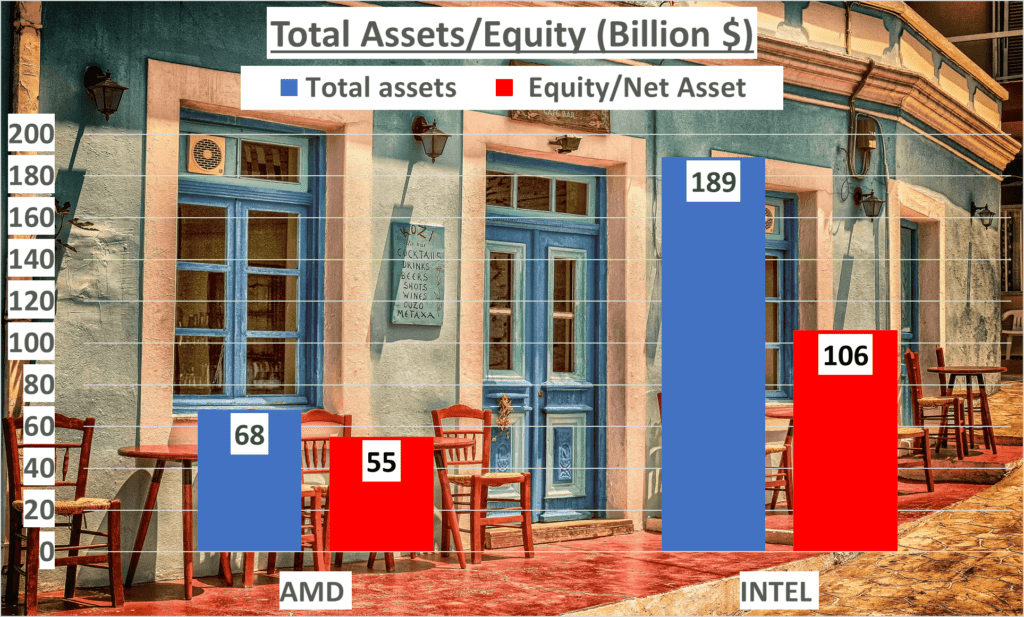
On the other hand, net assets, or shareholders’ equity, is what remains after subtracting all the company’s liabilities from its total assets. It provides an indication of the company’s net worth. AMD’s net assets stood at 55 billion dollars, while Intel’s were almost double, at 106 billion dollars.
Now, the equity to total assets ratio is a measure of a company’s financial leverage. It tells us what proportion of the total assets is financed by the shareholders’ equity. The higher the ratio, the less reliant the company is on borrowed money. AMD’s ratio was at 81%, indicating a lower dependence on debt compared to Intel, whose ratio was 56%.
These numbers are not just mere figures on a balance sheet. They provide a wealth of information about the company’s financial health. A company with a high equity to assets ratio, like AMD, shows that it is primarily financed by its shareholders. This could mean lower risk for investors as the company is less reliant on borrowed money.
On the flip side, a lower ratio, like Intel’s, means the company is heavily dependent on debt financing. While debt can provide the necessary capital for growth, it also comes with the burden of interest payments, which can affect the company’s profitability and cash flow.
These figures give us a deeper understanding of both companies’ financial health.
Operational Efficiency and Cash Flow – AMD vs. INTEL Stock Analysis
Next, we’ll analyze their operational efficiency and cash flow.
Operational efficiency is a critical aspect to consider when evaluating a company’s performance. It encompasses how well a company uses its resources, and how effectively it manages its operations. One way to measure this is by looking at inventory days. This refers to the average number of days that items remain in inventory before they’re sold. For AMD vs. Intel Stock Analysis, these figures stand at 124 days and one hundred 38 days respectively.
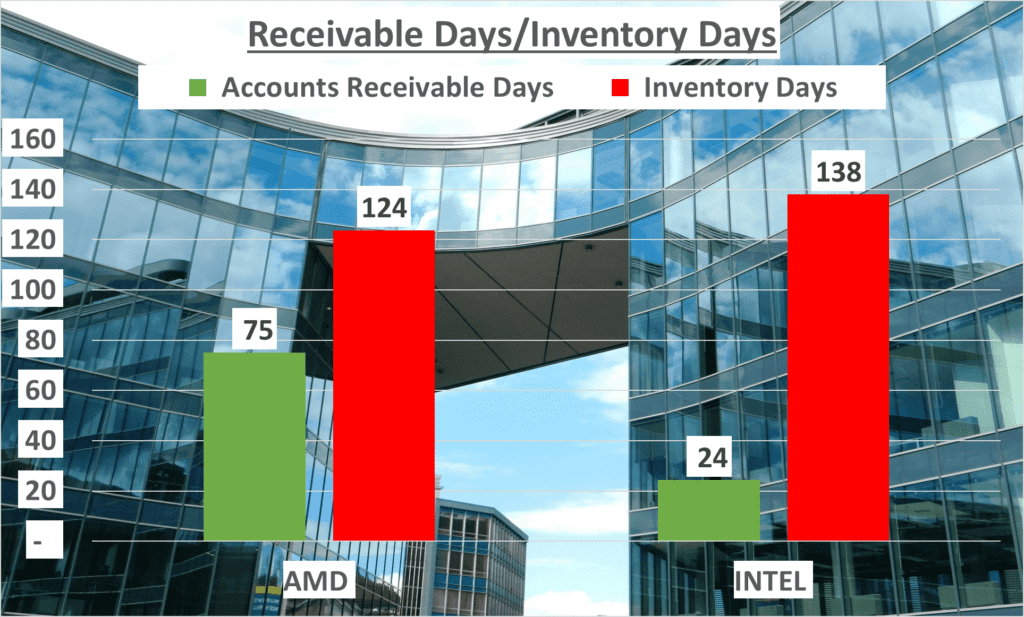
These lengthy inventory days suggest room for improvement in managing stock turnover.
Accounts Receivable Days is another measure of operational efficiency. It represents the average number of days it takes for a company to collect payment after a sale has been made. In this case, AMD takes around 75 days to collect its dues, whereas Intel is significantly quicker, taking only 24 days.
This could indicate a more efficient collection process on Intel’s part.
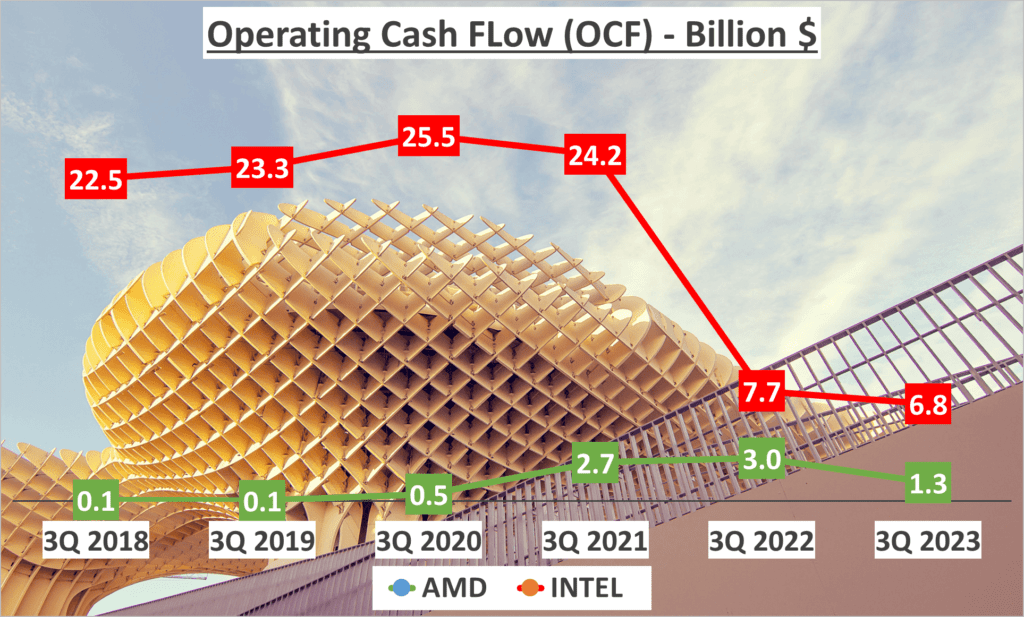
Now, let’s shift our focus to cash flow, an essential indicator of a company’s financial health. Operating Cash Flow, or OCF, is the cash generated from regular business operations. AMD’s OCF stands at 1.3 billion dollars, while Intel’s is significantly higher at 6.8 billion dollars.
However, Free Cash Flow, or FCF, tells a slightly different story. This is the cash a company generates after accounting for capital expenditures like buying property or equipment. AMD has a FCF of 900 million dollars, whereas surprisingly, Intel’s FCF is in the negative, at -12 billion dollars.
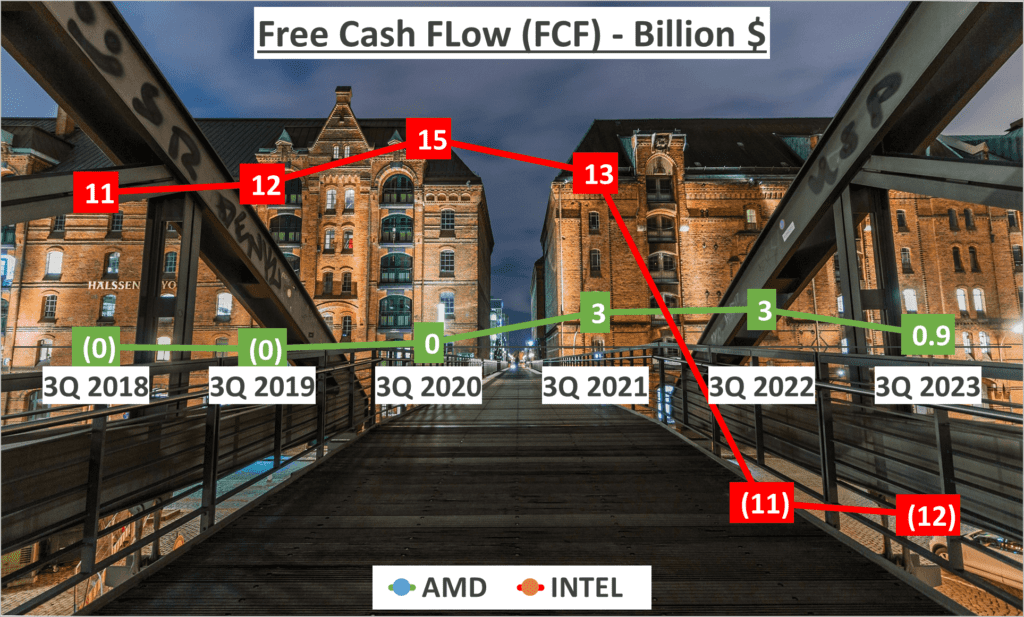
This could indicate heavy investment in infrastructure or other capital-intensive areas.
Lastly, we look at the ratio of OCF to Net Income. This measures how well a company’s profits are mirrored in its cash flow. AMD shows a ratio of 6.5, suggesting a healthy correlation between profit and cash flow. However, Intel’s ratio is a negative seven, indicating a disconnect between profitability and cash generation.
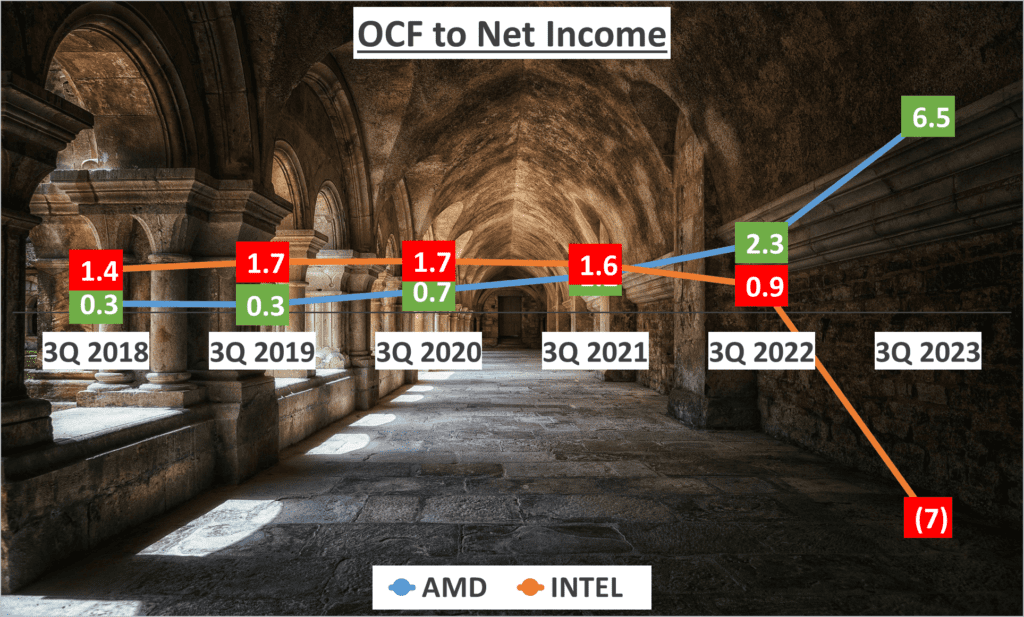
This data gives us insights into their operational efficiency and cash flow management.
Dupont Analysis – AMD vs. INTEL Stock Analysis
Finally, we’ll look at the DuPont Analysis. This method breaks down Return on Equity, or ROE, into three components: Net Profit Margin, Asset Turnover, and Equity Multiplier.
For the third quarter of 2023, AMD’s ROE is 0.5%. The company has a Net Profit Margin of 1%, an Asset Turnover of 0.33, and an Equity Multiplier of 1.23.
On the other hand, Intel’s ROE stands at -1%. This is reflected in its Net Profit Margin of -3%, an Asset Turnover of 0.28, and an Equity Multiplier of 1.79.
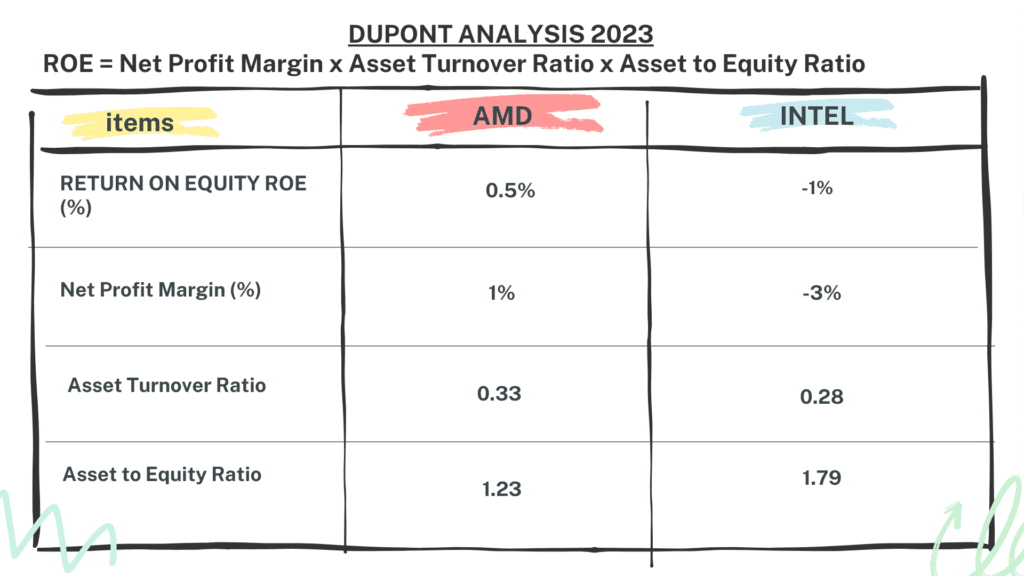
The DuPont Analysis is significant as it provides a comprehensive view of a company’s profitability. It allows us to understand how effectively the business is using its assets to generate profits and how much of those profits are being returned to shareholders.
This analysis provides a comprehensive view of both companies’ profitability.
Conclusion – AMD vs. INTEL Stock Analysis
Let’s wrap up our analysis of AMD vs. INTEL Stock Analysis financial performance.
When comparing the revenue of these two tech giants, we see a striking difference. AMD has shown a consistent upward trajectory with a compound annual growth rate of 26% over the last five years, while INTEL has seen a decline with a -6% growth rate over the same period.
Diving into the profit margins, AMD has maintained a steady gross profit margin of 45%, compared to INTEL’s declining margin, which currently stands at 38%. Both companies have experienced a significant drop in their net profit margins, however, INTEL’s decrease is much more pronounced.

From a balance sheet perspective, AMD’s total assets at the end of the third quarter of 2023 were 68 billion dollars, while INTEL’s were a whopping one hundred and 89 billion dollars. However, AMD’s equity to total assets ratio stands at a healthy 81%, significantly higher than INTEL’s 56%.
In terms of operational efficiency and cash flow, both companies have large inventory days, indicating room for improvement. AMD’s operating cash flow is 1.3 billion dollars, while INTEL’s is 6.8 billion dollars. However, INTEL’s free cash flow is in the negative, at -12 billion dollars, pointing to potential liquidity issues.
The Dupont Analysis further paints a clear picture. AMD’s return on equity is 0.5%, while INTEL’s is at -1%. The asset turnover for AMD is 0.33, while INTEL’s is 0.28. Despite having a larger asset base, INTEL’s lower asset turnover and negative net profit margin have led to a negative return on equity.
In conclusion, while both AMD vs. INTEL Stock Analysis are leaders in their industry, their financial performance over the past five years tells two very different stories. AMD’s growth and stable profit margins contrast sharply with INTEL’s declining revenues and profit margins.
Remember, understanding a company’s financials is crucial before making any investment decisions.
Watching more on Youtube:
Author: InvestForcus.com
Follow us on Youtube: The Investors Community
