ARM Stock Analysis – What if you had invested $1000 in ARM in September 2023? Imagine for a moment that you decided to invest $1000 in ARM when it debuted on the Nasdaq in September 2023. Fast forward to today, March 2024, and you’d find your investment has more than doubled, now worth $2627. That’s a whopping 163% increase in only 6 months!

What lies beneath this remarkable growth? Is it merely a stroke of luck, or does it stem from a robust business strategy? In today’s rapidly evolving landscape, particularly with the burgeoning demand for AI chips, ARM’s role is increasingly pivotal.
To answer these questions, we’ll need to dive deep into the financials and business performance of ARM. So, prepare to join us on a journey as we unravel the numbers, explore the strategies, and dissect the financial health of ARM.
From revenue analysis to profit margins, and from assets and liabilities to cash flow, we’ll cover it all.
Revenue Analysis – ARM Stock Analysis
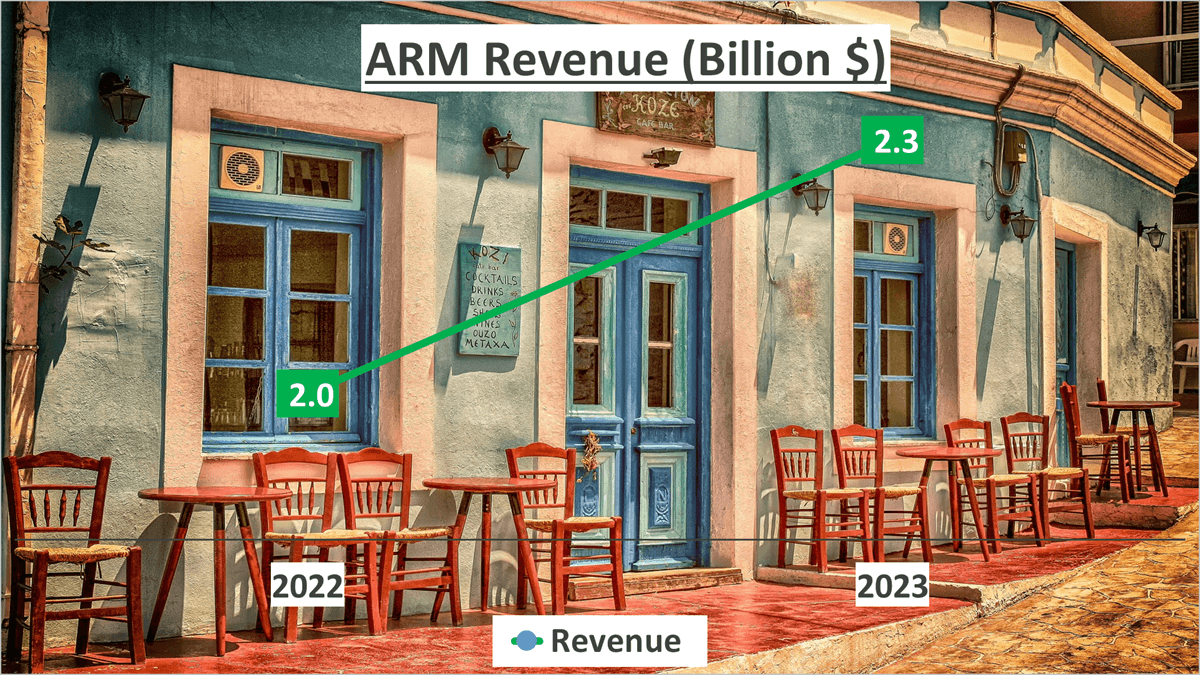
Let’s delve into ARM’s revenue figures. The company witnessed substantial growth from 2022 to 2023. Over the course of three quarters in 2023, ARM’s revenue amounted to approximately $2.3B, reflecting a 15% increase compared to the same period in 2022, when it stood at around $2B.
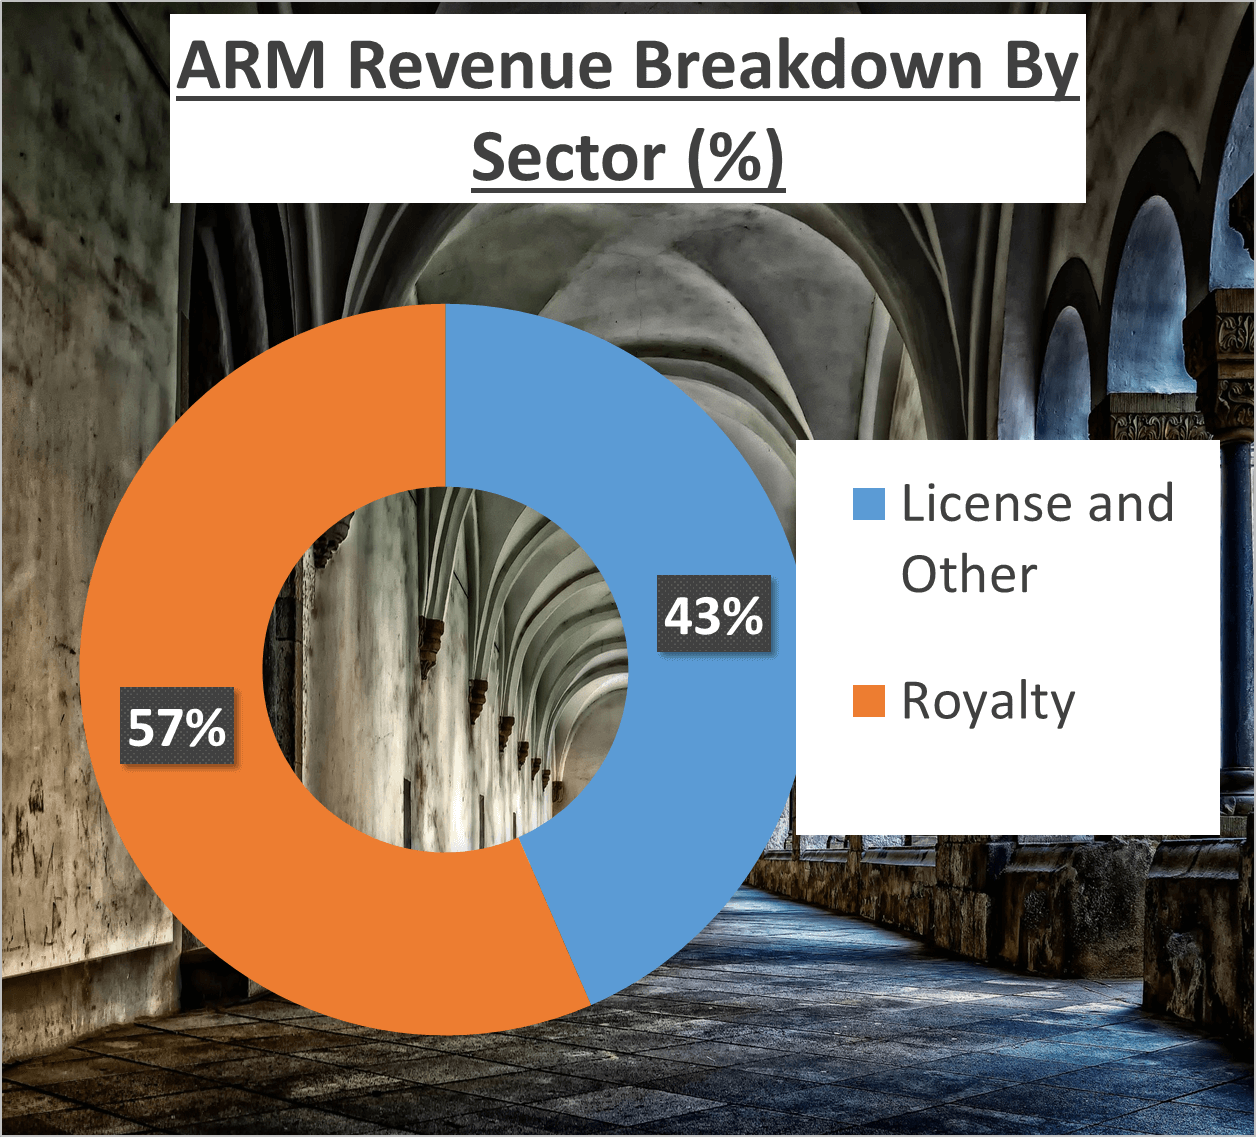
A detailed examination of ARM’s revenue streams reveals a well-balanced blend. Licensing and related segments contributed to approximately 43% of the revenue, with the remaining 57% derived from royalties.
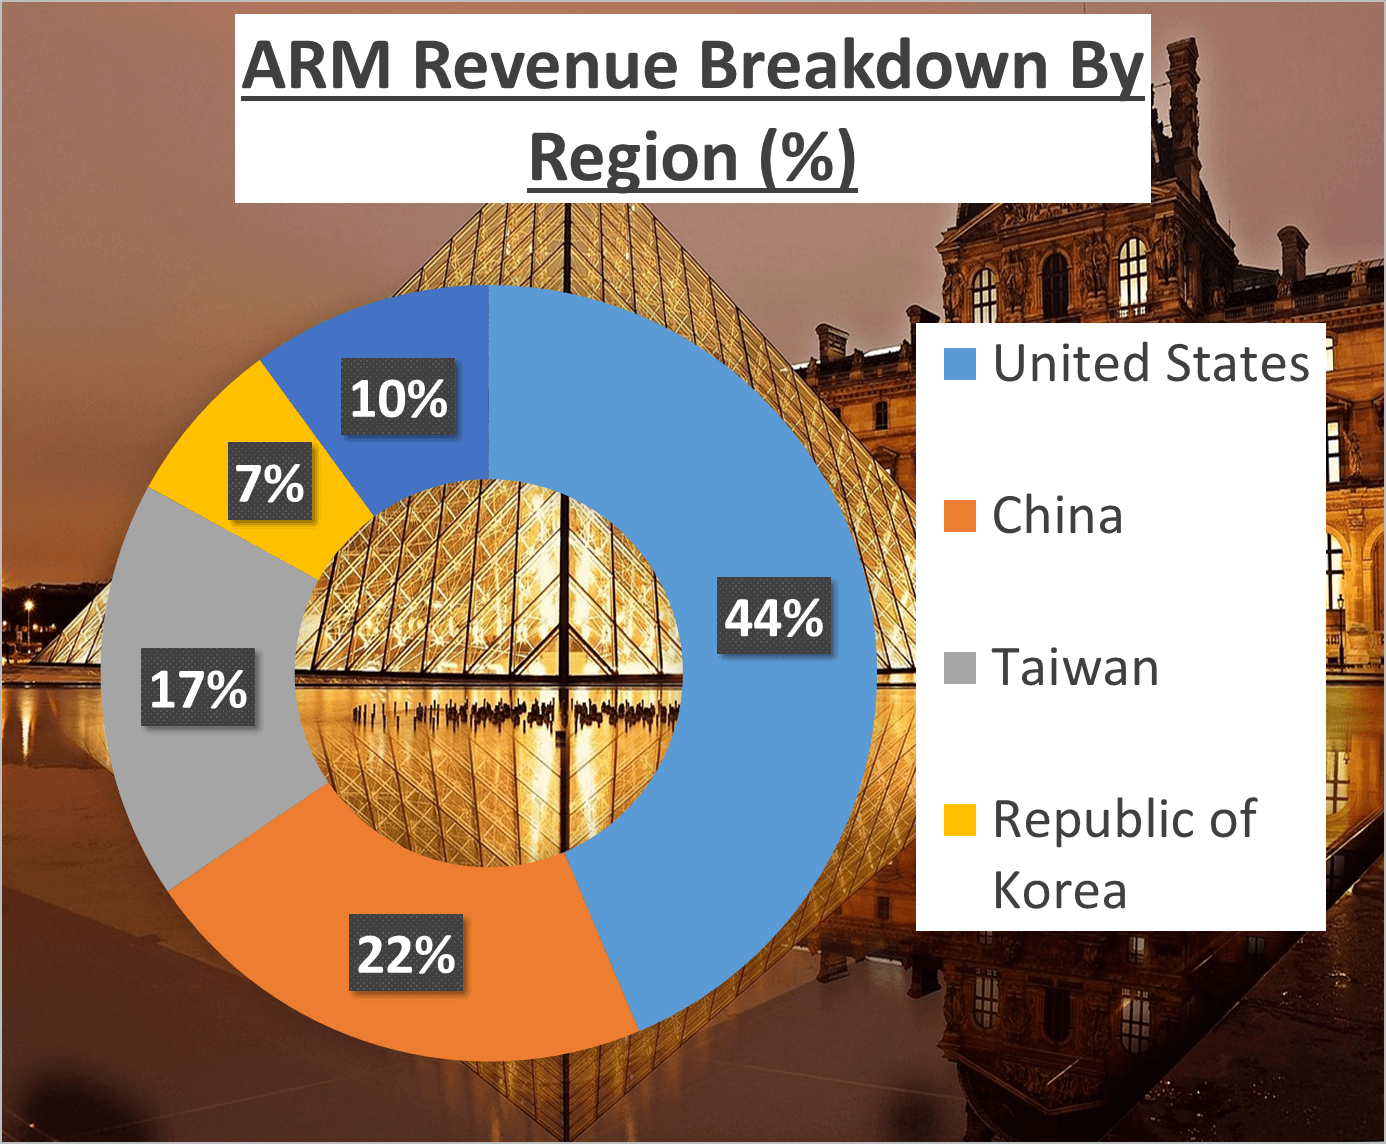
Now, shifting focus to the geographical breakdown of ARM’s revenue, the United States emerged as the primary contributor, comprising a significant 43% of the total revenue. China followed closely, accounting for 22%, while Taiwan and the Republic of Korea contributed 17% and 7%, respectively. The remaining 10% originated from various other global regions.
What does this signify? ARM’s revenue streams exhibit diversity not only in their nature but also in their geographical origins. This diversified revenue base empowers ARM to access varied markets, mitigate risks, and reduce dependency on any single economy.
Moreover, the balanced revenue mix between licensing and royalties underscores ARM’s sound business model. While licensing secures a steady revenue stream, royalties, tied to the performance of ARM’s technologies in the market, present opportunities for growth.
In essence, ARM’s revenue analysis portrays a company with a resilient and diversified revenue foundation. This diversity, encompassing revenue sources and geographical dispersion, serves as a strong indicator of ARM’s growth potential and its capacity to navigate economic fluctuations effectively.
Profit Margin – ARM Stock Analysis
Profit margin serves as a crucial indicator of financial well-being, reflecting ARM’s strategic investment and long-term planning journey.
Let’s begin with the gross profit margin. Throughout 2022 and 2023, ARM consistently maintained a robust gross profit margin of 96%, showcasing its adeptness in managing direct production costs efficiently.
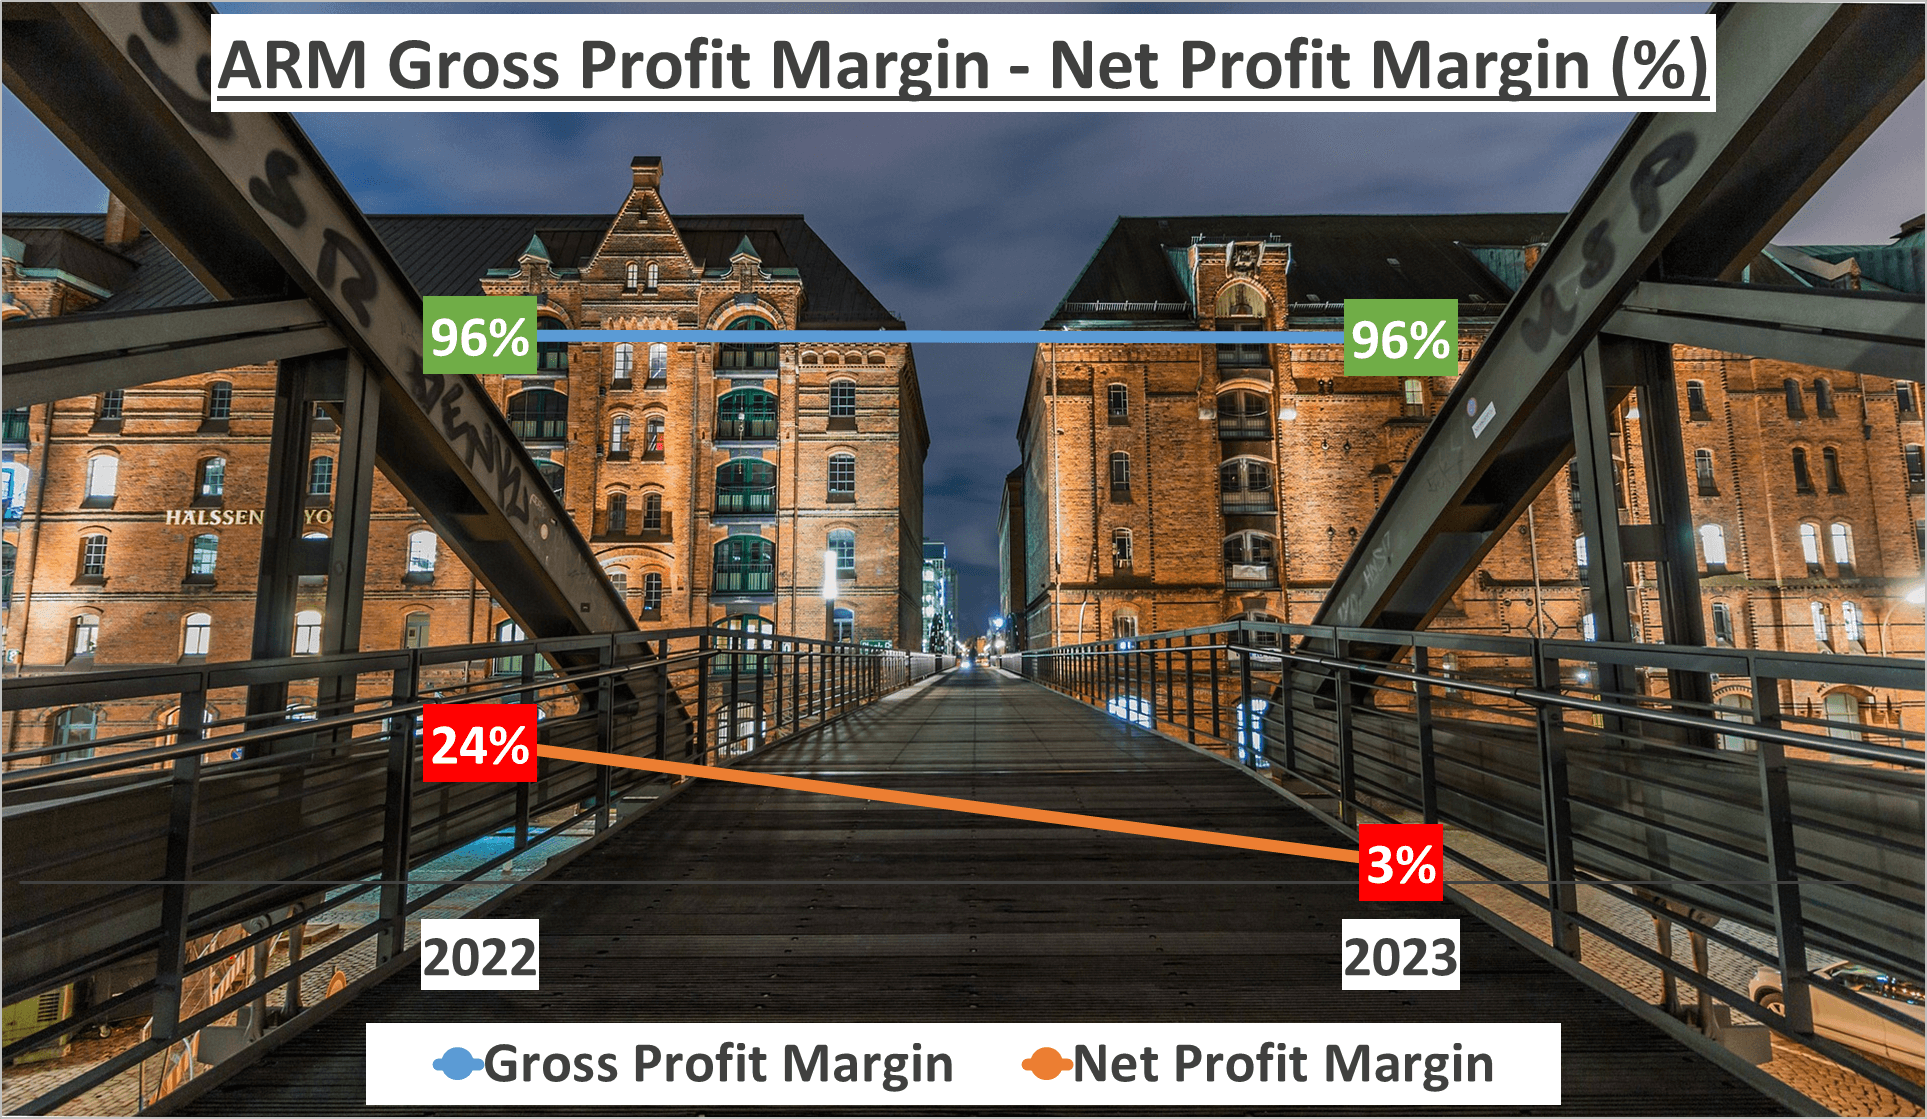

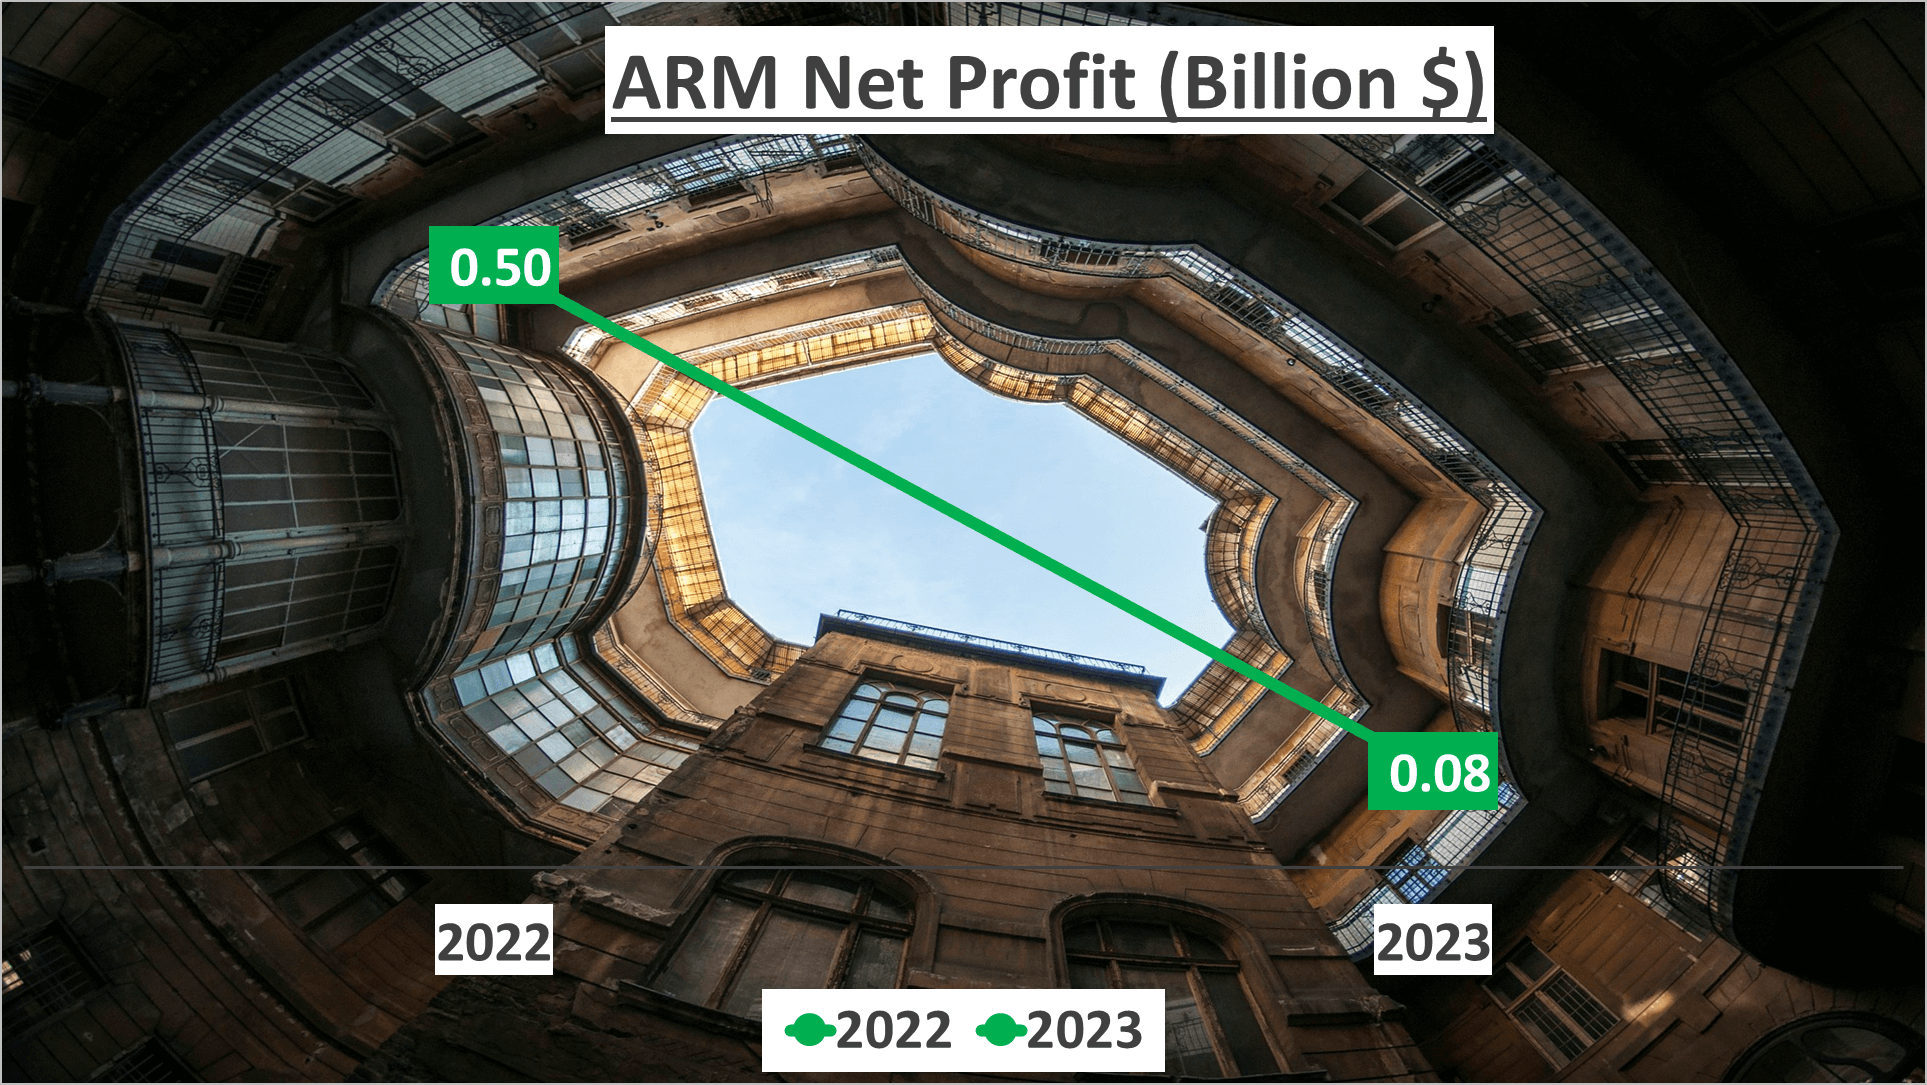
However, the narrative shifts when we examine the net profit margin. In 2023, ARM reported a net profit margin of merely 3%, a notable contrast to the 24% reported in the prior year. This substantial decrease may initially raise concerns, but understanding the underlying reasons is imperative.
The decline in the net profit margin for 2023 can be attributed to escalated expenditures in research and development (R&D) and selling, general, and administrative (SG&A) areas. In 2023, the R&D-to-revenue ratio surged to 61%, up from 39% in 2022, while the SG&A-to-revenue ratio rose from 24% in 2022 to 30% in 2023.
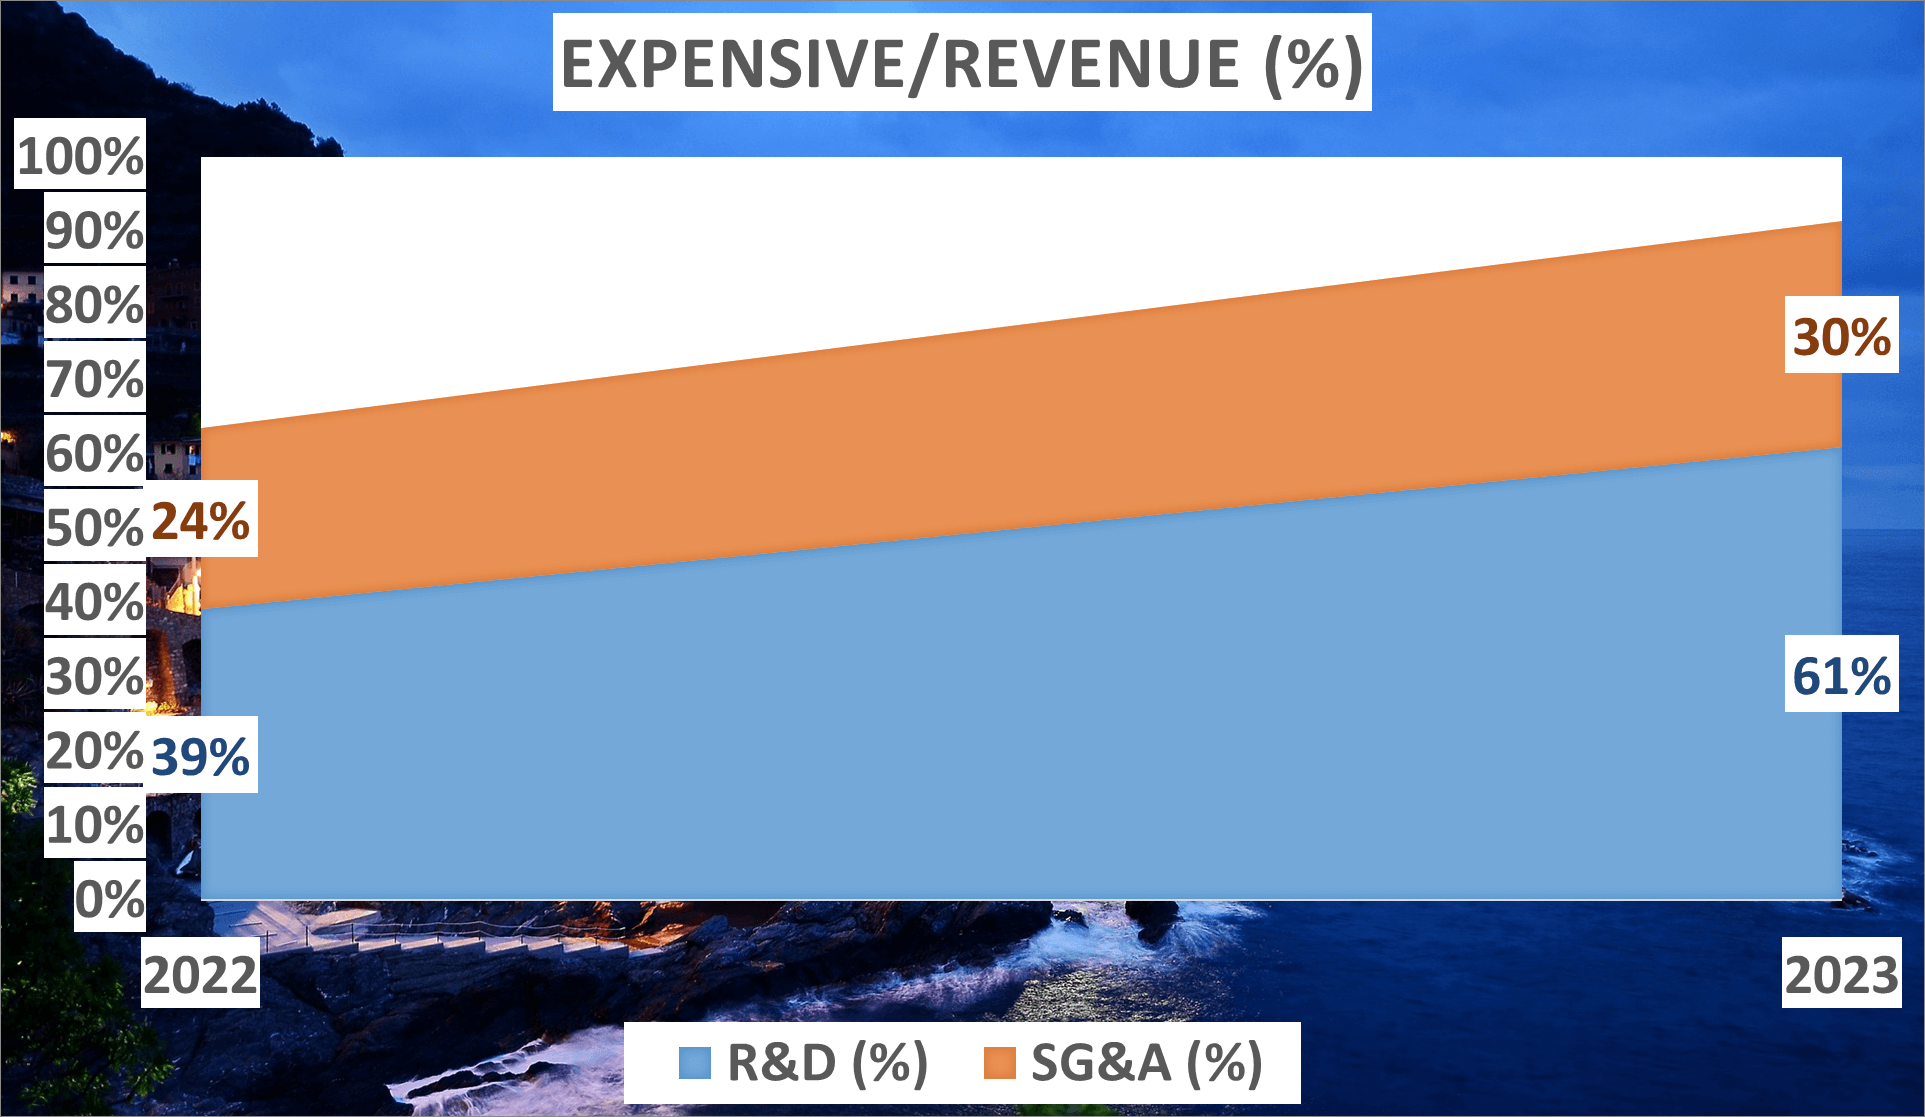

But why the sudden surge in expenses? It’s all part of ARM’s strategic vision to fortify its future. By intensifying investments in R&D, ARM aims to bolster its innovation capabilities, develop new technologies, and solidify its market standing in the long haul. Similarly, the increase in SG&A expenses underscores ARM’s dedication to expanding its operations and enhancing its market presence.
Though the dip in ARM’s net profit margin may appear alarming at first glance, it underscores strategic decisions aimed at fostering long-term growth. The augmented focus on R&D and SG&A expenses underscores ARM’s commitment to sustainable expansion.

In essence, ARM’s strategic approach signals its determination to excel in the long run, emphasizing its steadfast pursuit of enduring success.
Assets and Liabilities – ARM Stock Analysis
A company’s assets and liabilities offer valuable insights into its financial position.
In 2023, ARM’s total assets amounted to $7.1B, slightly up from $6.9B in 2022, signaling an expansion in the company’s resources for revenue generation.
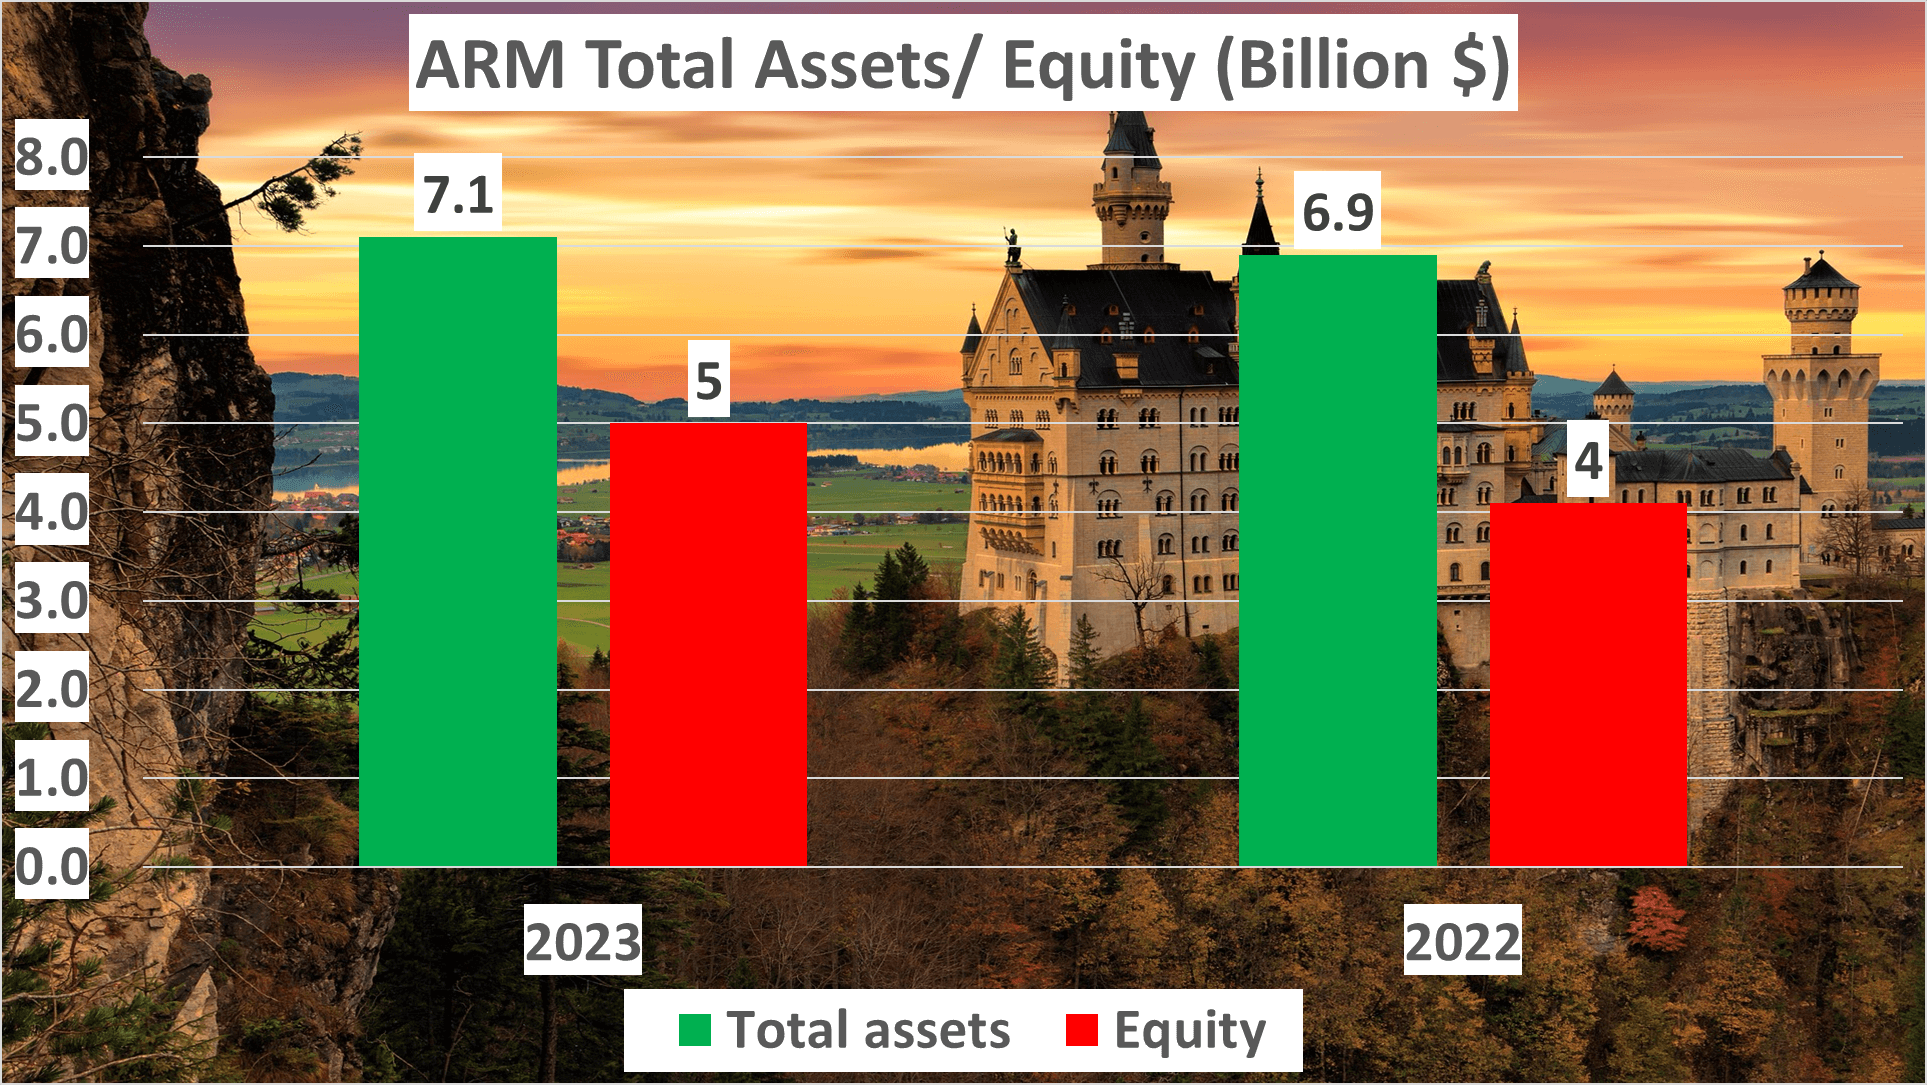

Net assets, reflecting the company’s value after subtracting total liabilities, reached $5B in 2023, a notable increase from $4B in the previous year, indicating improved financial health.
The equity to total assets ratio increased to 70% in 2023 from 59% in 2022, indicating a higher proportion of assets financed by shareholders, a positive signal for investors.
Moving on to the current ratio, which measures a company’s ability to cover short-term liabilities with short-term assets, ARM maintained a ratio of 0.49 in both 2023 and 2022.
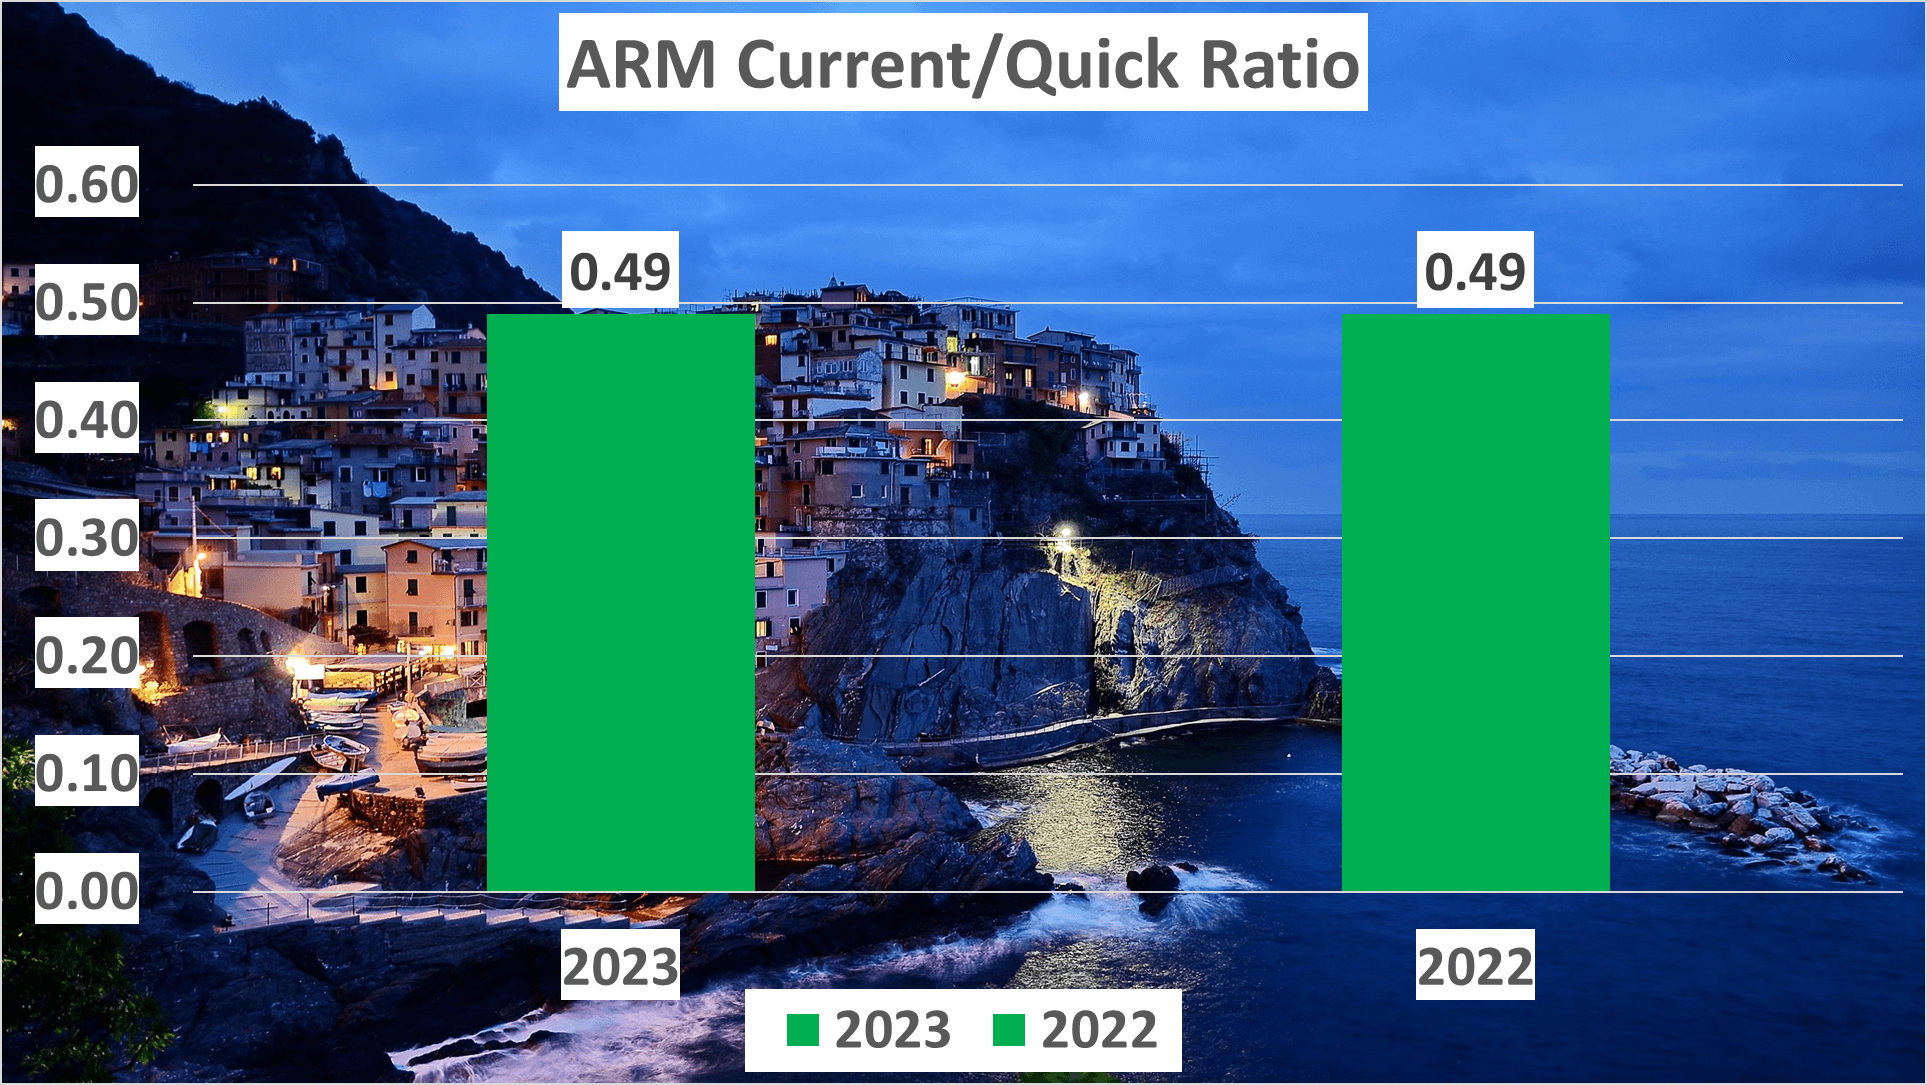

While this suggests short-term liabilities exceeding assets, it’s important to note that tech companies like ARM often operate comfortably with lower current ratios due to their cash generation capabilities and business model.
In summary, ARM’s financial standing has significantly improved over the past year, showcasing growth and strength despite areas for attention such as the current ratio.
Cash Flow and Receivable Days – ARM Stock Analysis
Let’s delve into ARM’s cash flow and receivable days, pivotal aspects for financial assessment. Cash flow, representing the movement of money within a business, is a key indicator of its financial robustness. In 2023, ARM’s operating cash flow reached $0.4B, slightly up from the previous year’s $0.3B.
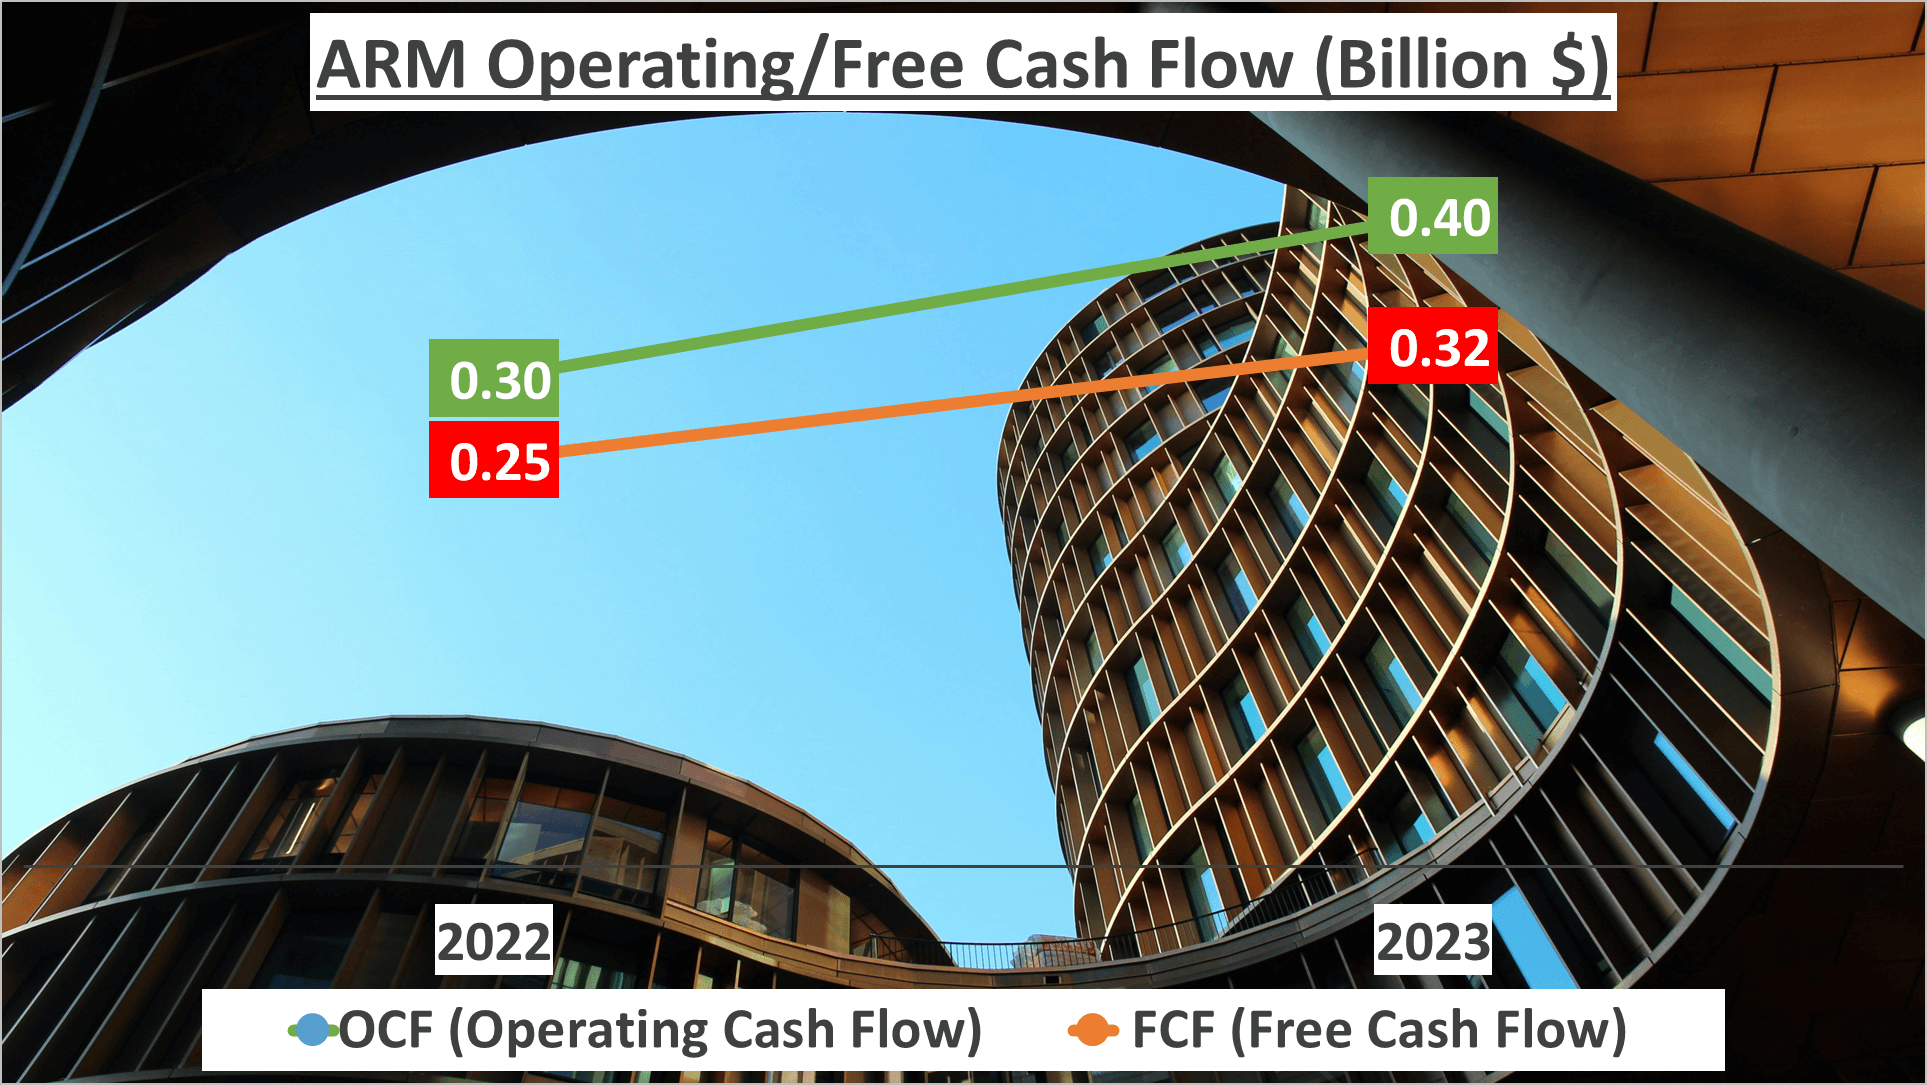

Now, onto free cash flow, which reflects the cash generated after deducting capital expenditures. ARM’s free cash flow in 2023 amounted to $0.32B, showing an encouraging upward trajectory compared to $0.25B in 2022.
Turning to receivable days, this metric gauges the average time taken by a company to collect payment post-sale. A lower figure indicates faster cash collection, beneficial for the business. In 2023, ARM reduced its receivable days to 106, a significant improvement from the prior year’s 132 days.
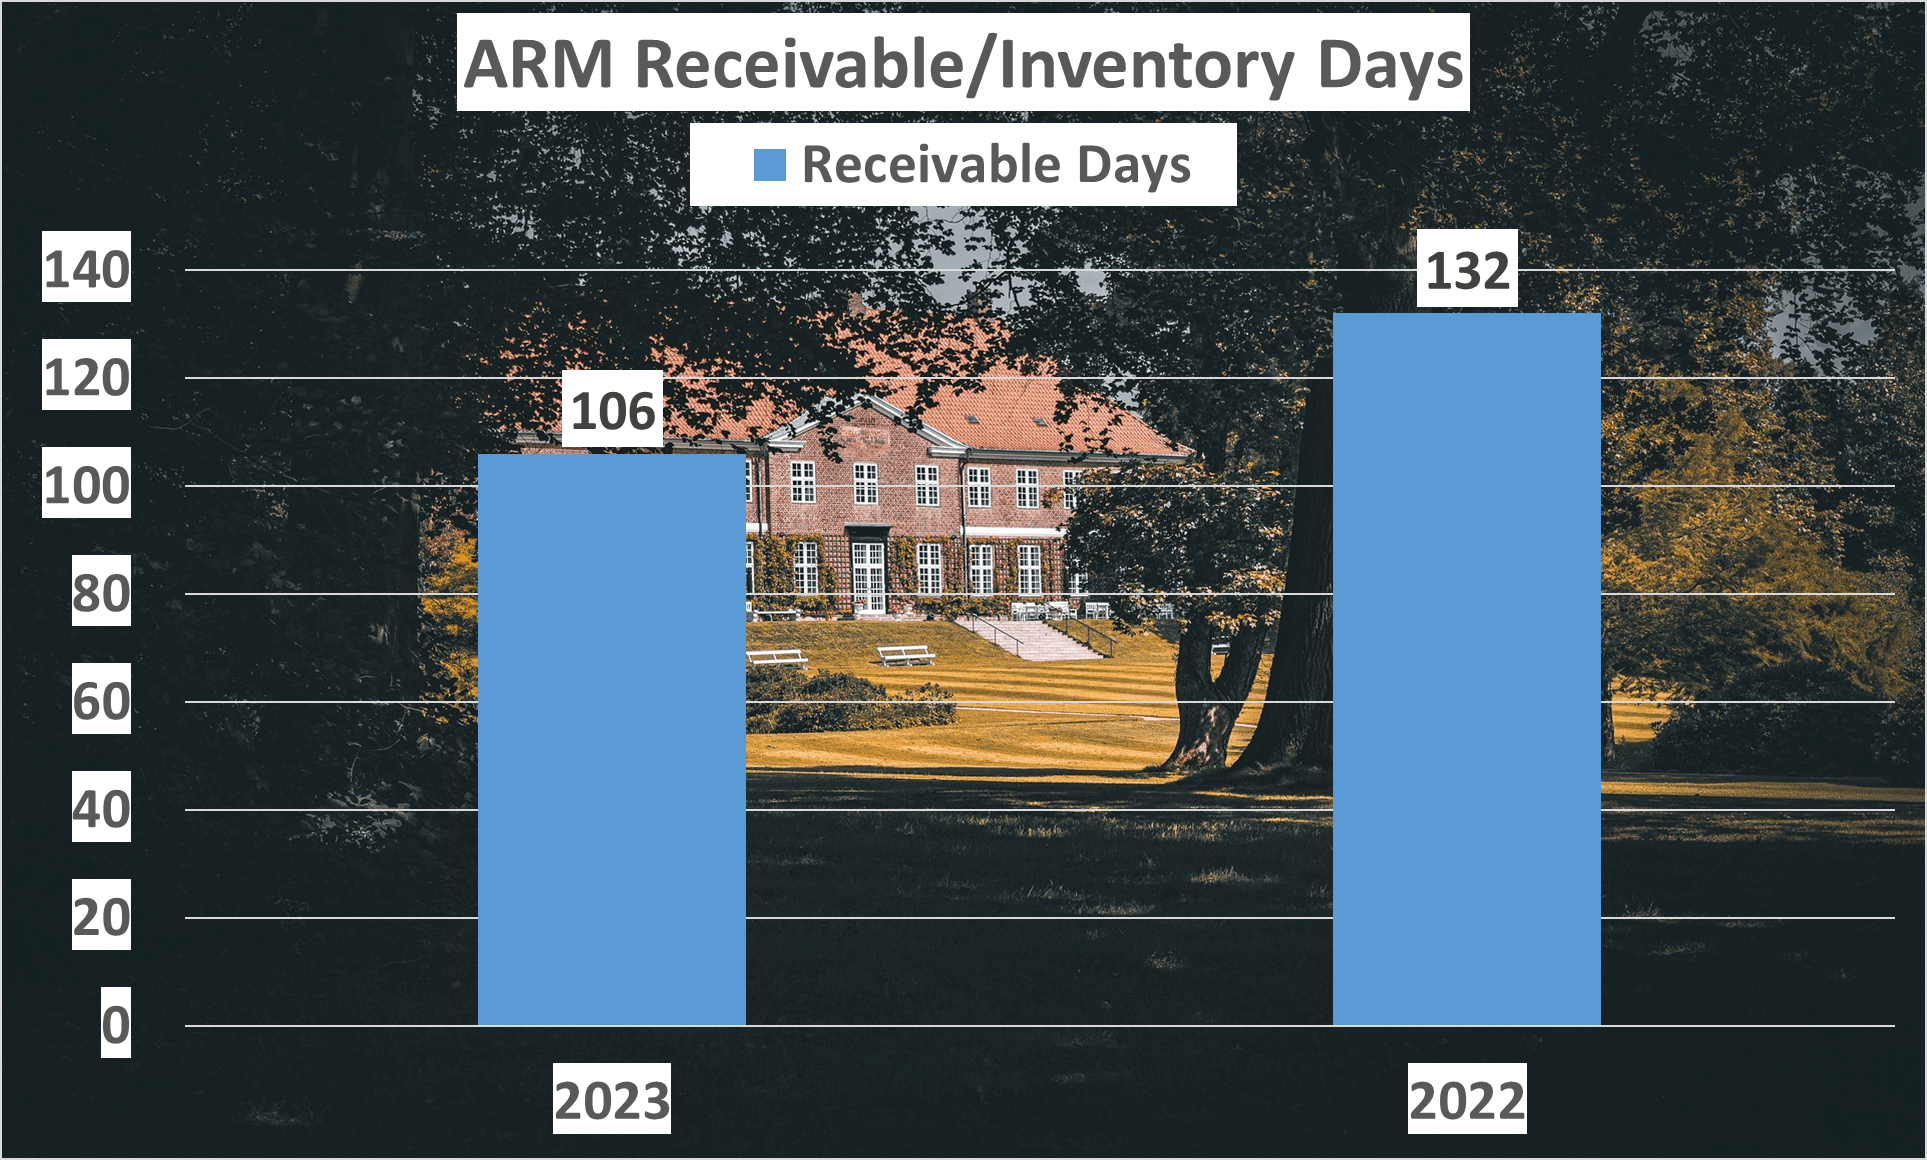

Despite progress, there’s still room to shorten this duration, further enhancing cash flow. Faster cash inflow enables quicker reinvestment, fostering growth. While ARM’s cash flow scenario has advanced, optimizing receivable days remains an area for enhancement.
Dupont Analysis – ARM Stock Analysis
Let’s delve into a Dupont analysis to dissect ARM’s financial performance comprehensively. This analytical tool breaks down Return on Equity (ROE) into three components: Net Profit Margin, Asset Turnover, and Equity Multiplier. It offers valuable insights into a company’s financial health and operational efficiency.
In 2023, ARM’s ROE stood at 2%. The Net Profit Margin was 3%, Asset Turnover was 0.43, and Equity Multiplier was 1.42. Contrarily, in 2022, ARM boasted a robust ROE of 16%, accompanied by a Net Profit Margin of 24%, Asset Turnover of 0.4, and Equity Multiplier of 1.68.
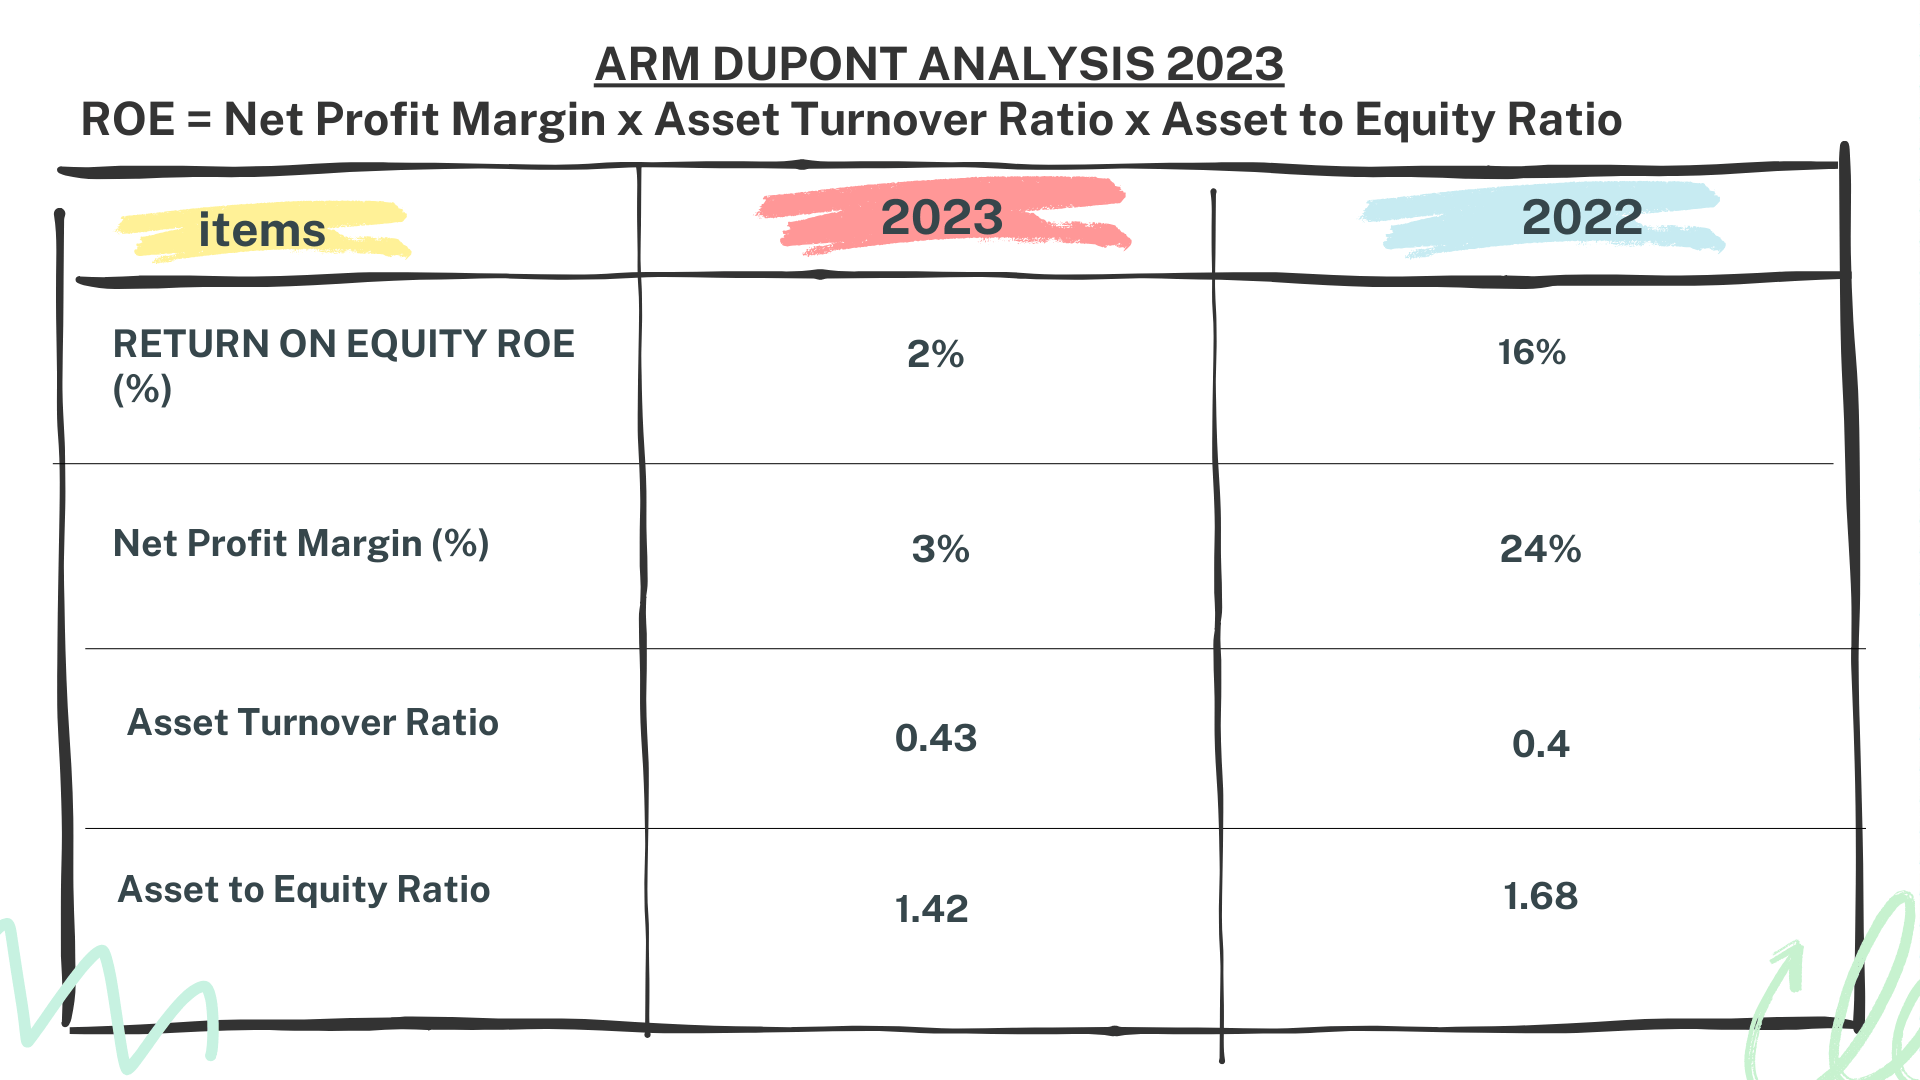

The decline in ROE from 2022 to 2023 can be attributed to a decrease in Net Profit Margin, indicating reduced profitability per dollar of sales for ARM. However, the Asset Turnover ratio remained relatively stable, implying consistent efficiency in utilizing assets to generate sales. Moreover, the decreased Equity Multiplier suggests ARM relied less on debt to finance its assets in 2023.
Overall, the Dupont analysis provides a holistic view of ARM’s financial performance, shedding light on changes in profitability, asset management, and financial leverage over time. It offers invaluable insights into ARM’s financial standing and operational efficiency.
Conclusion – ARM Stock Analysis
Let’s encapsulate the key findings from our analysis of ARM. The company has showcased impressive revenue growth, marking a 15% increase from the previous year. However, profitability has been impacted by escalated expenses in research and development, as well as sales, general, and administrative areas, resulting in a notable decline in net profits.


Nevertheless, ARM has demonstrated positive growth in both total assets and net assets, underscoring its stability and adeptness in financial management. Moreover, amidst the surging demand for artificial intelligence (AI) chips, ARM’s strategic position is becoming increasingly vital and fortified.
While there’s room for enhancement in payment capabilities and cash flow management, as indicated by the current ratio and receivable days, ARM’s operating cash flow has displayed a robust increase.
The Dupont Analysis reveals a decrease in return on equity, primarily influenced by the lower net profit margin.
Collectively, these insights underscore the substantial potential ARM holds for future profit generation. Don’t forget to subscribe for more insightful financial analyses. Share your thoughts in the comments below and suggest which company you’d like us to analyze next.
Author: investforcus.com
Follow us on Youtube: The Investors Community
