AT&T vs Verizon Stock Analysis: A Comparative Look at Revenue Trends, curious about the financial performance of telecom giants AT&T and Verizon? Let’s delve into the data and identify the frontrunner.
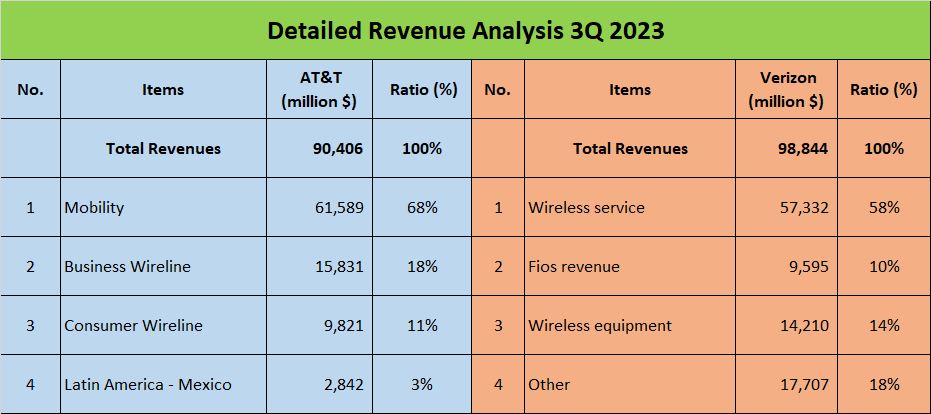
Initially, let’s examine total revenues. As of the last three quarters of 2023, AT&T amassed a substantial $90B, while Verizon surged ahead with $99B in revenue. A comparison to 2018 reveals intriguing patterns: five years ago, AT&T boasted a formidable $123B in revenue, yet has since experienced a negative 6% Compound Annual Growth Rate (CAGR). Conversely, Verizon’s revenue in 2018 stood at $96.6B, demonstrating a modest CAGR of 0.5% over the past five years.
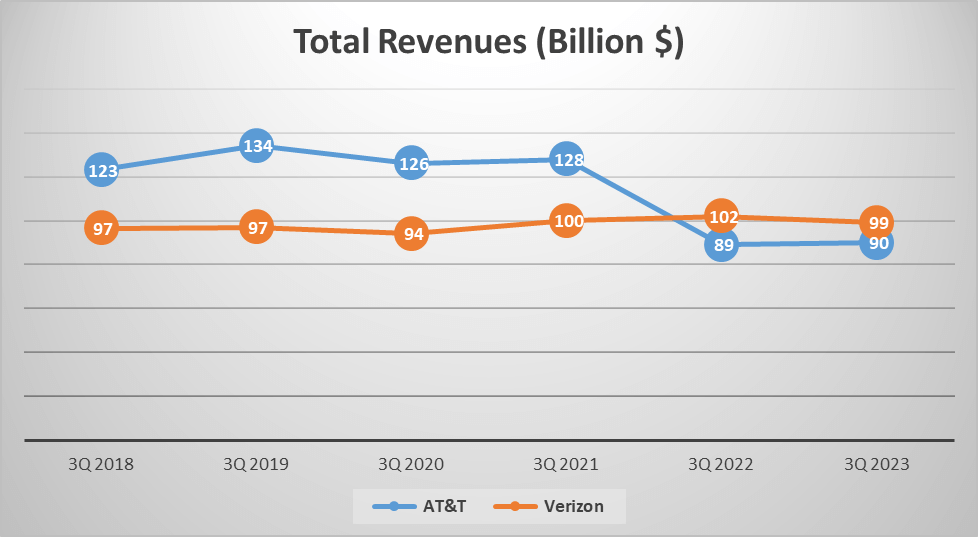
Zooming out, AT&T historically outpaced Verizon in revenue until 2021. However, in 2022, Verizon surpassed AT&T’s revenue for the first time. Analyzing their revenue compositions unveils insights into this shift. AT&T’s revenue streams predominantly originate from Mobility (68%), Business Wireline (18%), Consumer Wireline (11%), and Latin America – Mexico (3%). Conversely, Verizon’s revenue is more concentrated in Wireless services (58%), Fios revenue (10%), Wireless equipment (14%), and Other (18%). This divergent focus likely contributes to Verizon’s ascendancy in the revenue arena.
In the race for revenue, Verizon has evidently seized the lead. Now, let’s turn our attention to profit margins.
Profit Margins and Net Profits – AT&T vs. Verizon Stock Analysis
In the competitive landscape of telecommunications, understanding profit margins serves as a vital gauge of company profitability. Let’s delve into the profit margins of AT&T and Verizon.
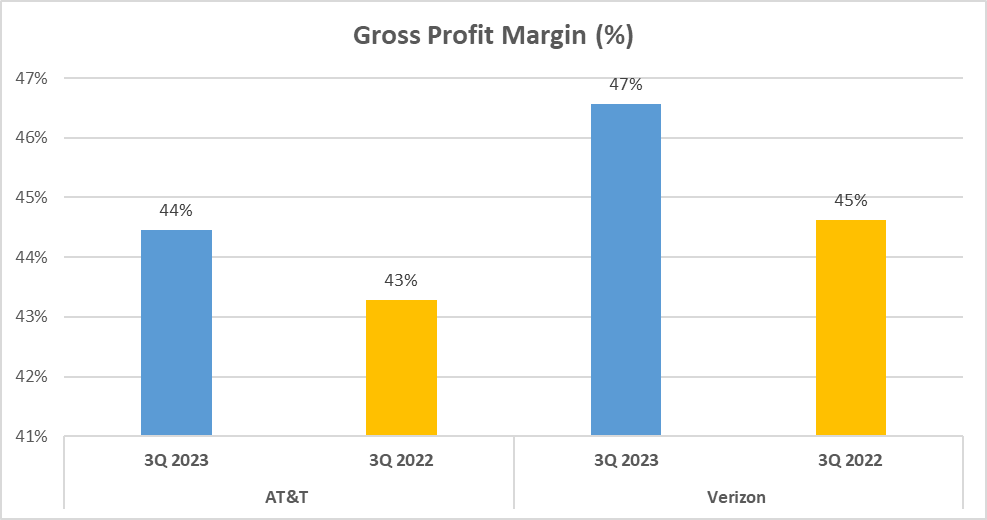
Gross profit margin, a fundamental metric, reveals the proportion of revenue retained after deducting the cost of goods or services. AT&T’s gross profit margin stands at 44%, slightly lower than Verizon’s margin of 47%.
But the analysis doesn’t stop at gross profit margins. Net profits, the pinnacle of profitability, demand closer examination. AT&T reports a net profit of $12B, while Verizon’s net profit reaches $14B. This figure represents the earnings retained after covering all expenses, taxes, and costs.
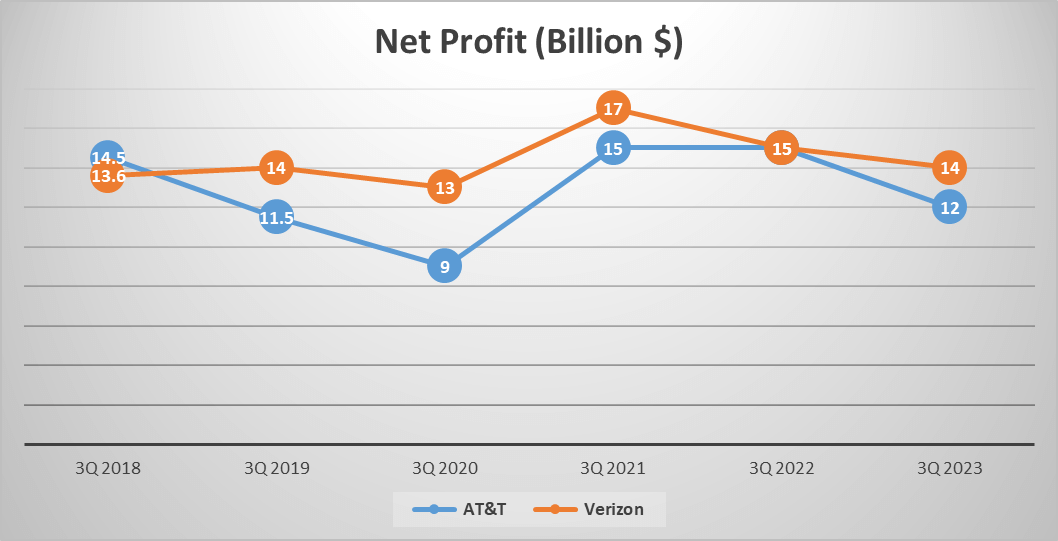
Digging deeper, over the past five years, AT&T has experienced a negative net profit growth rate of -4%, indicating a decline in profitability. Conversely, Verizon exhibits a modest positive growth rate of 0.6%, signaling incremental profit expansion.
It’s noteworthy that both AT&T and Verizon boast similar net profit margins, both at 14%. This ratio elucidates the earnings in profit for every dollar of revenue generated, translating to fourteen cents in profit for every dollar earned by both companies.
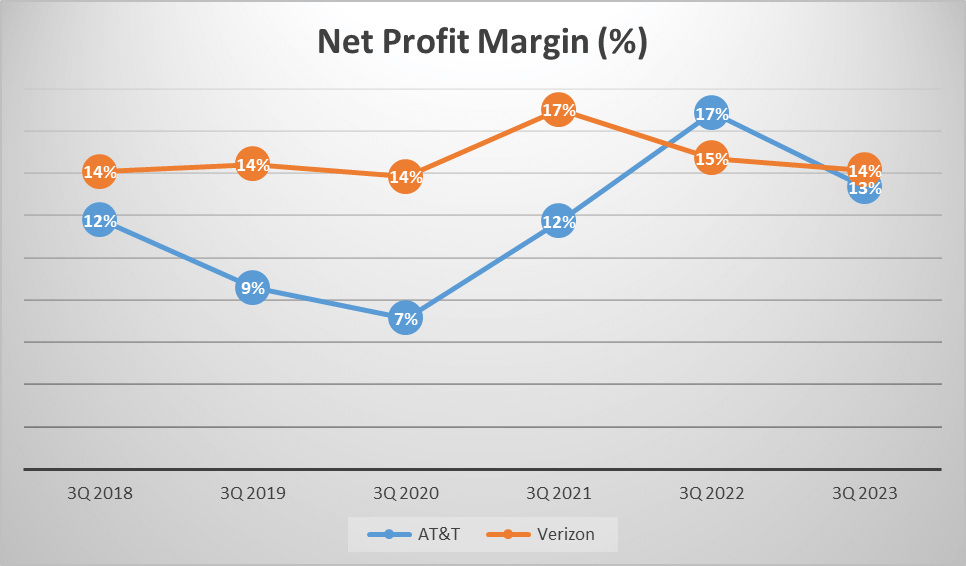
So, what does this analysis imply? While both companies maintain profitability, they portray distinct growth trajectories. AT&T grapples with challenges in expanding net profit, while Verizon steadily progresses forward. Despite comparable net profit margins, Verizon leads in terms of net profit growth.
The Asset Game – AT&T vs Verizon Stock Analysis
Assets represent a company’s wealth of resources. So, who emerges as the asset powerhouse between AT&T and Verizon? Let’s delve into the details.
In terms of total assets, AT&T takes the lead with $407B, closely followed by Verizon with $385B. However, it’s not merely the total assets that capture attention; it’s the composition of these assets that truly intrigues.
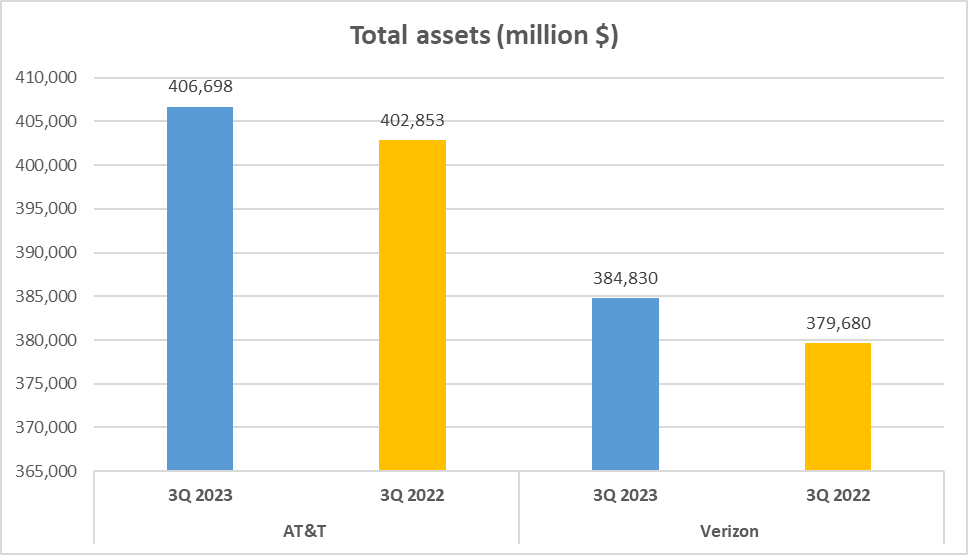
You might be curious about the breakdown of these assets. Well, for both AT&T and Verizon, a substantial portion is allocated to property, equipment, and licenses. This allocation aligns with the telecommunications industry’s capital-intensive nature, where robust infrastructure investments are indispensable.
For AT&T, property, equipment, and licenses constitute a significant 63% of their total assets. Meanwhile, Verizon boasts an even higher proportion at 68%.
This heavy reliance on property, equipment, and licenses underscores the industry’s high capital requirements and the formidable barriers to entry for newcomers.
But what about the remainder of their asset portfolios? AT&T allocates the remaining 37% across diverse areas such as investments, accounts receivable, and cash equivalents. Similarly, Verizon’s remaining 32% spans various asset classes.
In essence, while AT&T boasts a higher total asset value, both companies heavily lean on property, equipment, and licenses. This reliance underscores not only the substantial investments demanded by the telecommunications sector but also the significant value locked within these assets.
Such dependence profoundly shapes the financial performance and strategic decisions of these industry giants.
Therefore, when contemplating investments in telecommunications, remember to scrutinize not just the total assets but also their composition. Quality matters as much as quantity in this intricate financial landscape.
In summary, despite AT&T’s edge in total assets, both companies underscore the pivotal role of property, equipment, and licenses in their wealth portfolios.
Liquidity Ratios and Operational Efficiency – AT&T vs Verizon Stock Analysis
Liquidity and operational efficiency stand as critical pillars for a company’s resilience. How do AT&T and Verizon stack up in these crucial domains? Let’s delve deeper.
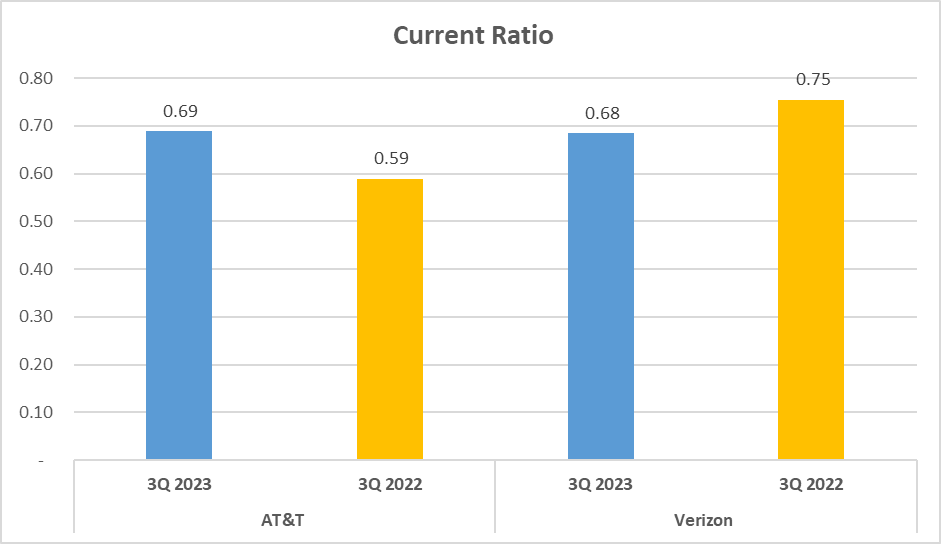
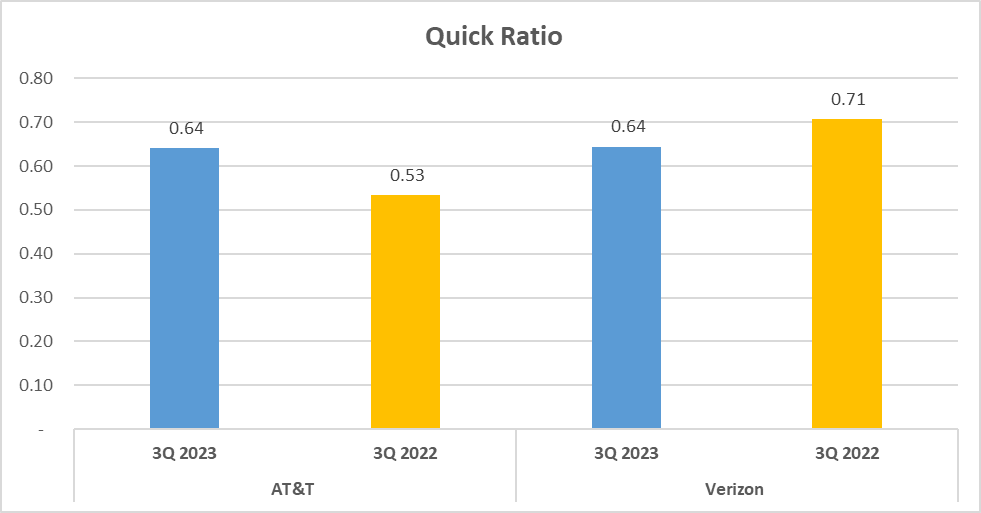
Starting with liquidity ratios, these metrics gauge a company’s capability to settle short-term obligations with short-term assets. Among these, the Current Ratio and Quick Ratio hold significance. AT&T reports a Current Ratio of 0.69, marginally higher than Verizon’s 0.68. This signifies that both companies possess less than one dollar of current assets for every dollar of current liabilities, hinting at potential short-term liquidity challenges. Similarly, the Quick Ratio, excluding inventory from current assets, mirrors similarity between the two entities, with both standing at 0.64.
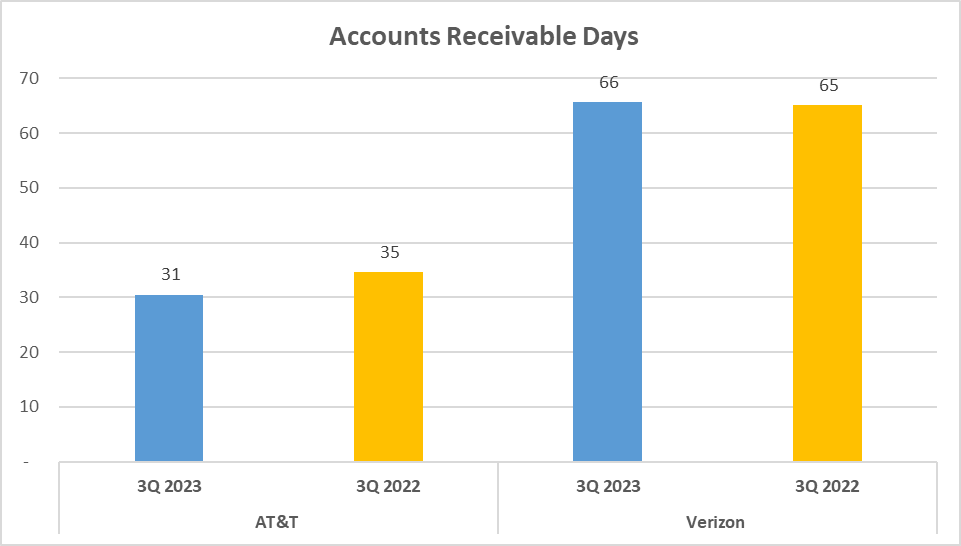
Now, shifting focus to operational efficiency, Accounts Receivable Days emerge as a pivotal metric, measuring the average duration taken by a company to collect payment post-sale. Impressively, AT&T boasts a figure of 31 days, outperforming Verizon’s 66 days, indicating AT&T’s superior efficiency in payment collection.
Furthermore, Total Assets Turnover serves as another yardstick for operational efficiency, depicting how effectively a company utilizes its assets to generate sales. Here, Verizon leads the charge with a ratio of 0.34, surpassing AT&T’s 0.3, showcasing Verizon’s adeptness in asset utilization for revenue generation.
In the clash of liquidity and operational efficiency, results vary. While both companies exhibit similar liquidity ratios, signaling potential short-term liquidity risks, AT&T shines in prompt payment collection. Conversely, Verizon demonstrates prowess in transforming assets into revenue efficiently.
Thus, while liquidity ratios paint a comparable picture, Verizon excels in asset turnover, indicating superior operational efficiency.
Cash Flow and Dupont Analysis – AT&T vs Verizon Stock Analysis
Cash flow serves as the lifeblood of any enterprise, while the Dupont Analysis offers insights into a company’s return on equity. Let’s evaluate the positions of AT&T and Verizon in these aspects.
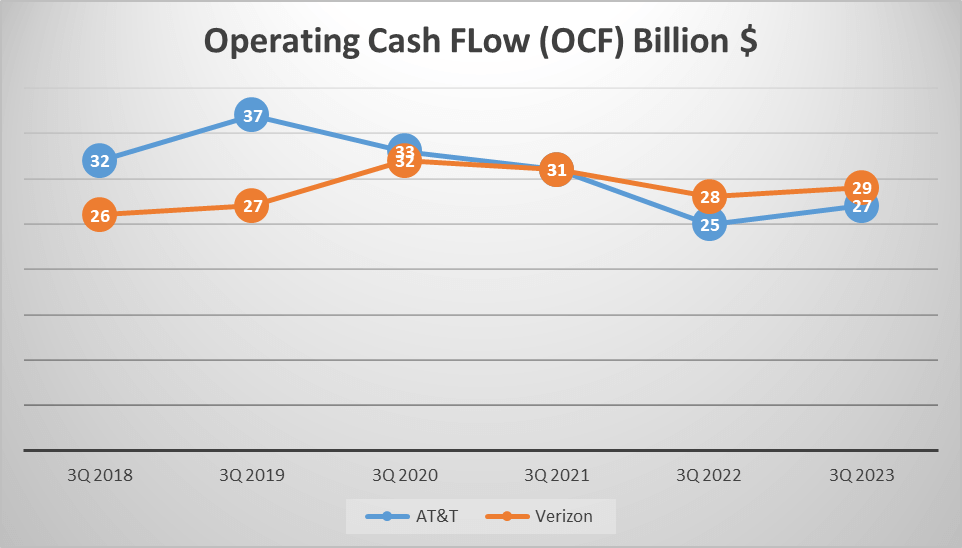
Beginning with operating cash flow, a pivotal metric for financial well-being. AT&T recorded $27B, slightly trailing Verizon’s $29B. However, it’s not just about the inflow; it’s also about the surplus available for reinvestment.
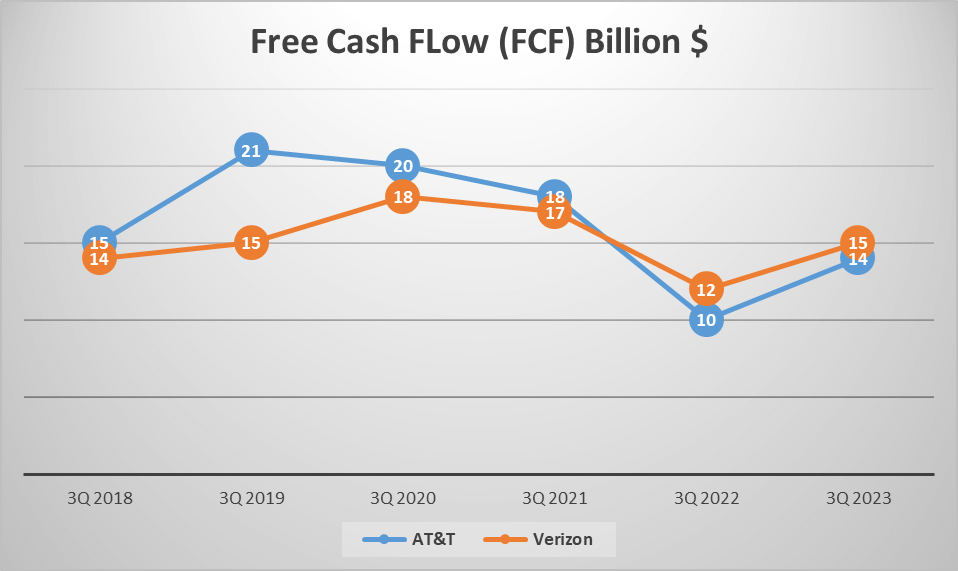
Free cash flow, derived by deducting capital expenditures from operating cash flow, amounted to $14B for AT&T and $15B for Verizon. A higher free cash flow confers greater flexibility, giving Verizon a slight advantage in this regard.
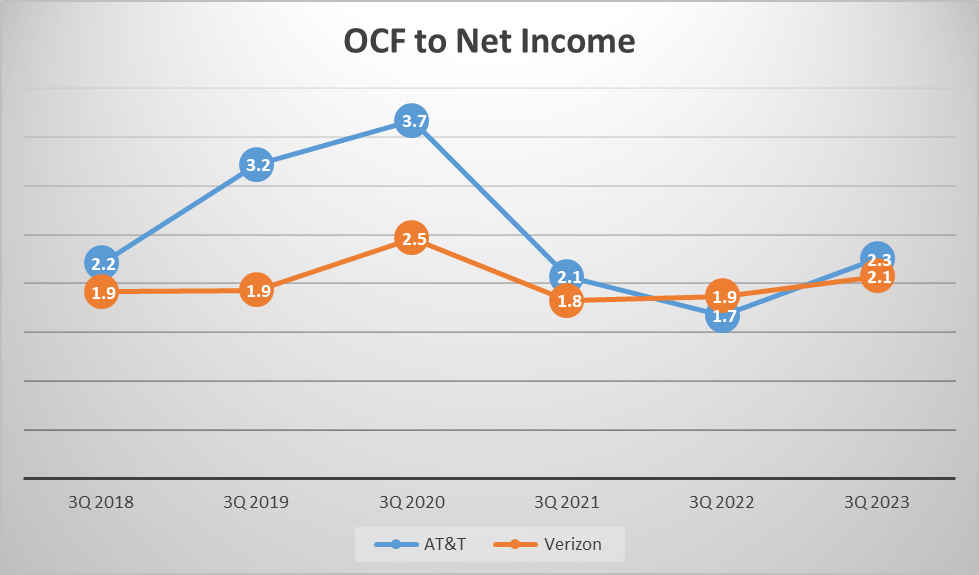
From a profitability standpoint, examining the ratio of operating cash flow to net income yields insights. AT&T boasts a ratio of 2.2, marginally surpassing Verizon’s 2. This indicates that for every dollar of net income, AT&T generates $2.2 in cash, while Verizon generates $2.
Transitioning to the Dupont Analysis, a method dissecting return on equity into net profit margin, asset turnover ratio, and financial leverage.
As of the third quarter of 2023, AT&T’s return on equity stood at 14%, mirroring its net profit margin, while its asset turnover ratio reached 0.3. The asset-to-equity ratio, measuring financial leverage, stood at 3.45.
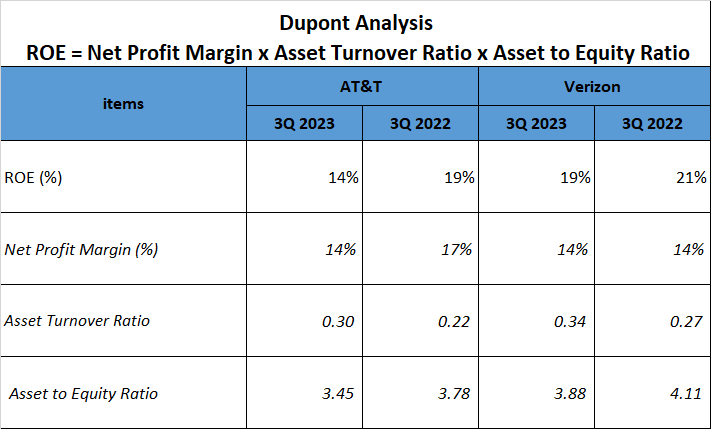
In contrast, Verizon boasted a higher return on equity of 19%, with a comparable net profit margin of 14%. Excelling in asset turnover, Verizon registered a ratio of 0.34, coupled with a higher asset-to-equity ratio of 3.88.
In summary, Verizon exhibits stronger cash flow and a superior return on equity, indicative of better financial performance. Stay tuned for our forthcoming article where we’ll dissect another company of your choosing.
Watching more on Youtube:
Author: investforcus.com
Follow us on Youtube: The Investors Community

