Boeing vs. Airbus Stock Analysis: Which Aerospace Giant Holds the Financial Edge?
When it comes to the aviation industry, Boeing and Airbus stand as formidable competitors, not just as aircraft manufacturers but as symbols of national pride. In today’s analysis, we delve deep into the financial landscapes of these industry behemoths to determine which company boasts greater financial stability.
Financial stability is the bedrock of any successful enterprise, providing the necessary support to weather economic turbulence and drive growth. As we navigate through the financials of Boeing and Airbus, we aim to uncover insights that shed light on their resilience and ability to create value for shareholders.
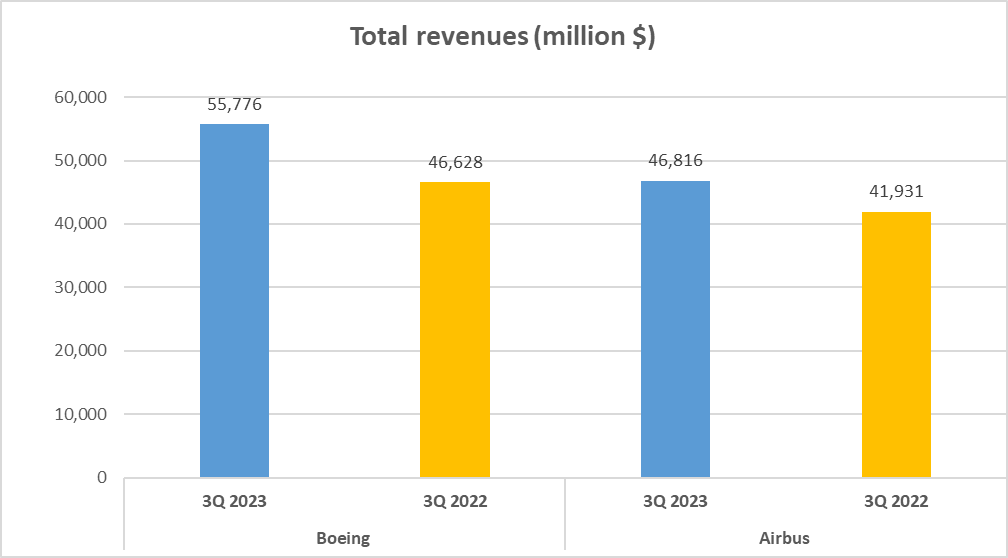
Boeing, a multinational corporation headquartered in the United States, commands a diverse portfolio spanning commercial airplanes, defense, space & security, and global services. By the close of the third quarter of 2023, Boeing reported a total revenue of $56 billion, with its commercial airplane segment contributing a significant 42%.
On the other hand, Airbus, the European aerospace titan, boasts a revenue structure that spans across continents. With total revenues of $47 billion during the same period, Airbus drew its highest proportion of sales, 37%, from Europe, followed by Asia-Pacific and North America.
While revenue is a crucial metric, our analysis delves deeper into profitability, asset utilization, liquidity, and operational efficiency to provide a comprehensive view of financial health. Metrics such as gross profit margins, return on equity, asset turnover, and liquidity ratios will be scrutinized to compare the financial prowess of Boeing and Airbus.
Join us as we unravel the financial intricacies of these aviation giants, examining key indicators to determine which company holds the stronger financial footing in the Boeing vs. Airbus stock analysis. Fasten your seatbelts as we embark on this enlightening financial journey.
Revenue Analysis – Boeing vs. Airbus Stock Analysis
Let’s start by examining the total revenues for both companies. By the end of the third quarter of 2023, Boeing had accumulated a total revenue of $56 billion, while Airbus garnered $47 billion.
Now, let’s delve deeper into how these revenues were generated. For Boeing, 42% of their revenue came from Boeing Commercial Airplanes, with Boeing Defense, Space & Security contributing 33%, and the remaining 26% from Boeing Global Services.
In essence, Boeing’s revenue is primarily derived from aircraft production and related services.
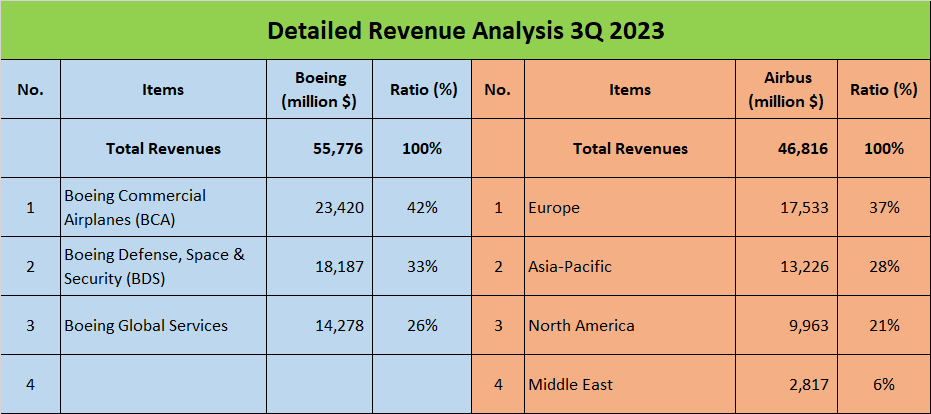
On the contrary, Airbus boasts a more geographically diversified revenue structure. 37% of their revenue comes from Europe, 28% from the Asia-Pacific region, 21% from North America, and 6% from the Middle East.
This suggests that Airbus has a broader customer base, potentially providing them with resilience against regional economic fluctuations.
Interestingly, while Boeing’s total revenue is higher, Airbus’s revenue is more evenly distributed across multiple regions. This diversity could make Airbus less susceptible to region-specific economic challenges and more adaptable to global economic shifts.
Moreover, the differences in revenue structures might reflect their strategic focuses. Boeing heavily relies on aircraft manufacturing and related services, while Airbus serves a more global market.
In conclusion, both companies have their strengths. Boeing’s total revenue is higher, but Airbus’s revenue is more diversified, potentially offering a safeguard against economic uncertainties.
Therefore, while Boeing leads in total revenue, Airbus showcases a more diversified revenue structure in this Boeing vs. Airbus stock analysis.
Profit and Return – Boeing vs. Airbus Stock Analysis
Now, let’s explore the profit margins and returns of these aviation giants.
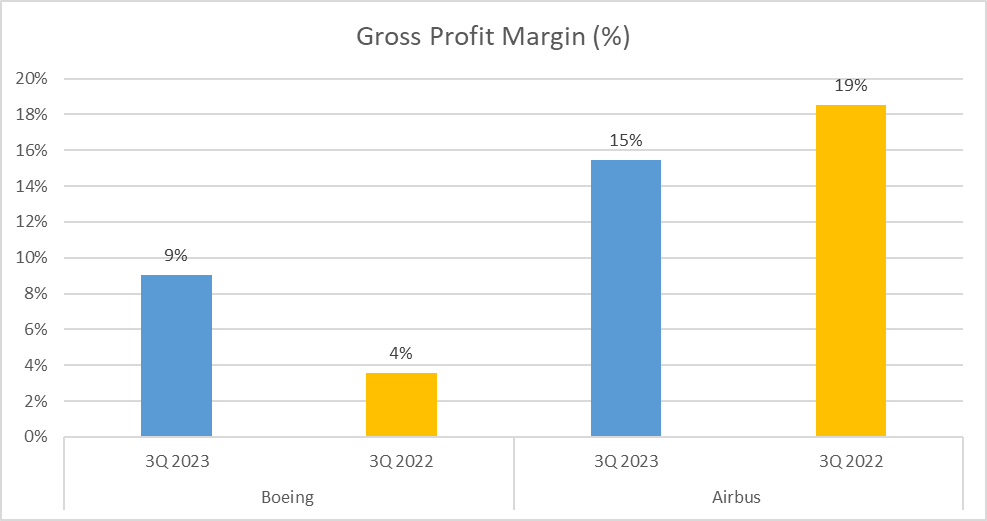
Boeing’s gross profit margin for Q3 2023 stands at 9%, while Airbus boasts a higher margin of 15%. However, the net profits present a contrasting scenario.
Boeing incurred a net loss of $2.2 billion, resulting in a negative net profit margin of -4%. In contrast, Airbus achieved a net profit of $2.6 billion, with a net profit margin of 5%.
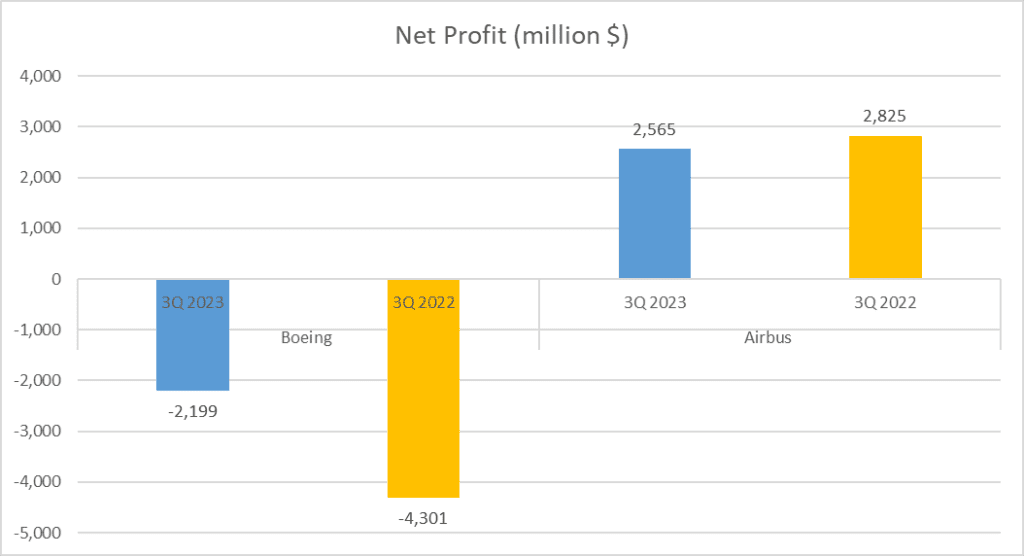
The consistent net losses for Boeing can be attributed to recurring issues with their aircraft, particularly the technical faults of the Boeing 737 MAX 9 in early 2019, which led to a global flight ban.
Regarding return on equity and return on assets, the disparity between the two companies is equally significant.
These incidents not only damaged Boeing’s reputation but also inflicted substantial financial losses.
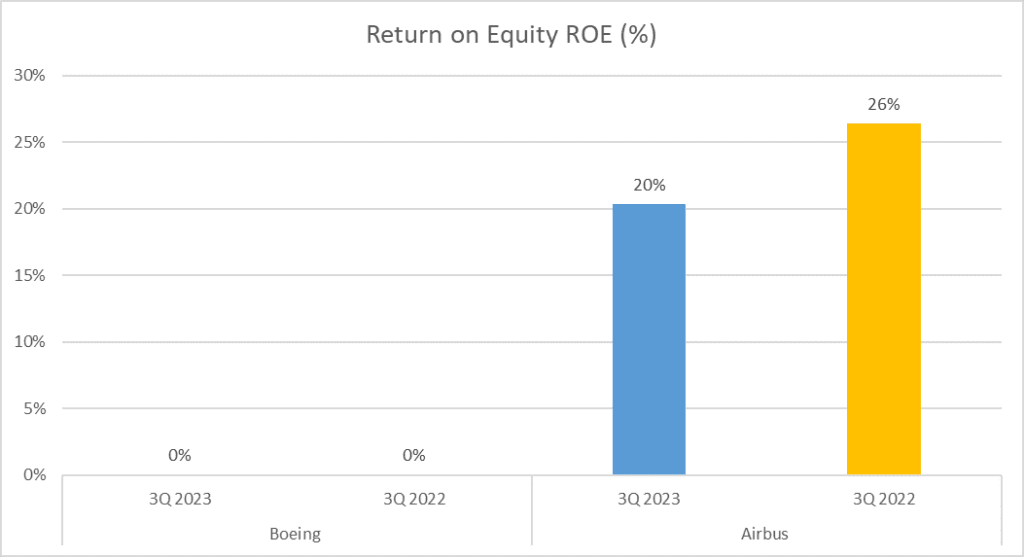
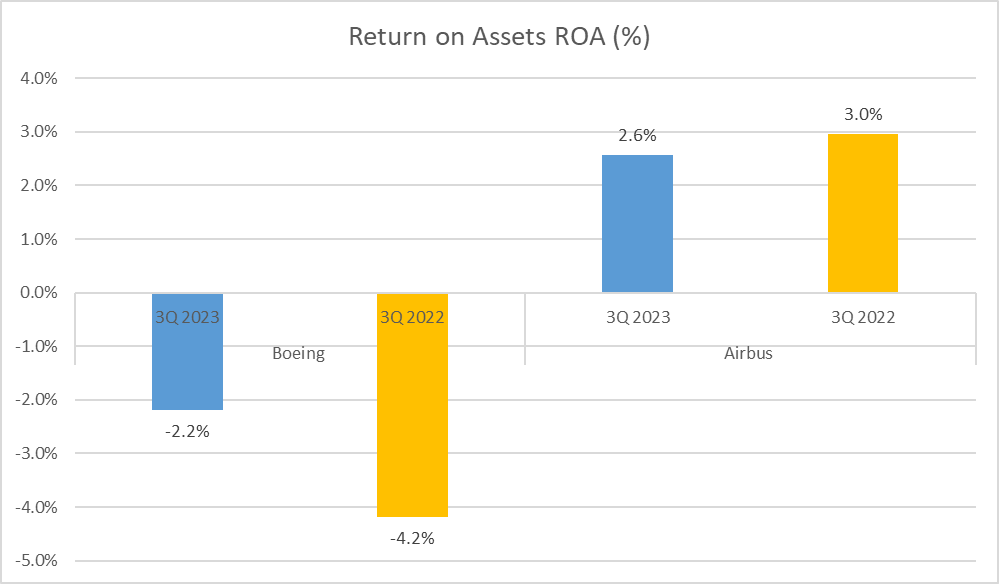
Airbus boasts a robust return on equity of 20% and a return on assets of 2.6%. However, Boeing’s return on equity is 0% and a negative return on assets of -2.2%.
You might question why we’ve listed Boeing’s return on equity as 0%. In a conventional calculation, Boeing’s return on equity would be 18%.
Nevertheless, both Boeing’s net profit and equity are negative, leading to a misleading figure that could cause confusion. For clarity and accuracy, we’ve listed Boeing’s return on equity as 0%.
Despite higher revenues, Boeing’s financial condition is compromised by their negative net profit, whereas Airbus maintains a healthier profit margin and return on assets.
The challenges faced by Boeing emphasize the significance of not only generating revenue but also effectively managing costs and risks.
Conversely, Airbus’s figures portray a well-managed company that not only generates sales but also translates those sales into profit.
Asset and Liquidity – Boeing vs. Airbus Stock Analysis
Now, let’s shift our focus to the companies’ assets and liquidity.
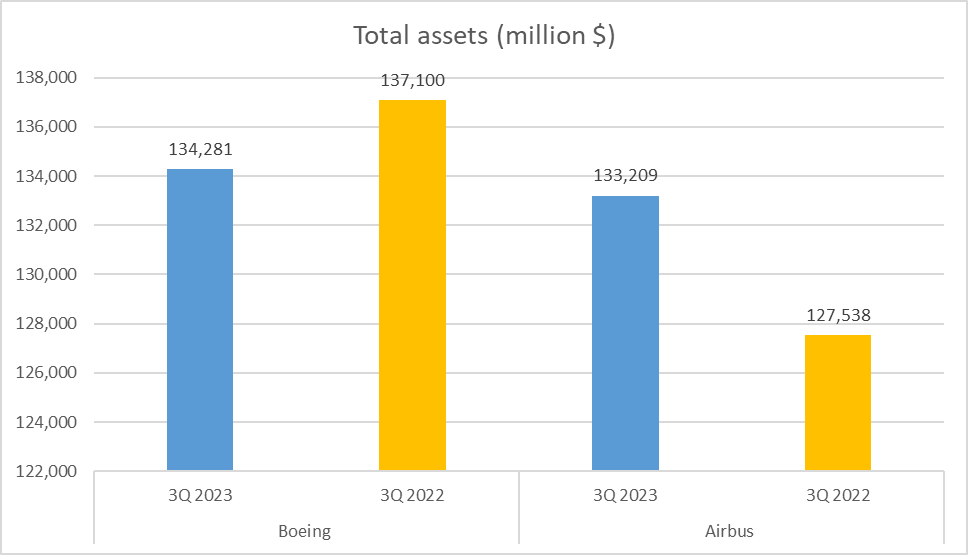
Firstly, let’s discuss total assets. Both in the Boeing vs. Airbus stock analysis, substantial assets are at play.
Boeing boasts total assets of $134 billion, while Airbus closely follows with assets valued at $133 billion.
However, the comparison takes an intriguing turn when examining equity, or net assets.
Airbus shines in this aspect, with positive equity amounting to $17 billion. Conversely, Boeing reports negative equity, standing at -$17 billion.
This discrepancy signifies that Airbus possesses more resources fully owned by the company, providing it with a stronger financial foundation.
This distinction is further emphasized by the equity-to-total-assets ratio. Airbus maintains a healthy ratio of 13%, indicating that a significant portion of its assets is financed by its shareholders.
In contrast, Boeing exhibits a negative ratio of -12%, suggesting that its liabilities surpass its assets.
Operational Efficiency – Boeing vs. Airbus Stock Analysis
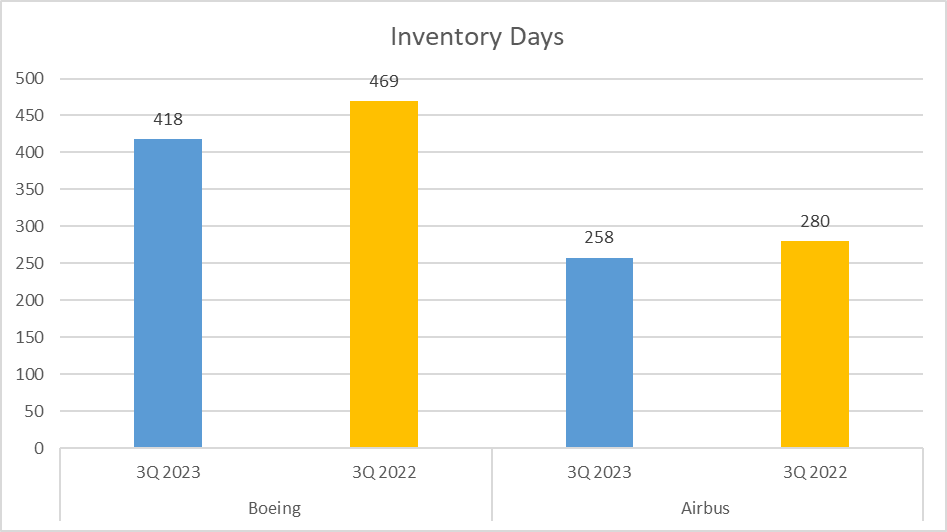
In this section, we delve into the operational efficiency and cash flows of Boeing vs. Airbus Stock Analysis. Firstly, let’s discuss inventory days, a crucial metric indicating the average time taken by a company to sell its inventory.
Boeing’s inventory days stand at 418 days, while Airbus boasts a shorter duration of 258 days. This implies that Airbus exhibits greater efficiency in inventory turnover, possibly due to superior demand forecasting or streamlined production processes.
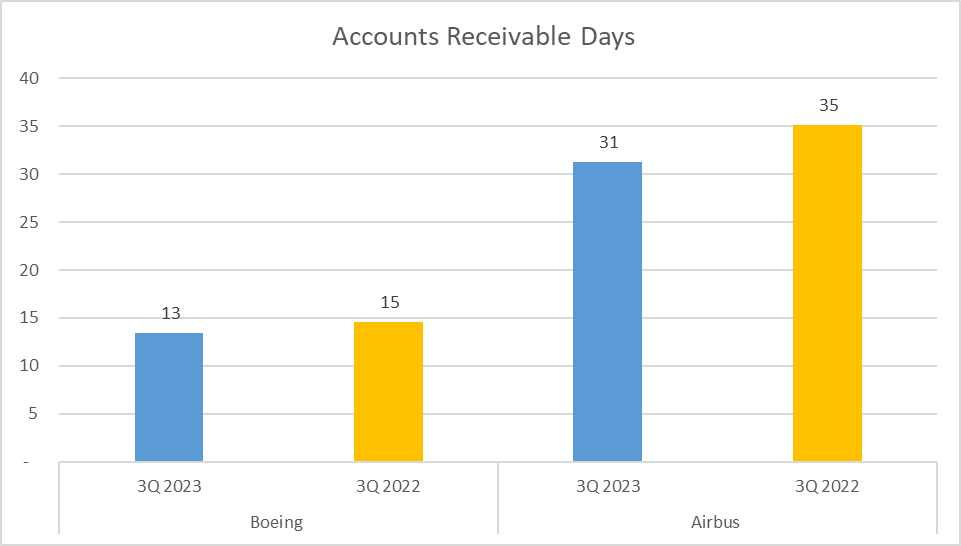
Moving on to accounts receivable days, which measures the average number of days for a company to collect payment after a sale. Boeing’s accounts receivable days are notably low at 13 days, compared to Airbus’s 31 days. This discrepancy may signify Boeing’s more efficient collection process or stricter credit terms for customers.
Additionally, we examine total assets turnover, gauging how effectively a company utilizes its assets to generate sales. Boeing’s turnover is recorded at 0.55 rounds, slightly surpassing Airbus’s 0.48 rounds. This suggests that Boeing may have a marginally better efficiency in leveraging its assets for revenue generation.

Cashflow – Boeing vs Airbus Stock Analysis
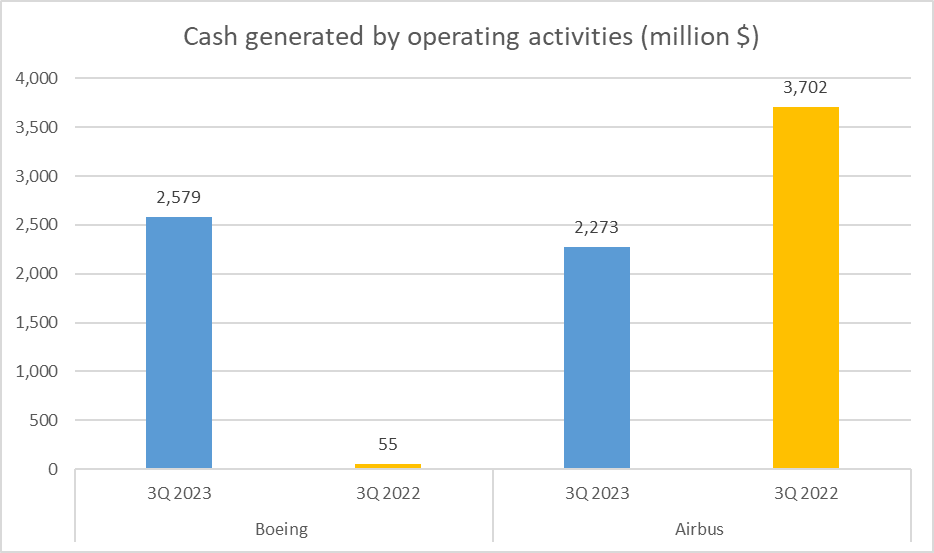
Now, let’s discuss cash flow, a crucial aspect of financial analysis. Cash represents the lifeblood of any business, and the amount of cash generated by operating activities serves as a pivotal indicator of a company’s financial health.
Boeing generated $2.6 billion, while Airbus generated $2.3 billion. This implies that Boeing is generating more cash from its regular business operations.
However, we also need to examine free cash flow, which denotes the cash a company generates after deducting capital expenditures such as investments in buildings or equipment. Boeing’s free cash flow is $1.5 billion, whereas Airbus’s is $420 million.
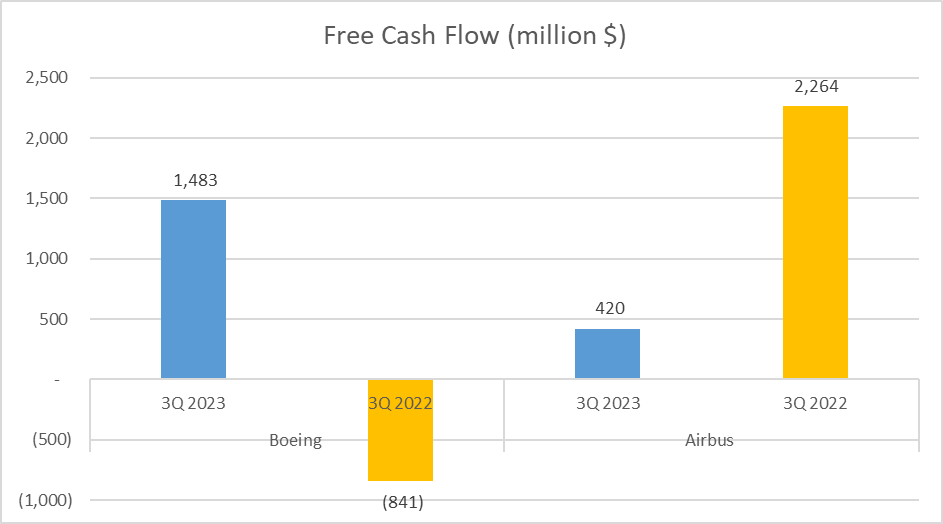
Although Boeing boasts a higher free cash flow, it’s noteworthy that Airbus’s free cash flow is positive, signifying that it has cash remaining after covering its capital expenditures.
While Boeing generates more operational cash, Airbus’s superior operational efficiency and positive free cash flow underscore its stronger financial performance.
Concluding Remarks – Boeing vs. Airbus Stock Analysis
To wrap up, let’s review our findings. We’ve embarked on an in-depth financial journey with two aviation giants: Boeing vs. Airbus Stock Analysis.
Boeing, despite its higher revenues at 56 billion dollars, has shown financial vulnerability with a gross profit margin of only 9%, a net loss of 2 billion dollars, and a 0% return on equity.
Not to mention, operational efficiency measures such as inventory days and quick ratio, raise concerns about Boeing’s ability to manage its resources effectively.
On the other hand, Airbus, with total revenues of 47 billion dollars and a gross profit margin of 15%, exhibits a more robust financial health.
Airbus’s positive net profit, 20% return on equity, and efficient operational measures imply a more stable capital structure and stronger cash flow generation.
While Boeing maintains higher revenues,
Airbus’s diversified revenue structure, positive profit margins, better return on assets, and stronger operational efficiency indicate a more financially stable company.
Author: Investforcus.com
Follow us on Youtube: The Investors Community


naturally like your web site however you need to take a look at the spelling on several of your posts. A number of them are rife with spelling problems and I find it very bothersome to tell the truth on the other hand I will surely come again again.
Thank you for your feedback. We apologize for any spelling errors you encountered and appreciate you bringing this to our attention. We’ll make sure to review and correct any mistakes to improve the quality of our content. We hope to see you again soon on our website.