The Growth Story of Broadcom: Broadcom Stock Analysis – Have you ever imagined the potential profits from investing $5000 in Broadcom back in 2018? It’s indeed an enticing thought, isn’t it? Well, fast forward to March 2024, and that initial investment would have flourished to an astonishing $26,546.

This represents a remarkable increase of 431%, or an annual growth rate of 40%. Now, you might be curious about the factors driving Broadcom’s impressive growth. That’s precisely what we’re here to uncover.
In this comprehensive analysis, we’ll delve into Broadcom’s financial health and business performance, unraveling the key drivers behind its success story. From revenue growth to profit margins, cost structures to net profit, we’ll explore various indicators.
Furthermore, we’ll examine the evolution of Broadcom’s assets over the years and scrutinize essential financial ratios to assess its liquidity and inventory management.
But that’s not all. We’ll also analyze Broadcom’s operating cash flow and free cash flow, charting their growth trajectories over time. Additionally, we’ll conduct a DuPont analysis, dissecting Return on Equity into its components: Net Profit Margin, Asset Turnover, and Equity Multiplier.
This holistic approach will provide a comprehensive understanding of Broadcom’s financial performance and operational efficiency.
Are you prepared to embark on a journey into the world of Broadcom, unraveling the intricacies of its financial growth and understanding how it has optimized its operations for remarkable returns?
Join us as we dive deep into Broadcom’s financial health and business performance. This exploration not only sheds light on its past success but also equips you with insights to make informed investment decisions in the future.
Remember, knowledge is power, and understanding a company’s financial performance enhances your ability to identify lucrative investment opportunities.
So, let’s delve into the captivating world of Broadcom and uncover the secrets behind its financial success. Let’s begin our journey of dissecting Broadcom’s financial health and business performance.
Analyzing Broadcom’s Revenue Growth – Broadcom Stock Analysis
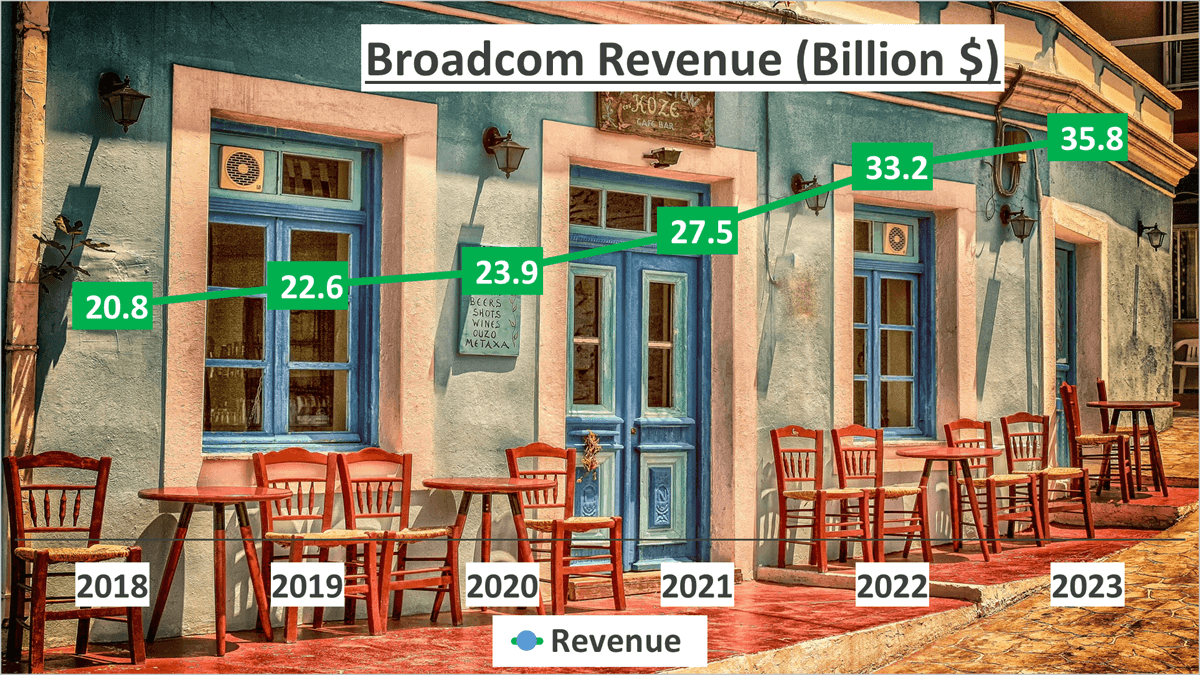
Broadcom’s revenue for 2023 reached a substantial $35.8B, showcasing a consistent upward trend since 2018, with the company maintaining a Compound Annual Growth Rate (CAGR) of 11%.
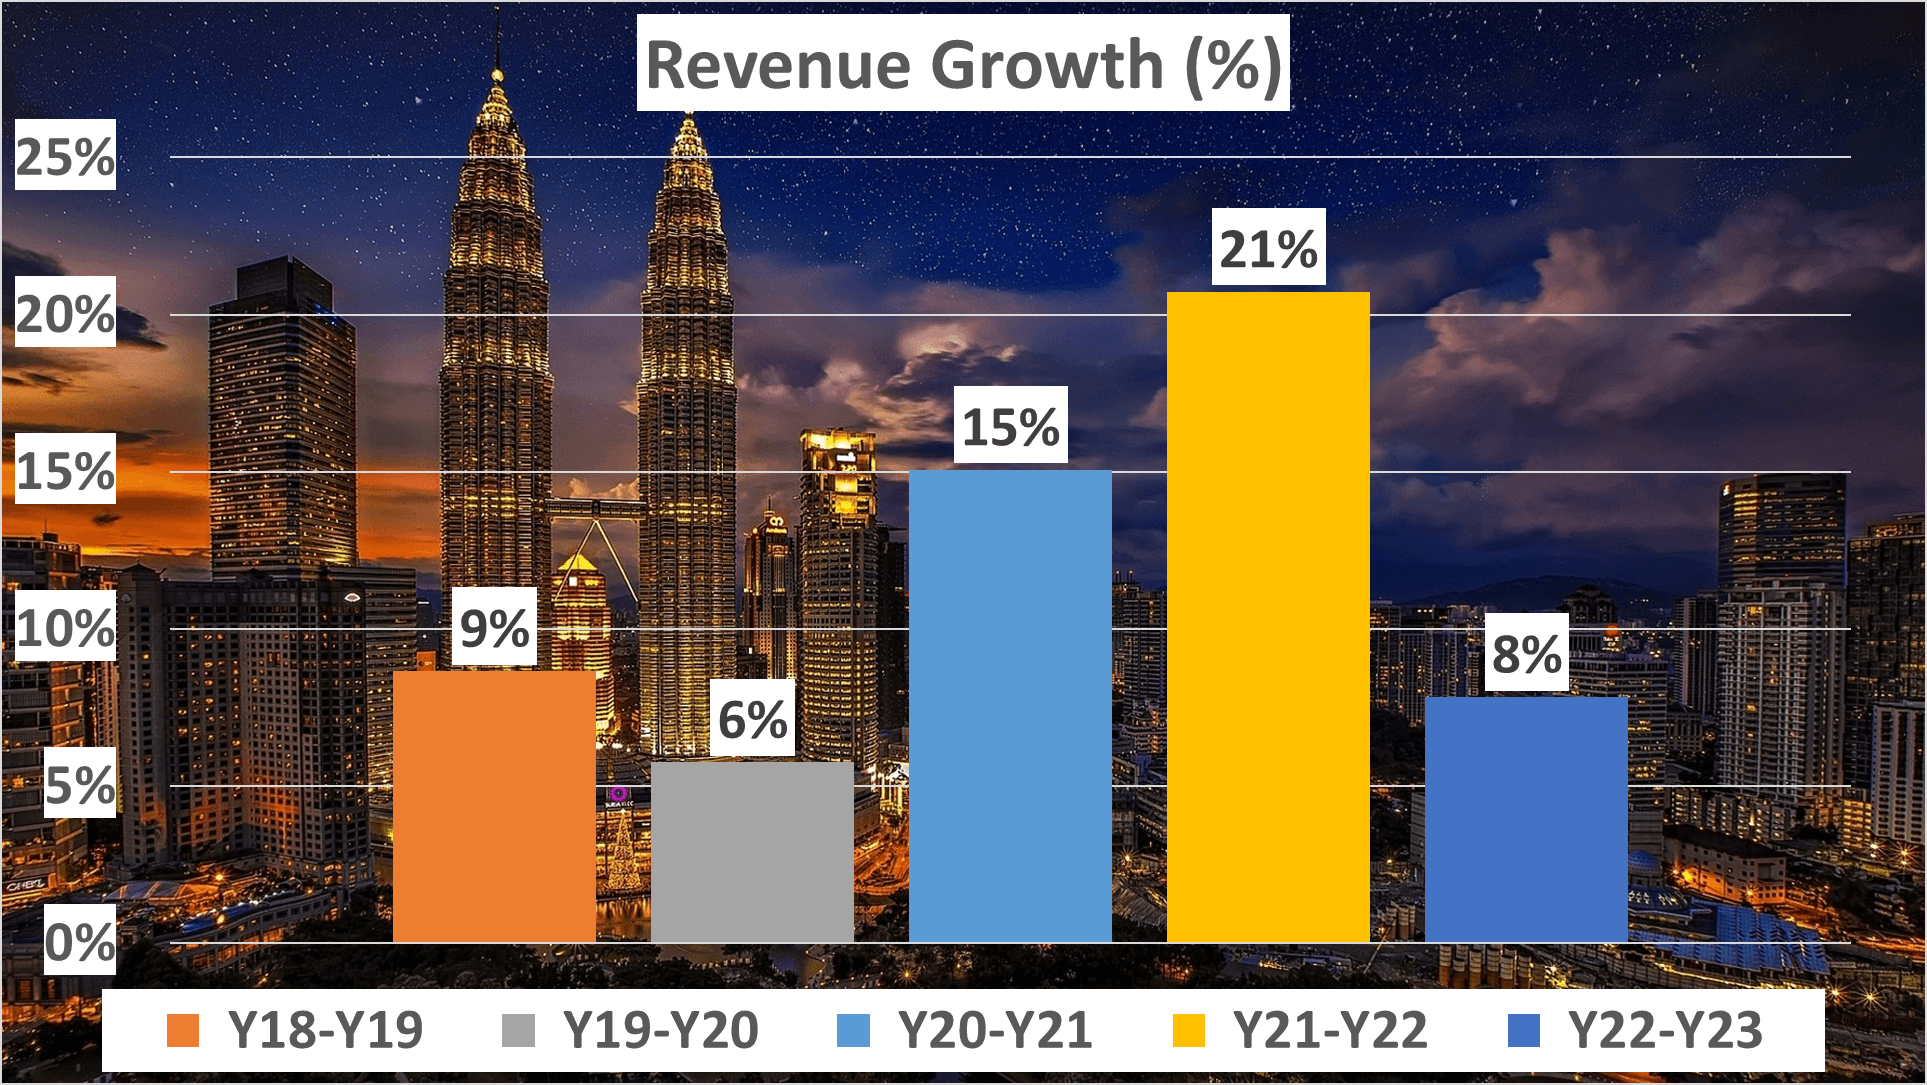
Let’s dissect the revenue growth year by year: Between 2018 and 2019, revenue increased by 9%. From 2019 to 2020, it saw a 6% rise. The subsequent year, 2020 to 2021, witnessed a significant surge to 15%. Following this, growth peaked at 21% from 2021 to 2022 before moderating to 8% in the subsequent year.
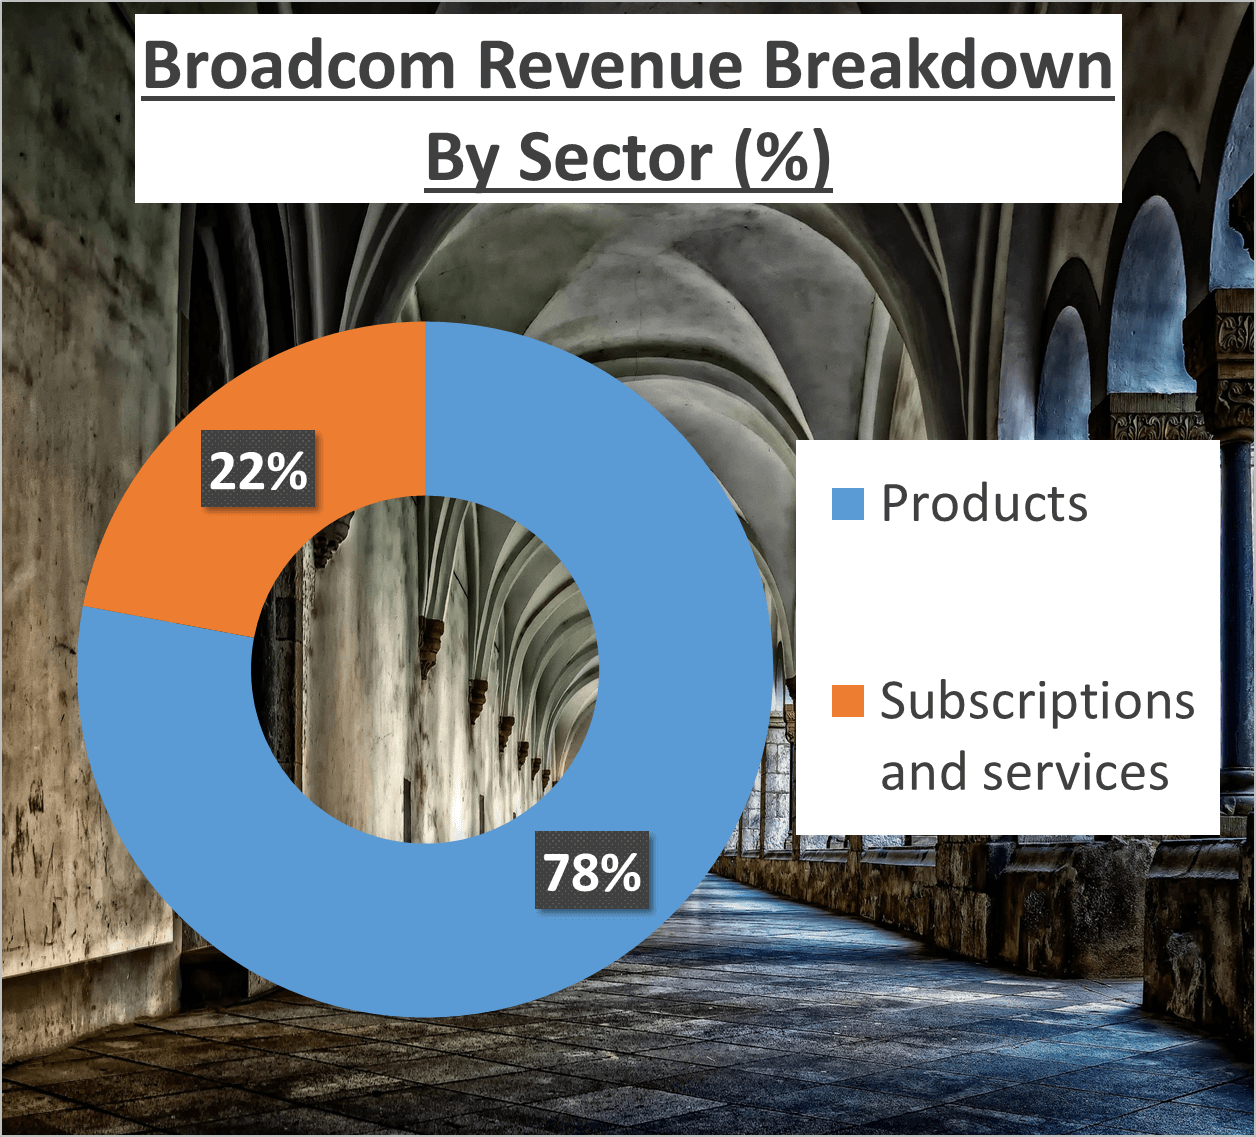
Delving into the revenue composition reveals that products accounted for 78% of the total, while subscriptions and services contributed the remaining 22%.
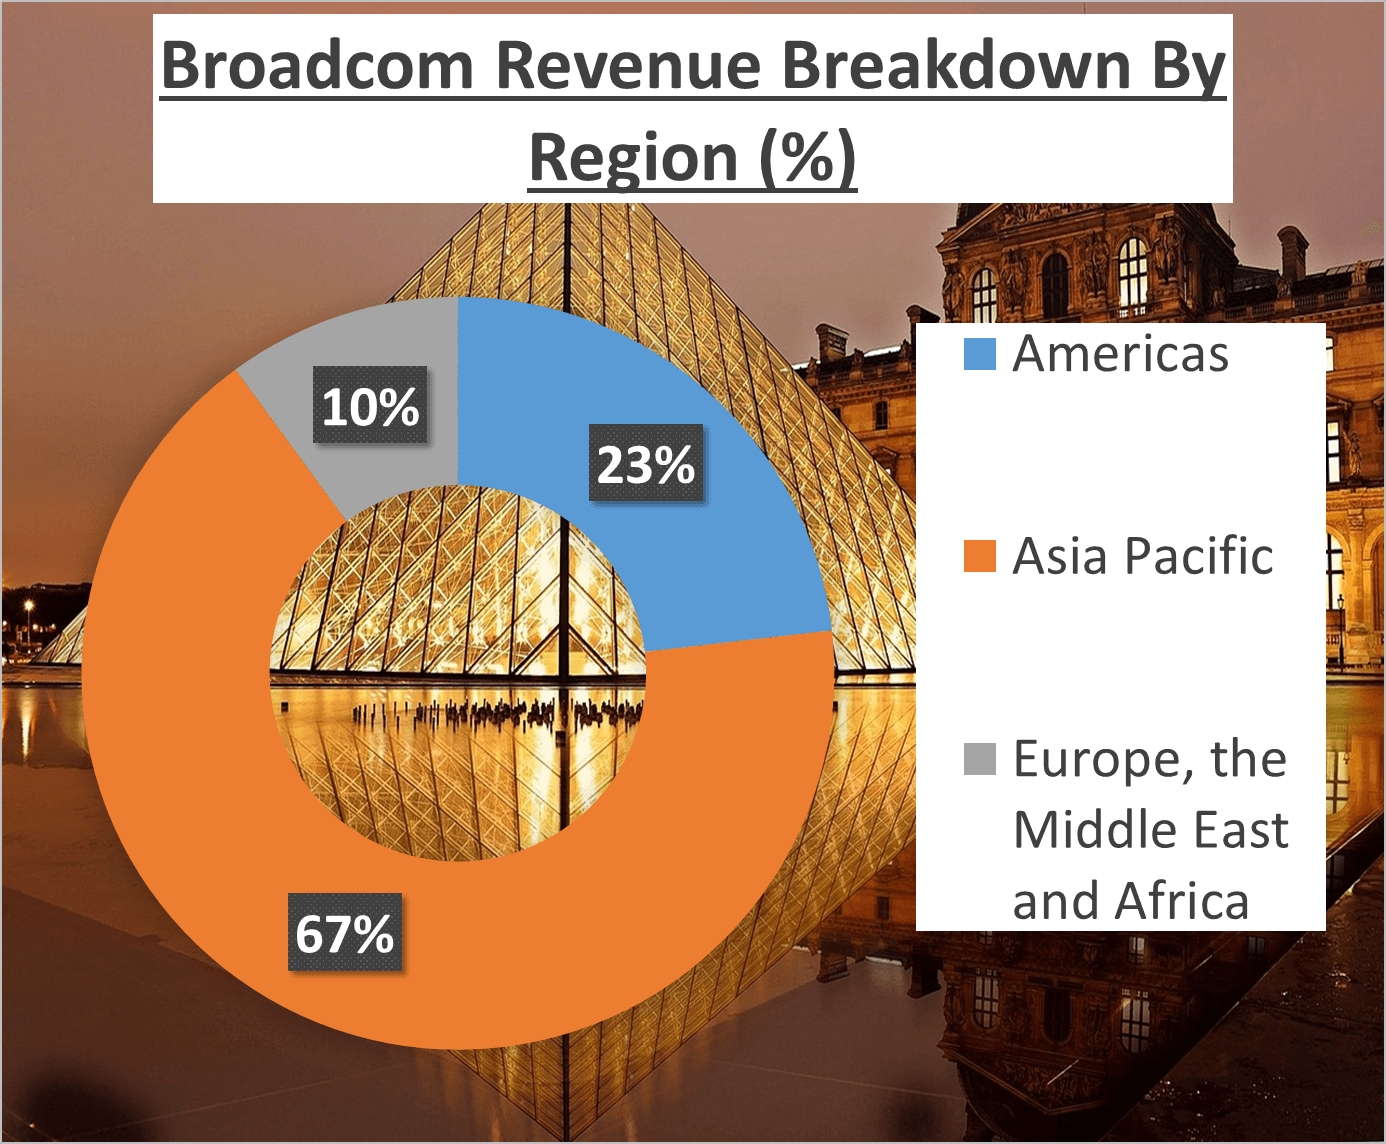
Geographically, 67% of revenue originated from the Asia Pacific region, 23% from the Americas, and 10% from Europe, the Middle East, and Africa.
Evidently, Broadcom has consistently augmented its revenue over the years, reflecting its strong market presence and strategic growth initiatives.
Analyzing Profit Margins and Costs – Broadcom Stock Analysis
Broadcom boasts impressive profit margins, warranting a closer examination. In 2023, Broadcom’s Gross Profit Margin reached an outstanding 69%, surpassing its five-year average of approximately 60%. This substantial increase underscores the company’s adeptness at generating profits from its sales.
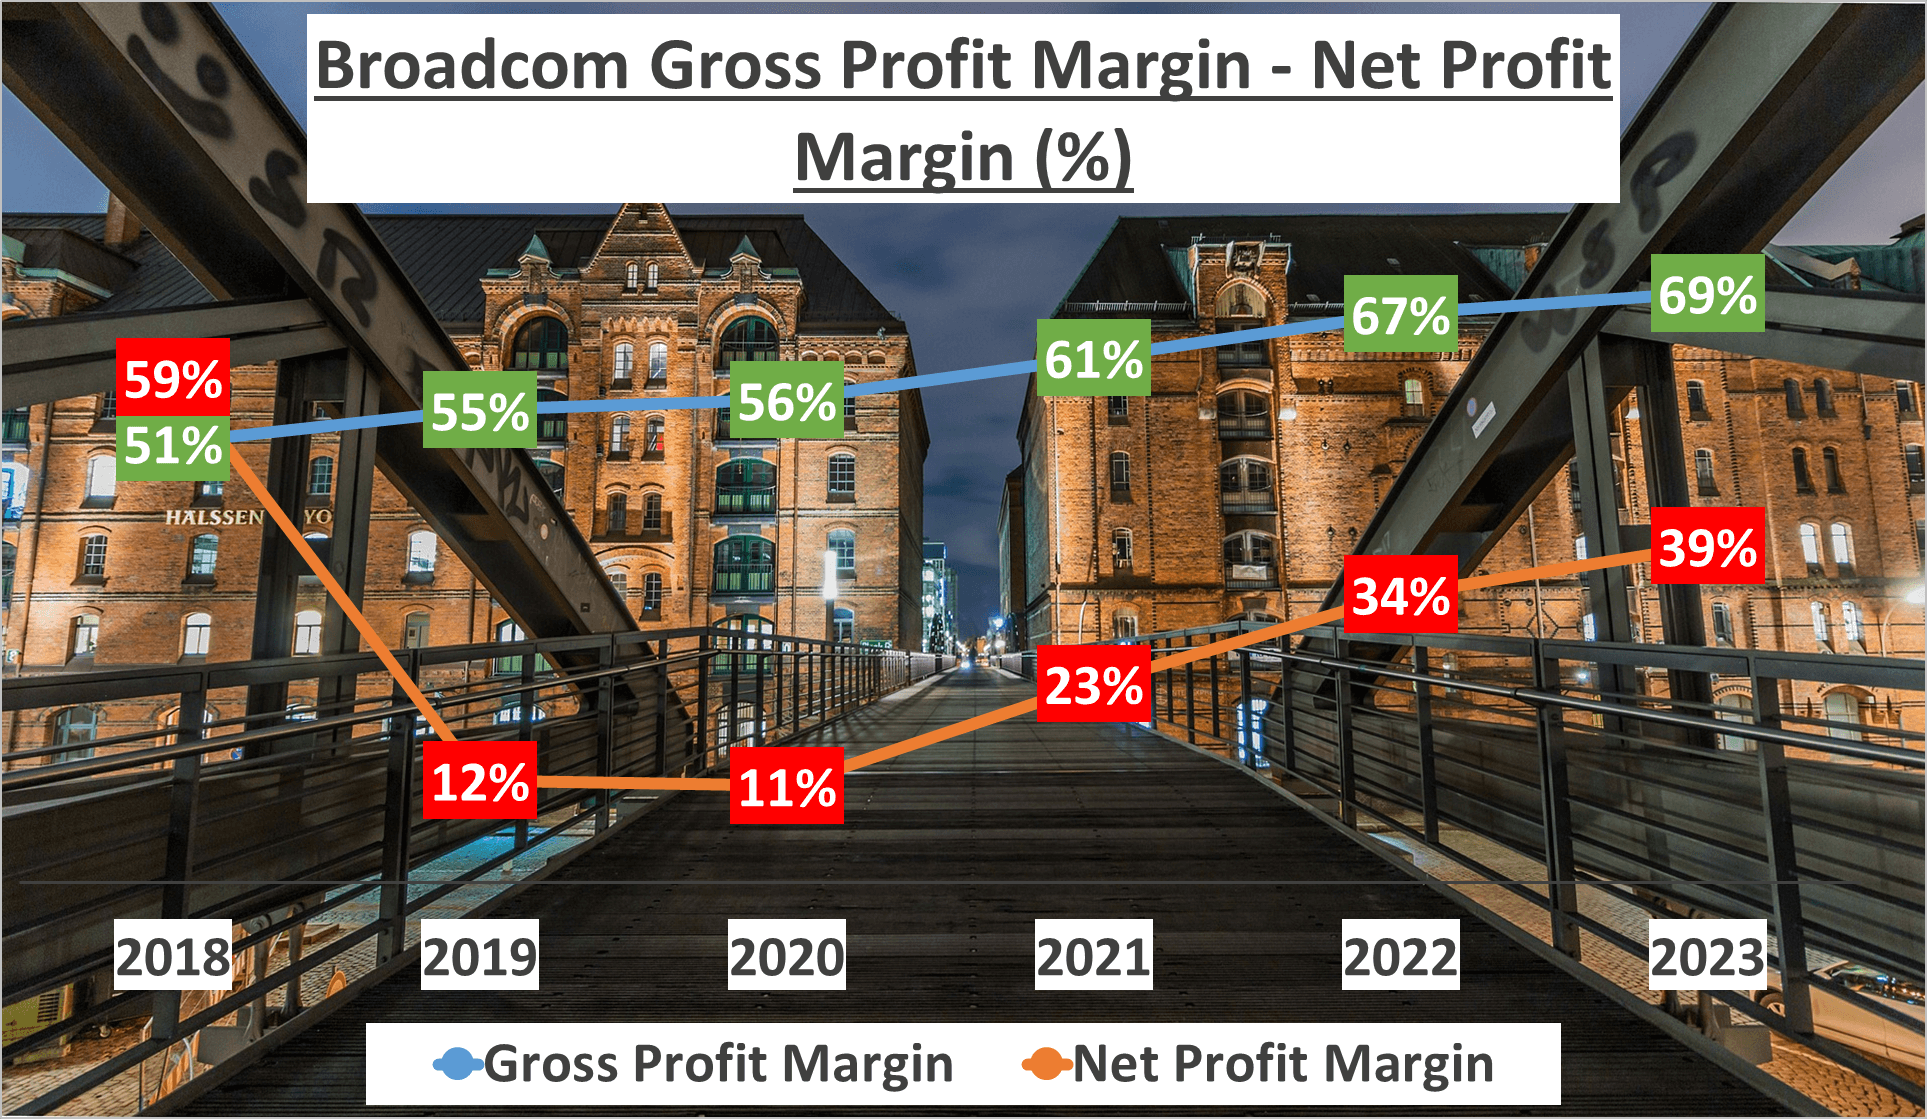
But there’s more to the story. In the same year, Broadcom’s Net Profit Margin stood at 39%, significantly higher than the five-year average of 30%. This indicates Broadcom’s ability to retain 39 cents of each dollar of revenue as profit after accounting for all costs and expenses.
Shifting our focus to the company’s costs, in 2023, Broadcom allocated 15% of its revenue to Research and Development, 4% to Sales, General, and Administrative expenses, and another 4% to Amortization of Goodwill. Interestingly, these proportions have shown a downward trend from 2018 to 2023, indicating the company’s increasing efficiency in cost management.
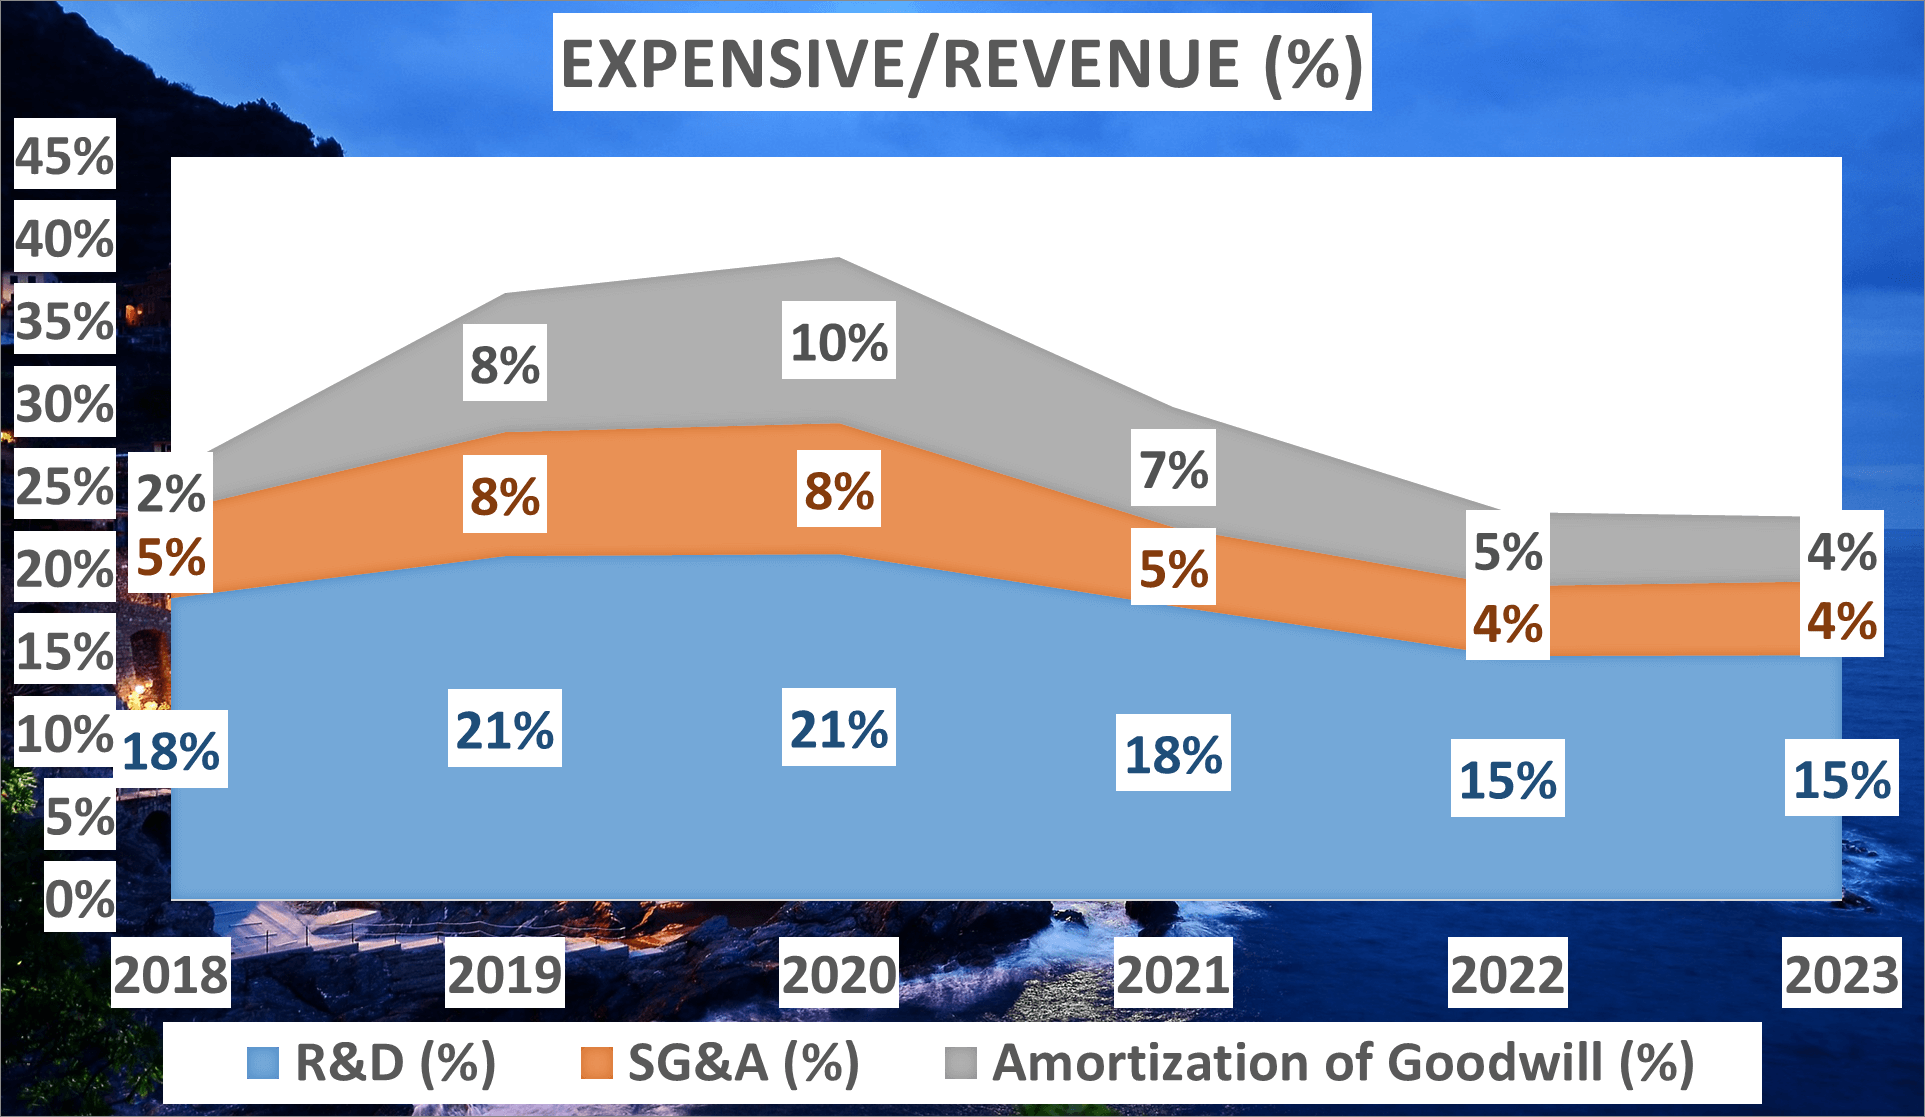
In summary, Broadcom has successfully enhanced its profitability while reducing costs. The company has managed to elevate its profit margins while concurrently diminishing costs as a proportion of revenue. This highlights Broadcom’s effective cost management strategies and its prowess in driving profitability.
Analyzing Profit and Asset Growth – Broadcom Stock Analysis
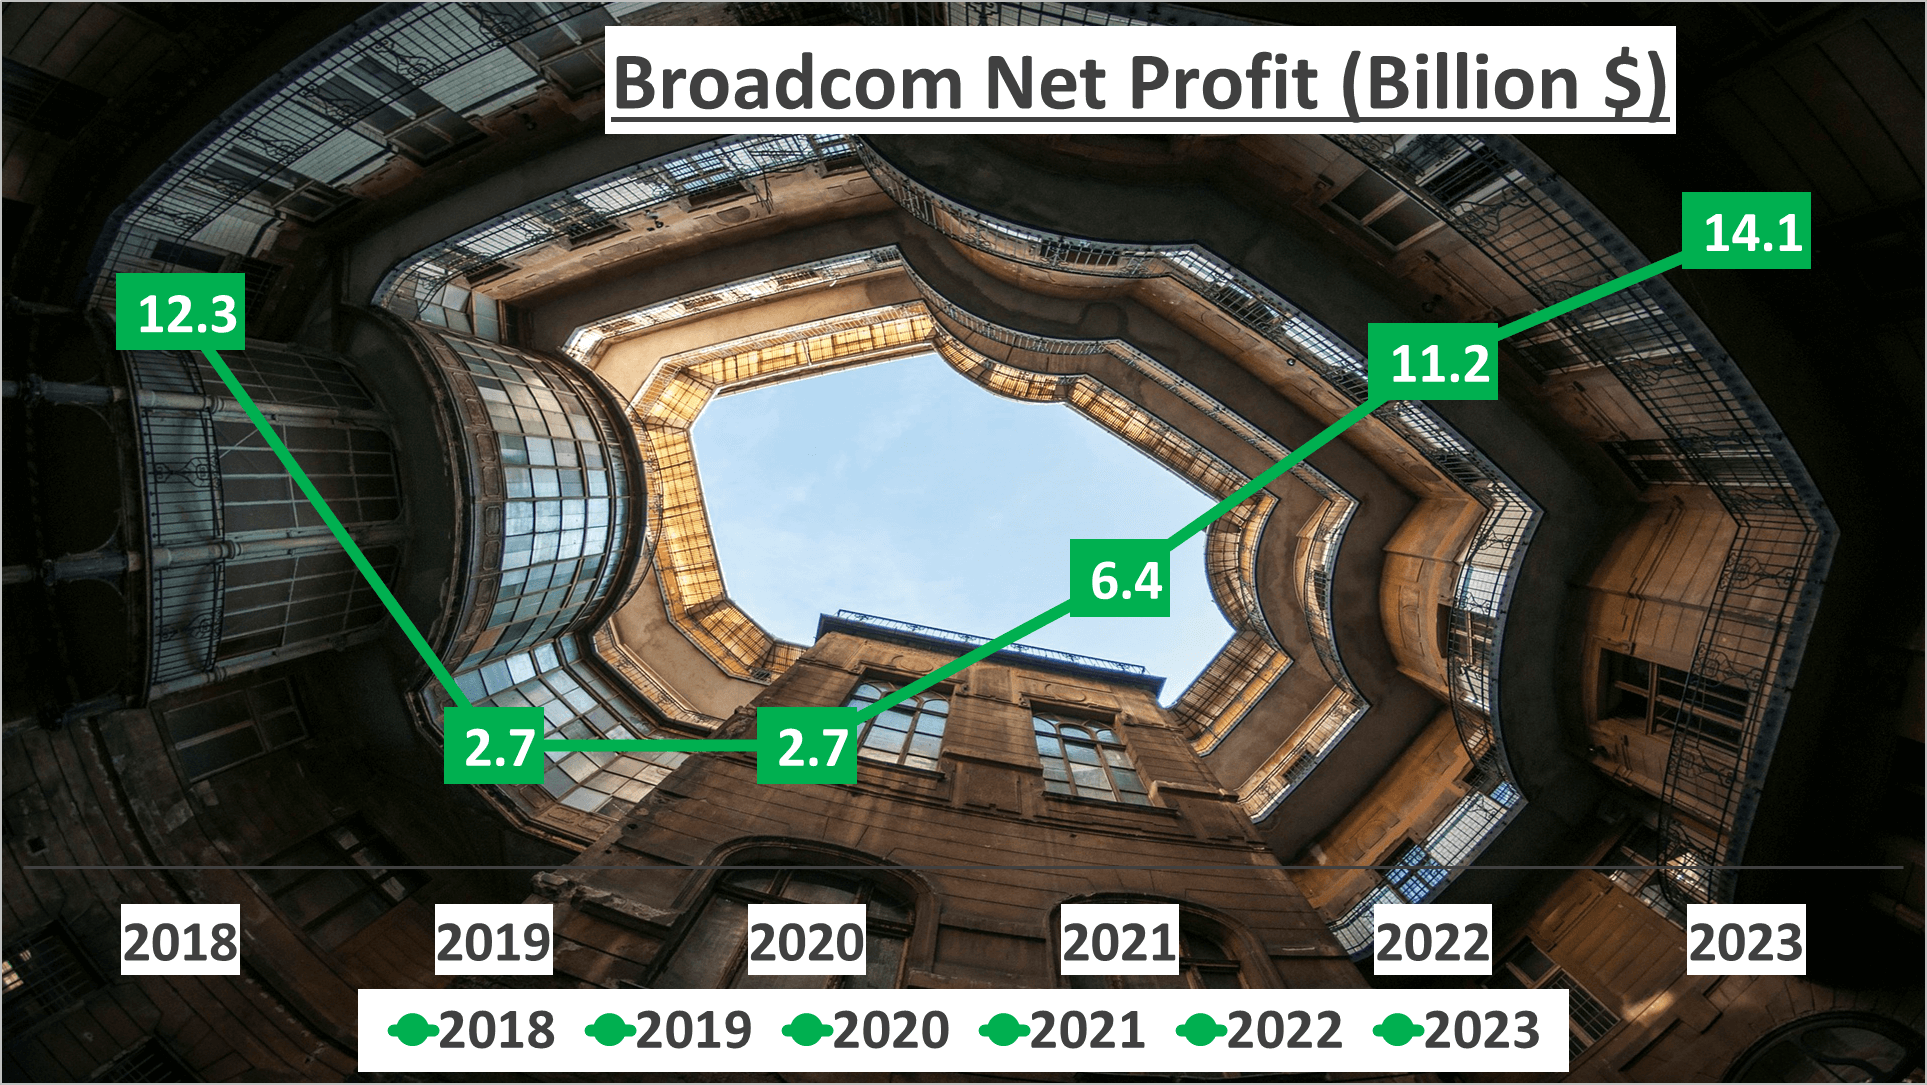
Let’s delve into Broadcom’s net profit and assets. In 2023, the company’s net profit reached an impressive $14.1B, reflecting a Compound Annual Growth Rate (CAGR) of 3% from 2018. However, comparing it to 2019, the CAGR skyrockets to a remarkable 51% annually.
Broadcom’s total assets in 2023 amounted to $72.9B, slightly lower than the $73.2B in the previous year. Conversely, net assets exhibited a positive trend, increasing from $23B in 2022 to $24B in 2023.
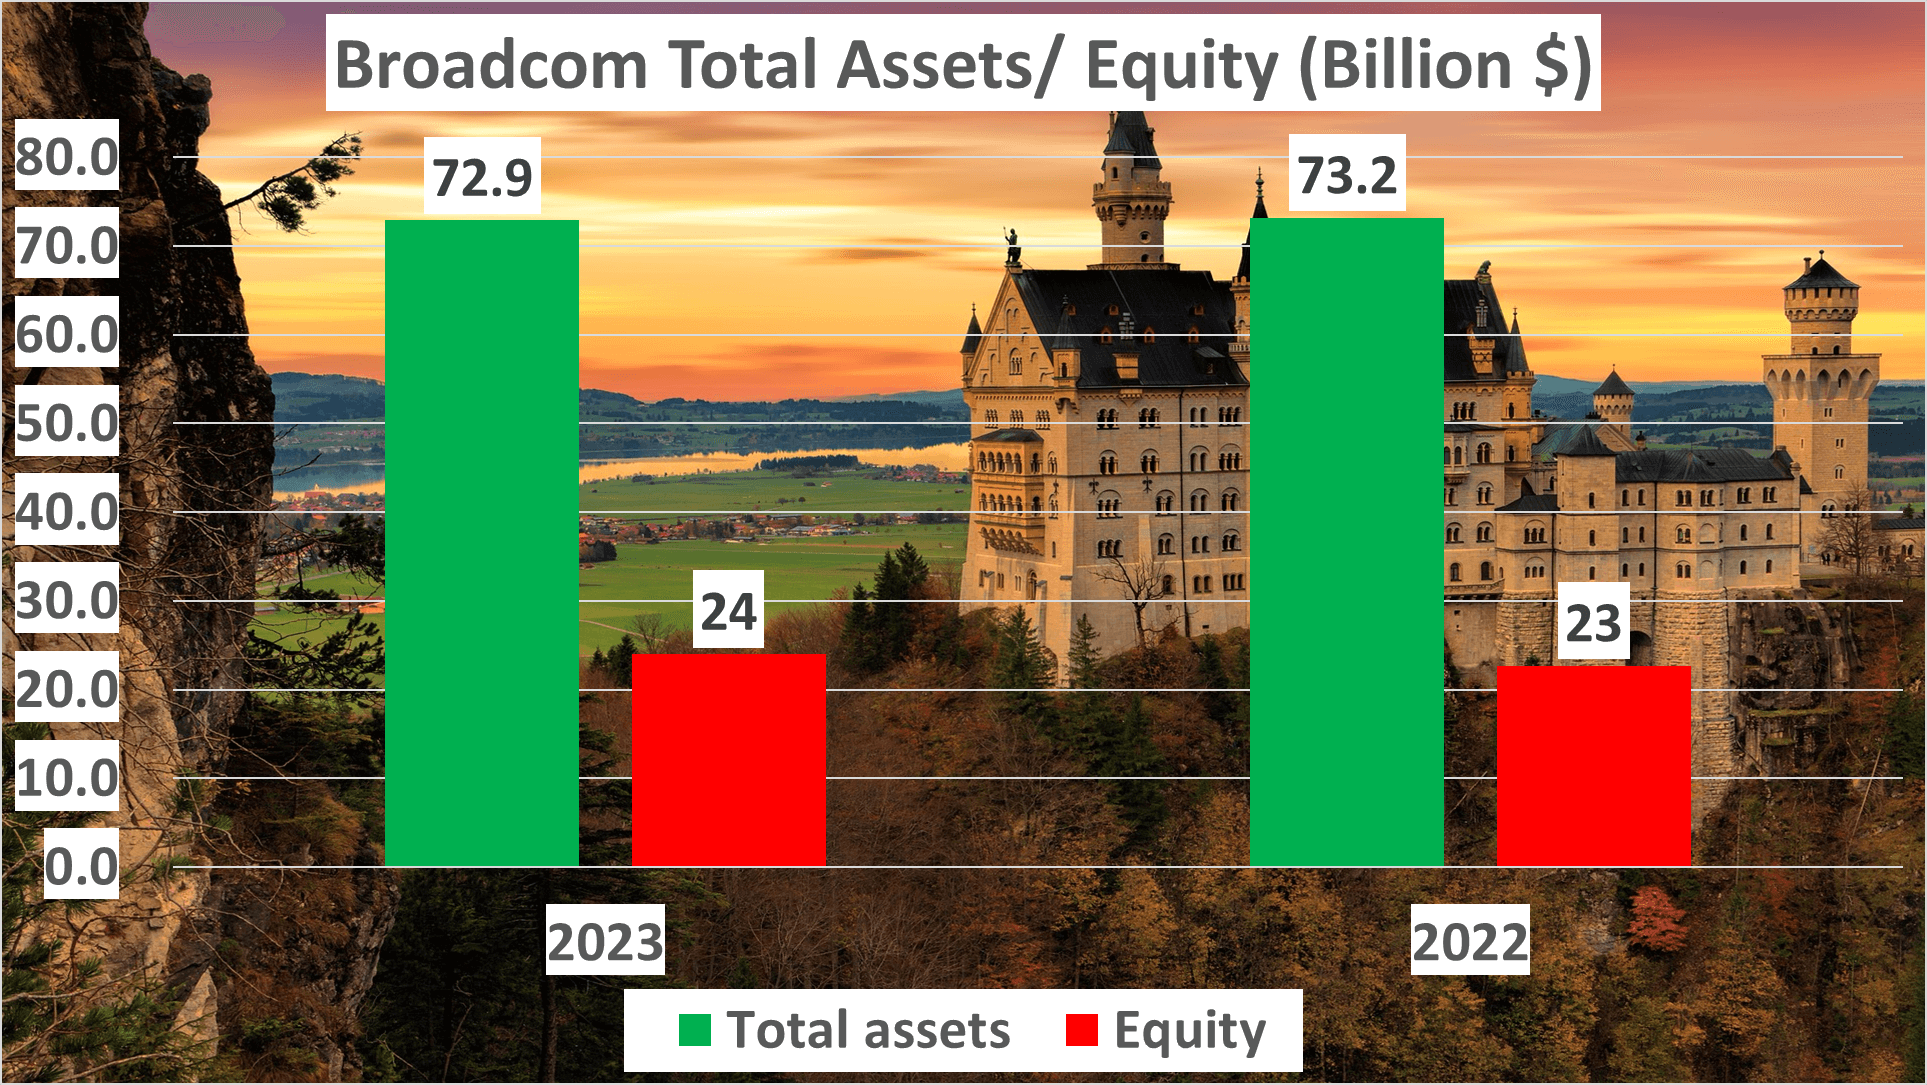
One noteworthy ratio is the equity to total assets ratio, which indicates the company’s financial leverage. In 2023, this ratio improved to 33% from 31% in the previous year. This signifies that Broadcom has been growing its equity at a faster rate than its total assets, a favorable sign for investors.
So, what’s the significance of all this? Simply put, Broadcom has consistently grown its net profits and assets over the past years. This financial robustness positions the company favorably for future growth, making it an appealing choice for investors.
Broadcom has demonstrated steady growth in both profits and assets, underlining its strength and potential for further expansion.
Leveraging Liquidity Ratios and Inventory Management – Broadcom Stock Analysis
Broadcom’s liquidity ratios and inventory management practices are worth noting. Upon examining the financials, we observe that in 2023, the company’s Current Ratio stood at a robust 2.81, marking a positive increase from the previous year’s 2.61. This signifies that Broadcom possessed ample current assets to cover its short-term liabilities, indicating a strong liquidity position.
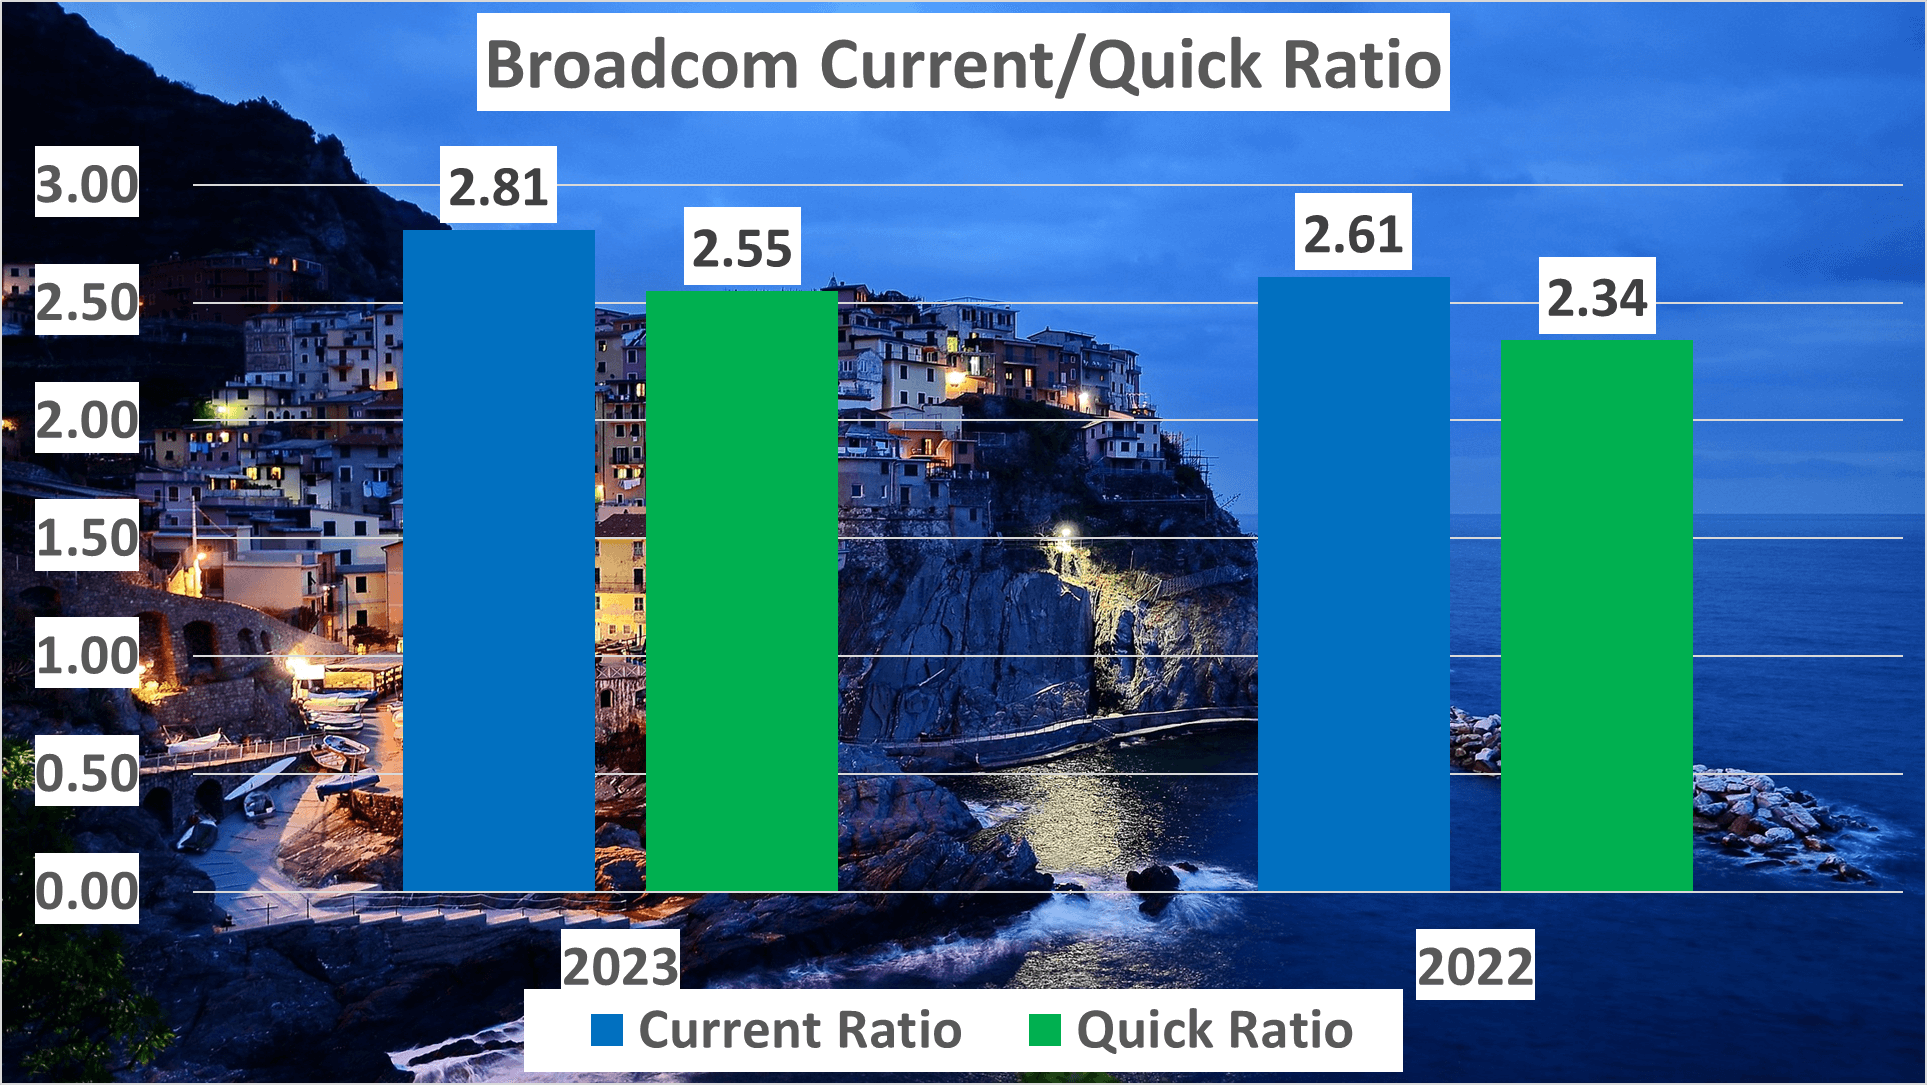
Furthermore, the Quick Ratio, a stricter measure of liquidity, exhibited a favorable trend. In 2023, Broadcom’s Quick Ratio was 2.55, up from 2.34 in 2022. This implies that even without factoring in inventory, Broadcom held sufficient liquid assets to fulfill its immediate obligations.
Now, let’s delve into inventory management, a critical aspect for any business. In 2023, Broadcom’s Inventory Days remained consistent at 62 days, mirroring the figure from 2022. This suggests that Broadcom typically held its inventory for approximately two months before selling it, showcasing stability and efficiency in inventory management over the years.
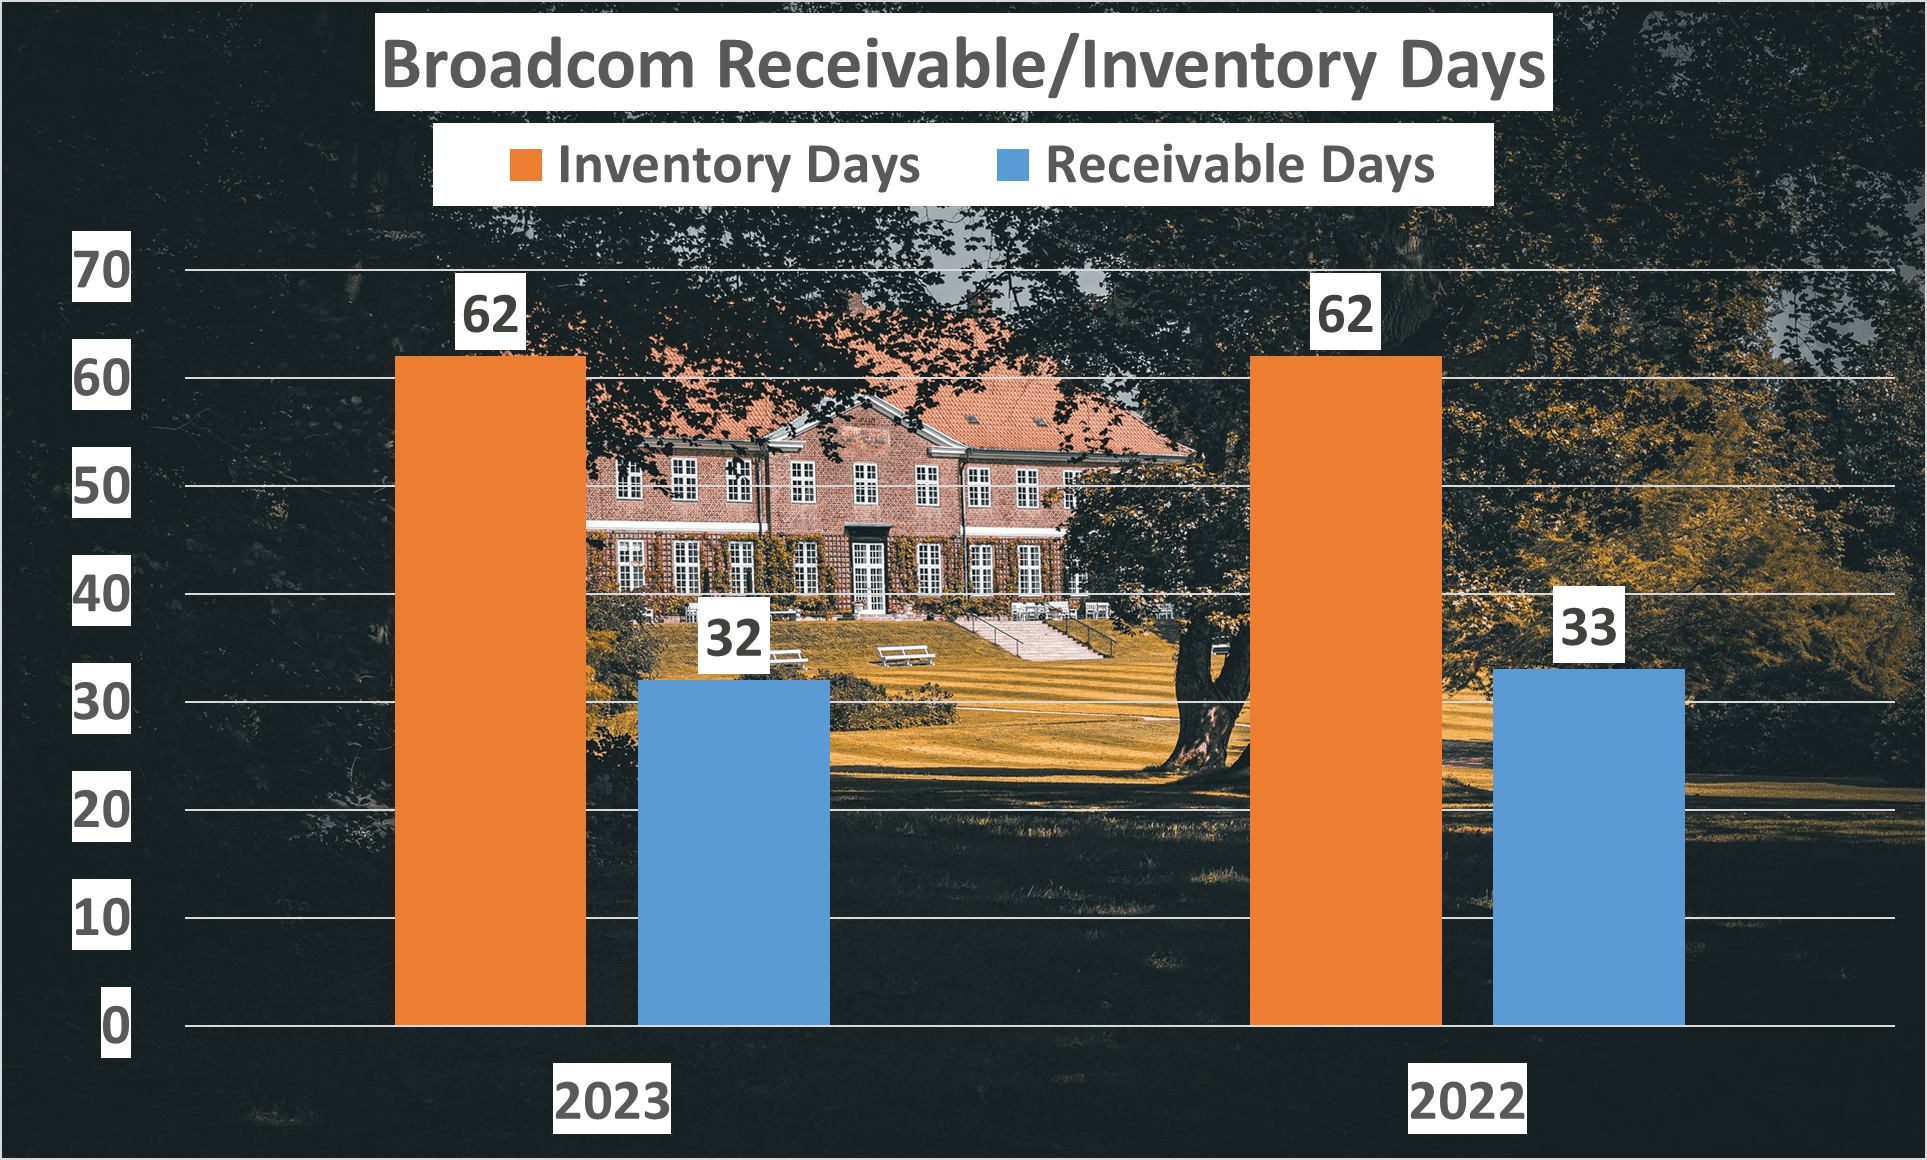
Similarly, the Receivable Days, indicating the average time taken by Broadcom to collect payment post-sale, remained steady. In 2023, the Receivable Days stood at 32, slightly down from 33 in 2022. This slight decrease indicates a faster collection period, contributing to improved cash flow.
In summary, Broadcom’s liquidity ratios and inventory management practices portray a financially sound company adept at resource management. This robust financial profile makes Broadcom an attractive prospect for investors. “Broadcom has maintained strong liquidity and efficient inventory management, bolstering its appeal for investors.
Exploring Cash Flows and Dupont Analysis – Broadcom Stock Analysis
Broadcom’s cash flows and return on equity warrant a closer examination. In 2023, Broadcom’s Operating Cash Flow (OCF) stood at a significant $18.1B, with Free Cash Flow (FCF) close behind at $17.6B.
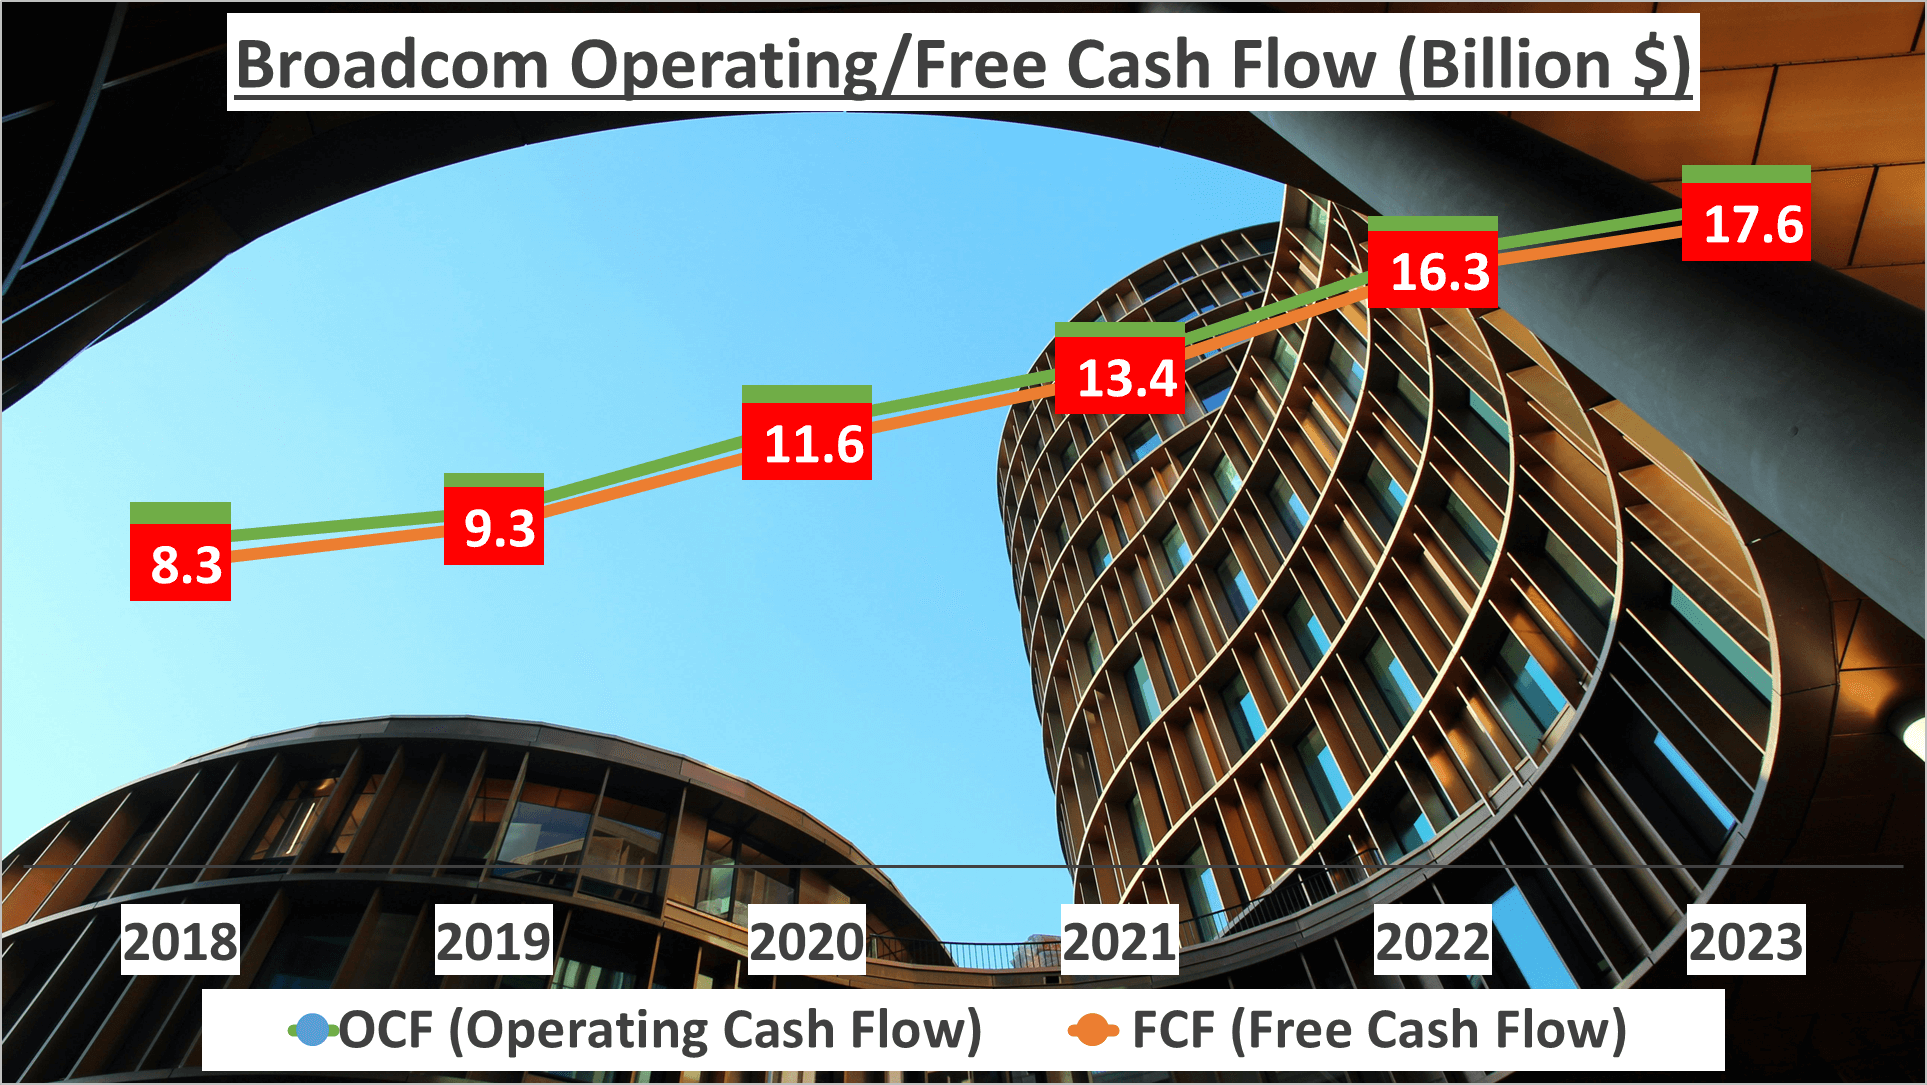
Comparing these figures to 2018 reveals a notable upward trajectory, with both OCF and FCF averaging a Compound Annual Growth Rate (CAGR) of around 15% during this period.
This underscores Broadcom’s robust financial health and its capacity to generate substantial cash for operational needs, investments, and shareholder returns.
Transitioning to Dupont analysis, this method dissects Return on Equity (ROE) into three components: Net Profit Margin, Asset Turnover, and Asset to Equity. In 2023, Broadcom’s ROE reached an impressive 59%. The Net Profit Margin, reflecting the portion of revenue converted into profit, stood at a solid 39%. Asset Turnover, indicating the efficiency of asset utilization for revenue generation, was 0.49. Lastly, the Asset to Equity ratio, illustrating the company’s financial leverage, was 3.04.
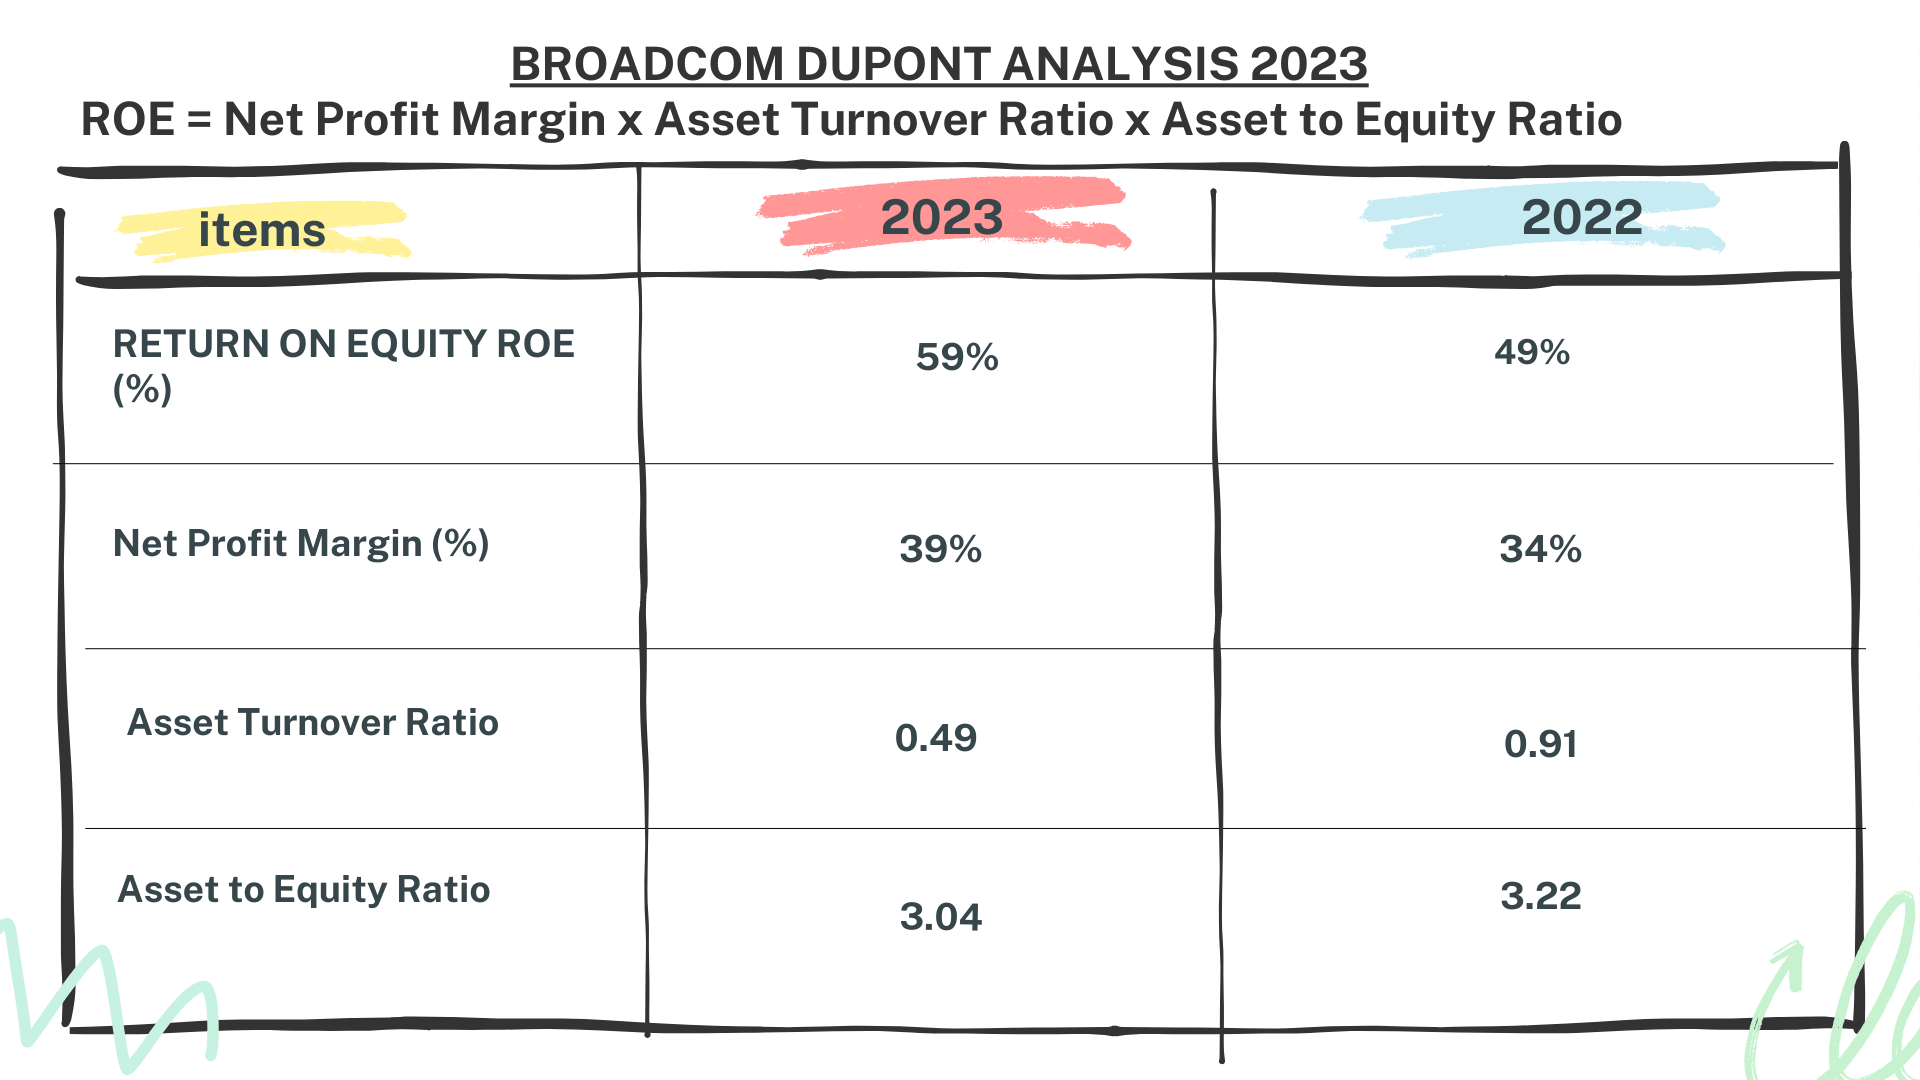
Comparing these metrics to the previous year, Broadcom’s ROE increased from 49% to 59%, primarily driven by enhanced Net Profit Margin and higher Asset to Equity leverage. Broadcom’s elevated Return on Equity is predominantly attributed to its robust Net Profit Margin and substantial Asset to Equity leverage.
This amalgamation of strong cash flows and high ROE underscores Broadcom’s resilient financial performance, rendering it an enticing prospect for investors seeking promising opportunities.
Concluding Thoughts – Broadcom Stock Analysis
So, what implications does this analysis hold for prospective investors?
Broadcom’s remarkable growth, sturdy profit margins, and resilient cash flows indicate a sound financial footing. Its consistent asset growth alongside controlled costs further fortify its position.
The elevated liquidity ratios signal stability, while the Dupont analysis underscores the company’s adeptness in leveraging its equity effectively.
Collectively, these factors paint a promising outlook for Broadcom’s future.
Don’t forget to subscribe for more insightful company analyses, and feel free to recommend which companies you’d like us to evaluate next!
Author: investforcus.com
Follow us on Youtube: The Investors Community


Thank you for writing this article. I appreciate the subject too.
You’ve been great to me. Thank you!