Carvana Stock Analysis – Imagine investing $1000 in Carvana in 2018. How much would that investment be worth by March 2024?
Well, the answer is a staggering $2,116, marking a 112% increase from the initial investment, equating to an impressive 16% annual growth rate. Now, that’s remarkable!
But, what’s the secret behind this phenomenal growth? What’s the magic formula that has enabled Carvana to generously reward its investors?
To unveil these burning inquiries, we must delve deep into Carvana’s financial performance. We’ll scrutinize their revenue, profit margins, net profit, assets, liabilities, and operational efficiency. This comprehensive analysis will provide insights into the factors driving Carvana’s stock prices and the sustainability of this growth.
So, get ready for an exhilarating journey through Carvana’s financial landscape. Understanding why requires a thorough review of Carvana’s financial performance.
The Revenue Analysis – Carvana Stock Analysis
Carvana’s revenue in 2023 reached an impressive $10.8B. Since 2018, the compound annual growth rate (CAGR) has been a substantial 40%. This growth underscores the company’s strategic direction and market acceptance.
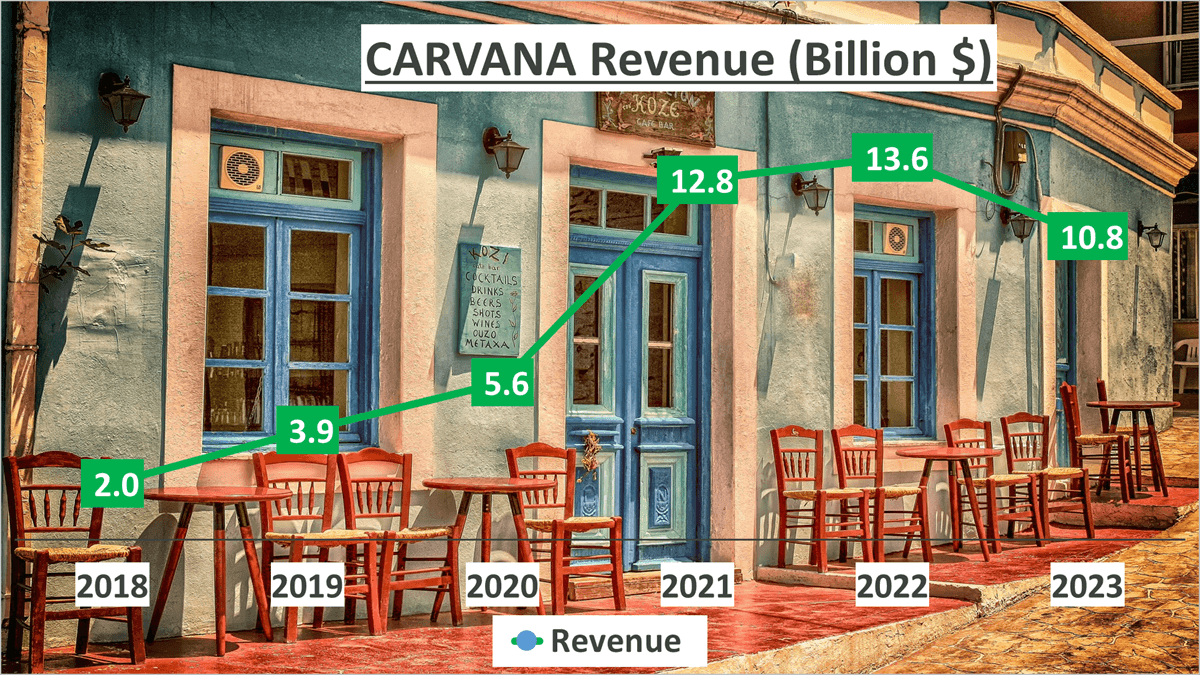
Breaking it down year by year reveals remarkable growth trends. Between 2018 and 2019, revenue surged by an astounding 95%. This momentum continued with a 44% increase from 2019 to 2020 and an exceptional 129% rise from 2020 to 2021.
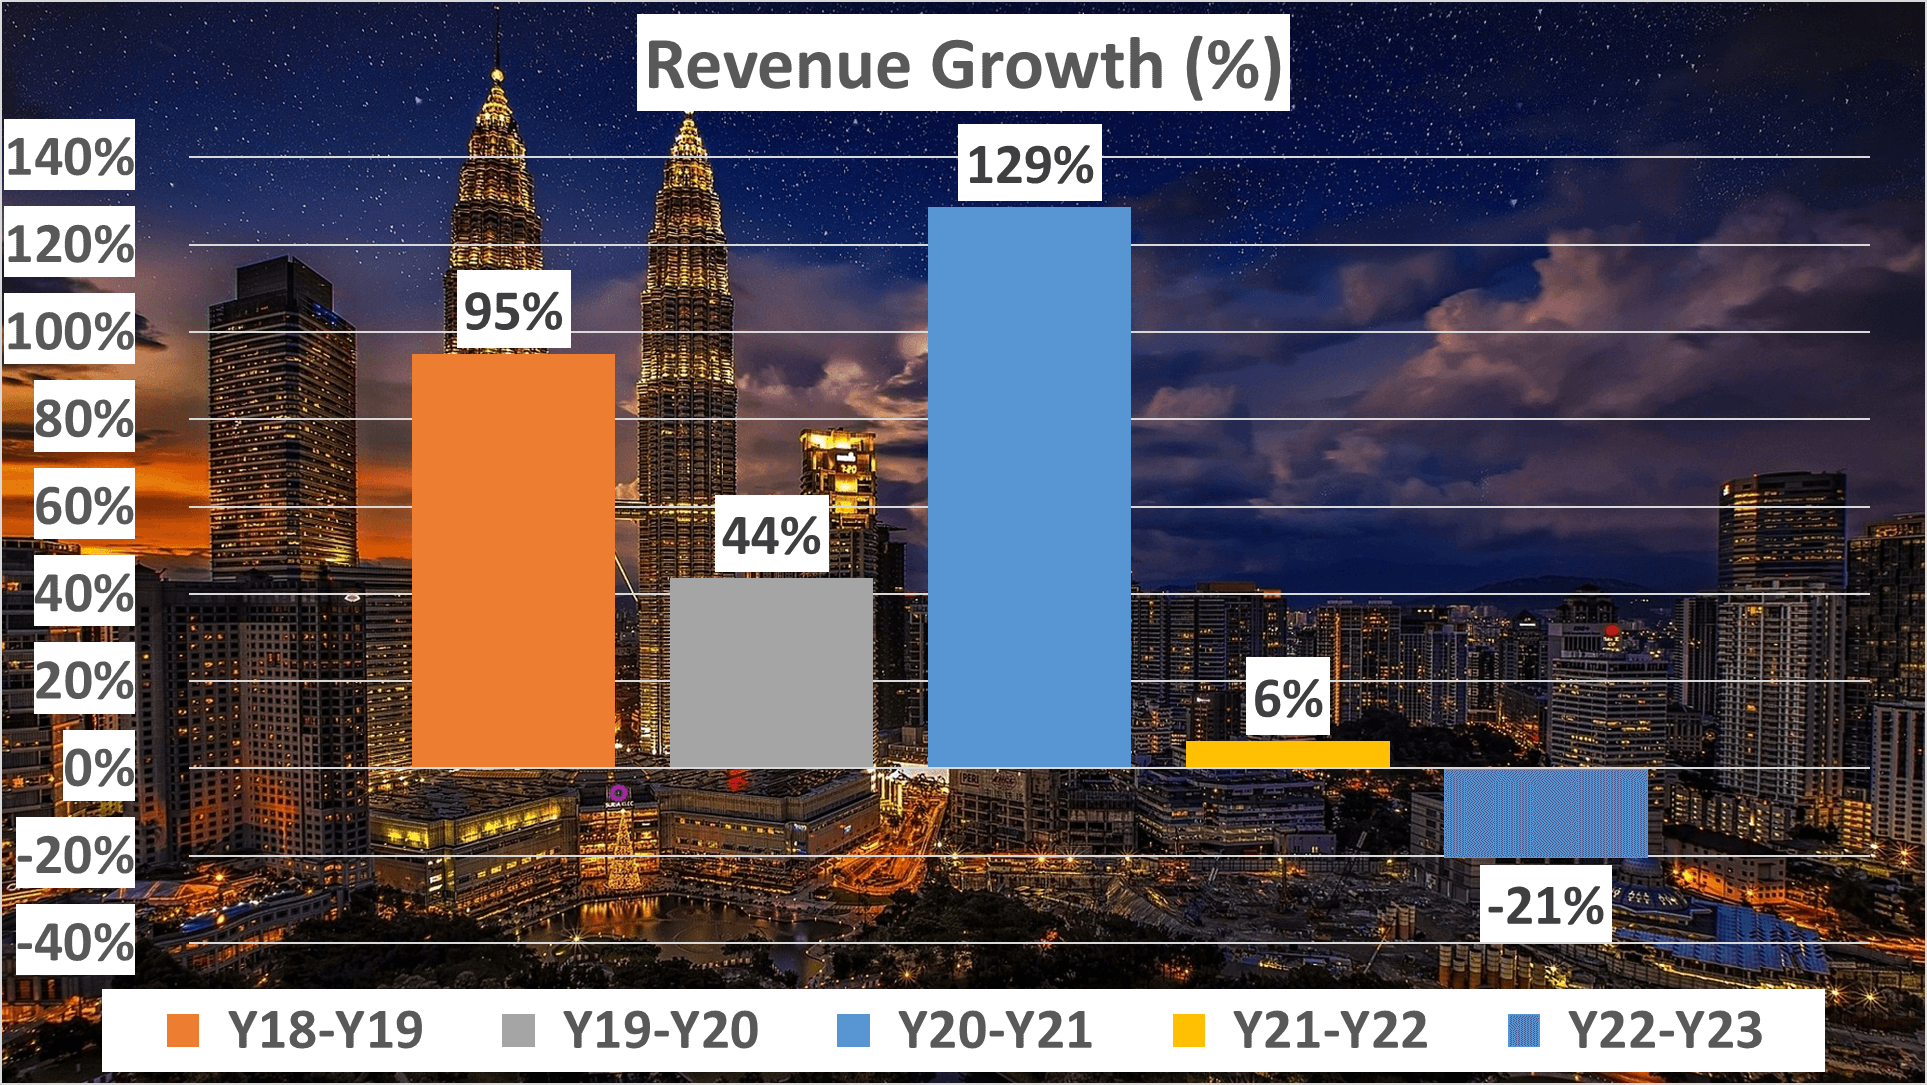
However, growth slowed slightly in subsequent years, with a 6% increase from 2021 to 2022 and a 21% decrease from 2022 to 2023. Despite this decline, the overall growth trajectory remains impressive, given the relatively short period.
Fluctuations in later years can be attributed to various factors, including market saturation, heightened competition, or external factors beyond the company’s control.
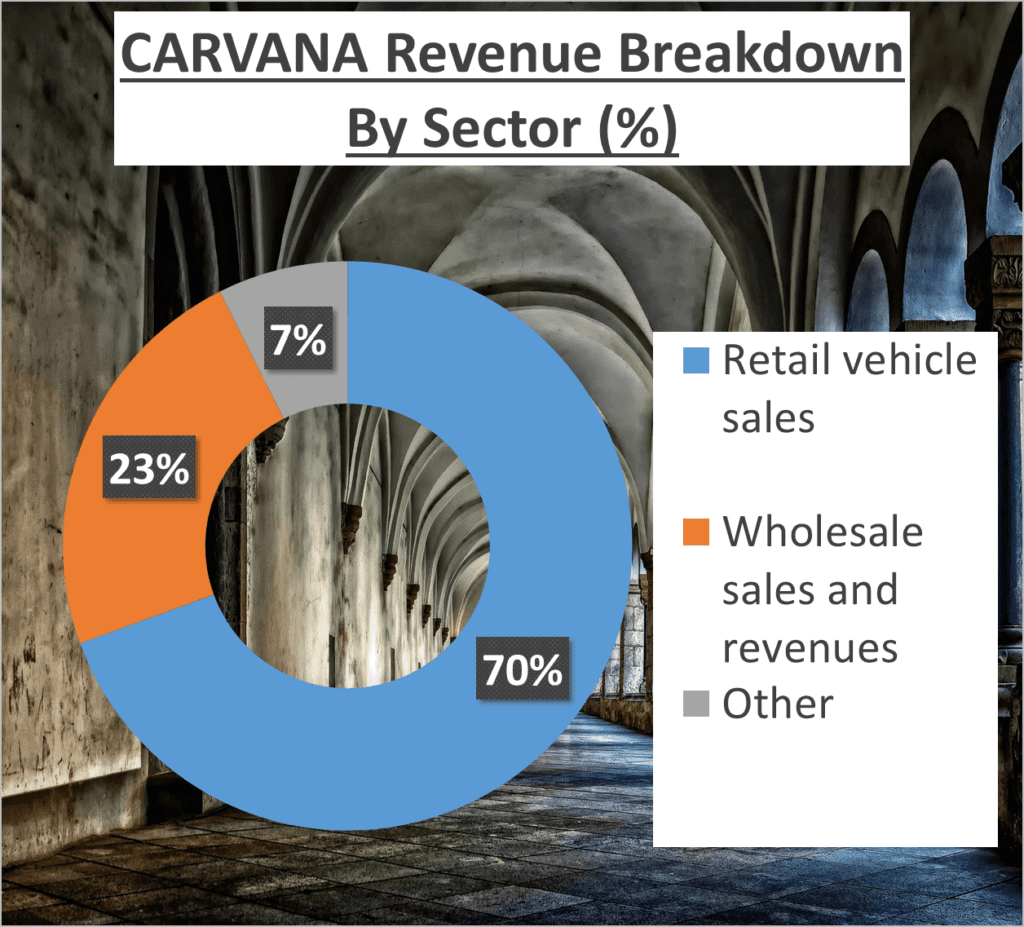
Examining revenue composition, 70% is from retail vehicle sales, 23% from wholesale sales and revenues, with the remaining 7% from other sources. This diversified revenue stream indicates a robust and healthy business model.
In summary, Carvana has experienced rapid growth, seizing market opportunities and diversifying revenue streams for stability and sustainability. However, revenue alone doesn’t tell the full story. Next, we’ll delve into profit margins to gain a comprehensive understanding.
The Profit Margin Analysis – Carvana Stock Analysis
In 2023, Carvana’s gross profit margin stood at 17%, compared to a five-year average of 13%. This notable increase signifies the company’s enhanced efficiency in converting revenue into profit. The gross profit margin, representing the percentage of total sales revenue retained after deducting direct production costs, reflects this improvement.
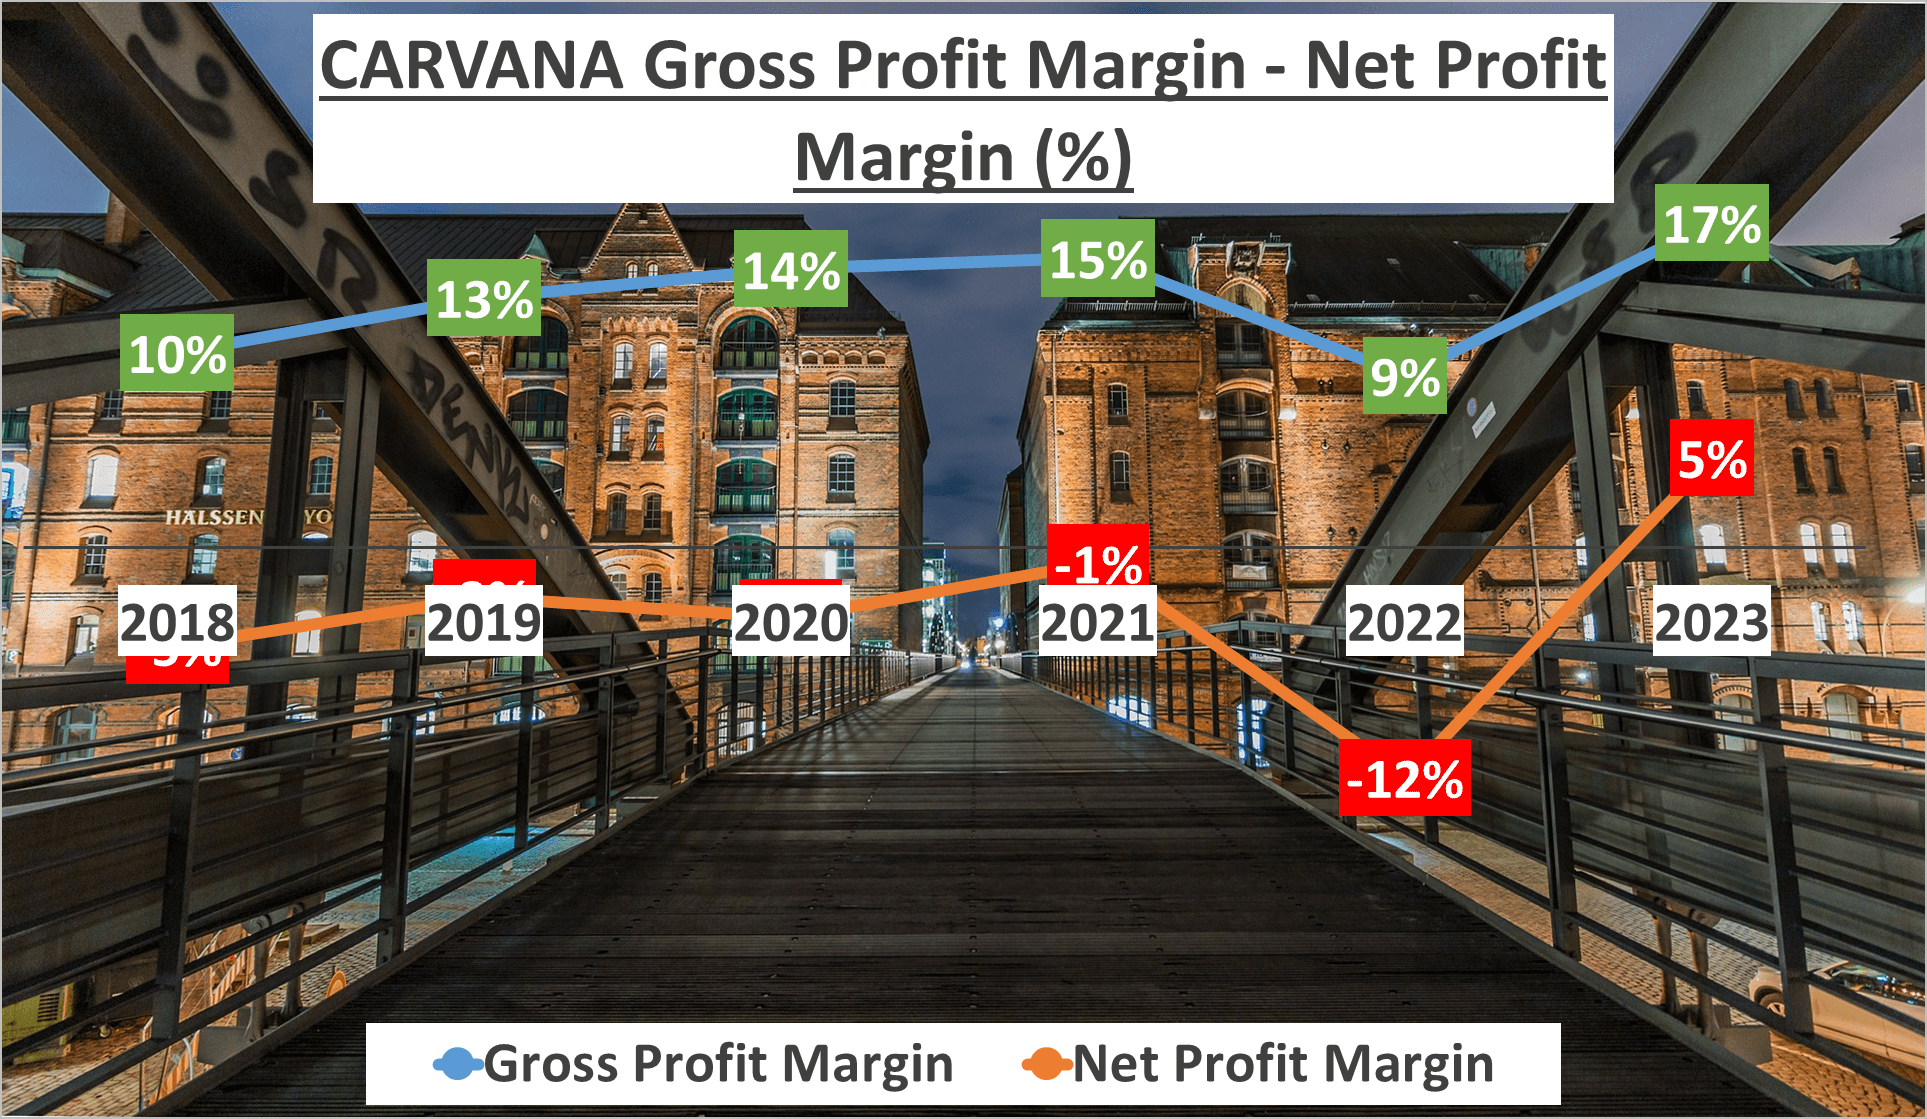
Now, shifting focus to the net profit margin, Carvana recorded a 5% margin in 2023, in contrast to a five-year average of -3%. This turnaround is remarkable. The net profit margin, a crucial profitability metric, indicates the portion of revenue retained as profit after accounting for all expenses.
These figures indicate Carvana’s growing profitability and efficiency, outperforming industry averages. While the automotive retail industry’s average gross profit margin hovers around 15%, Carvana exceeds this benchmark slightly. Moreover, with an industry average net profit margin of approximately 2.5%, Carvana demonstrates a significant lead.
However, it’s essential to acknowledge the variance in these figures across industry players due to differing business models and operational efficiencies.
You might wonder why the net profit margin trails behind the gross profit margin. This is because the net profit margin incorporates all operating expenses, including overheads, interest, and taxes, while the gross profit margin solely considers the cost of goods sold.
Despite positive profit margins, Carvana’s 2023 net profit amounted to just $500M. While this marks the company’s first profitable year since 2018, it also underscores the potential for enhancing the bottom line.
As an investor, monitoring these factors is crucial for informed decision-making.
The Net Profit Analysis – Carvana Stock Analysis
In 2023, Carvana’s net profit amounted to $500M, marking the first year of positive net profit since 2018.

Let’s reflect on the significance of this pivotal moment in Carvana’s financial journey. A positive net profit serves as a robust indicator of a company’s financial well-being, representing a milestone every business strives to attain. It signals that the company’s revenues surpass its costs, reflecting efficiency and effective management.
But what does this achievement signify for Carvana’s future? The inaugural year of positive net profit often symbolizes a breakthrough, indicating to investors that the company has not only survived the initial startup phase but has also transitioned into a phase of sustainable profitability. It underscores that the business model is effective and the company is on the right trajectory.
However, it’s essential to consider the broader context. The year 2023 posed challenges for many businesses due to global economic uncertainties and the ongoing impact of the pandemic. Against this backdrop, Carvana’s accomplishment assumes even greater significance, demonstrating resilience and adaptability, traits highly valued by investors.
Nevertheless, while a single year of positive net profit is commendable, it does not guarantee future success. The business landscape is dynamic, requiring companies to continually adapt and innovate to remain profitable. For Carvana, the challenge lies in leveraging this success and sustaining profitability in the years ahead.
To achieve this, the company must focus on enhancing operational efficiency, expanding market share, and perpetuating innovation in its services and business model. If executed successfully, the future holds promise for Carvana.
However, it’s imperative to recognize that net profit is just one facet of the overall picture. To gain a comprehensive understanding of Carvana’s financial health, we must also assess its assets and liabilities, cash flow, and operational efficiency.
While positive net profit is encouraging, evaluating the company’s assets and liabilities is equally crucial.
The Assets and Liabilities Analysis – Carvana Stock Analysis
In 2023, Carvana’s total assets amounted to $7.1B, compared to $8.7B in 2022, indicating a significant decrease. But what implications does this hold for Carvana’s financial health? Let’s delve deeper.
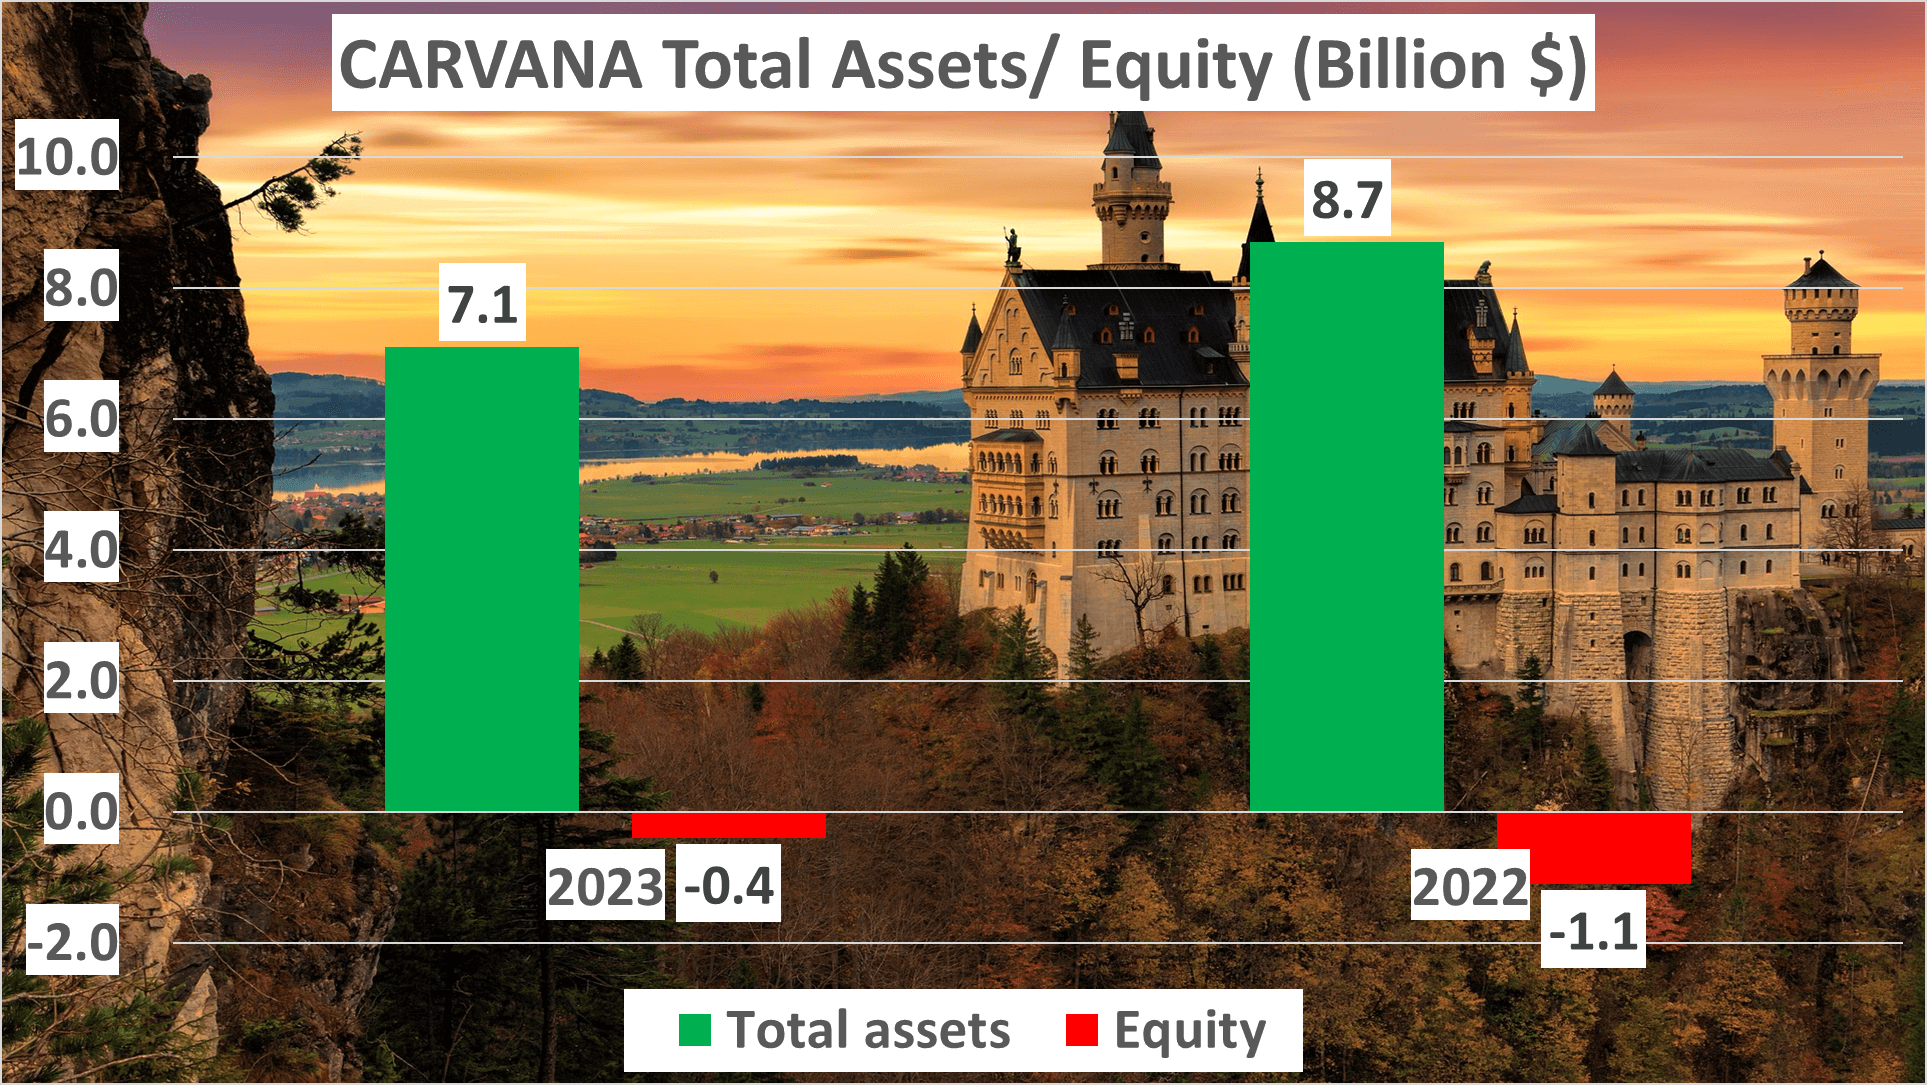
Total assets encompass both current and non-current assets. Current assets can be converted into cash within a year, while non-current assets are long-term investments not easily liquidated. The decline in total assets may suggest a reduction in inventory, receivables, or cash reserves, signaling a streamlined operation or potentially the sale of long-term assets.
Now, shifting focus to liabilities, net assets in 2023 were -$400M, compared to -$1.1B in 2022. This reduction in net liabilities indicates Carvana’s ability to repay debts, a positive indicator for the company’s financial stability.
The Equity to Total Assets ratio in 2023 stood at -6%, an improvement from -13% in 2022. Although still negative, this enhancement demonstrates Carvana’s gradual reduction of financial leverage, moving towards a more balanced capital structure.
Let’s discuss key financial ratios. The current ratio, measuring a company’s ability to cover short-term obligations, was 2.2 in 2023, up from 1.77 in 2022, signifying improved short-term financial health.
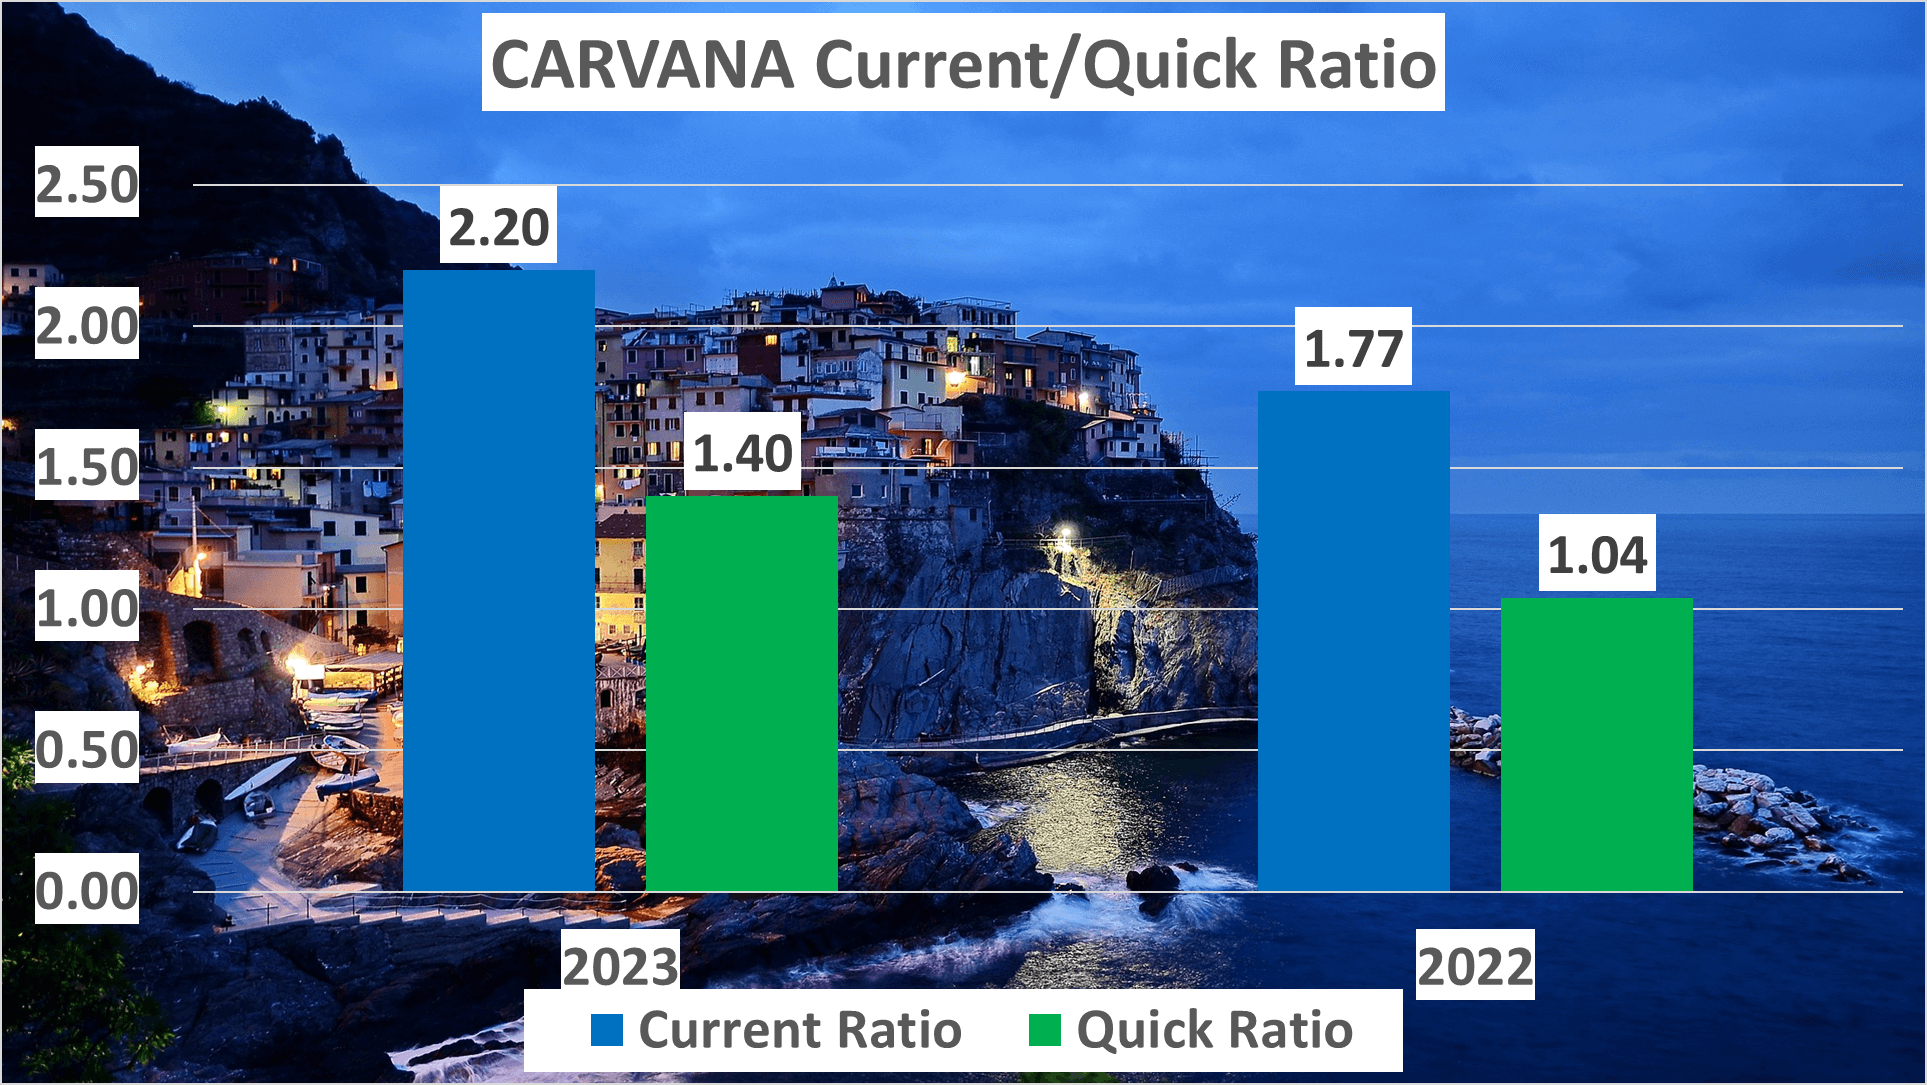
The quick ratio, a stringent liquidity measure, was 1.4 in 2023, compared to 1.04 in 2022, indicating Carvana’s increased capability to meet immediate obligations using its most liquid assets.
In summary, despite the decline in total assets, Carvana’s financial health appears to be improving, evidenced by reduced liabilities and enhanced key financial ratios. While financial indicators are positive, let’s not overlook operational efficiency.
The Operational Efficiency Analysis – Carvana Stock Analysis
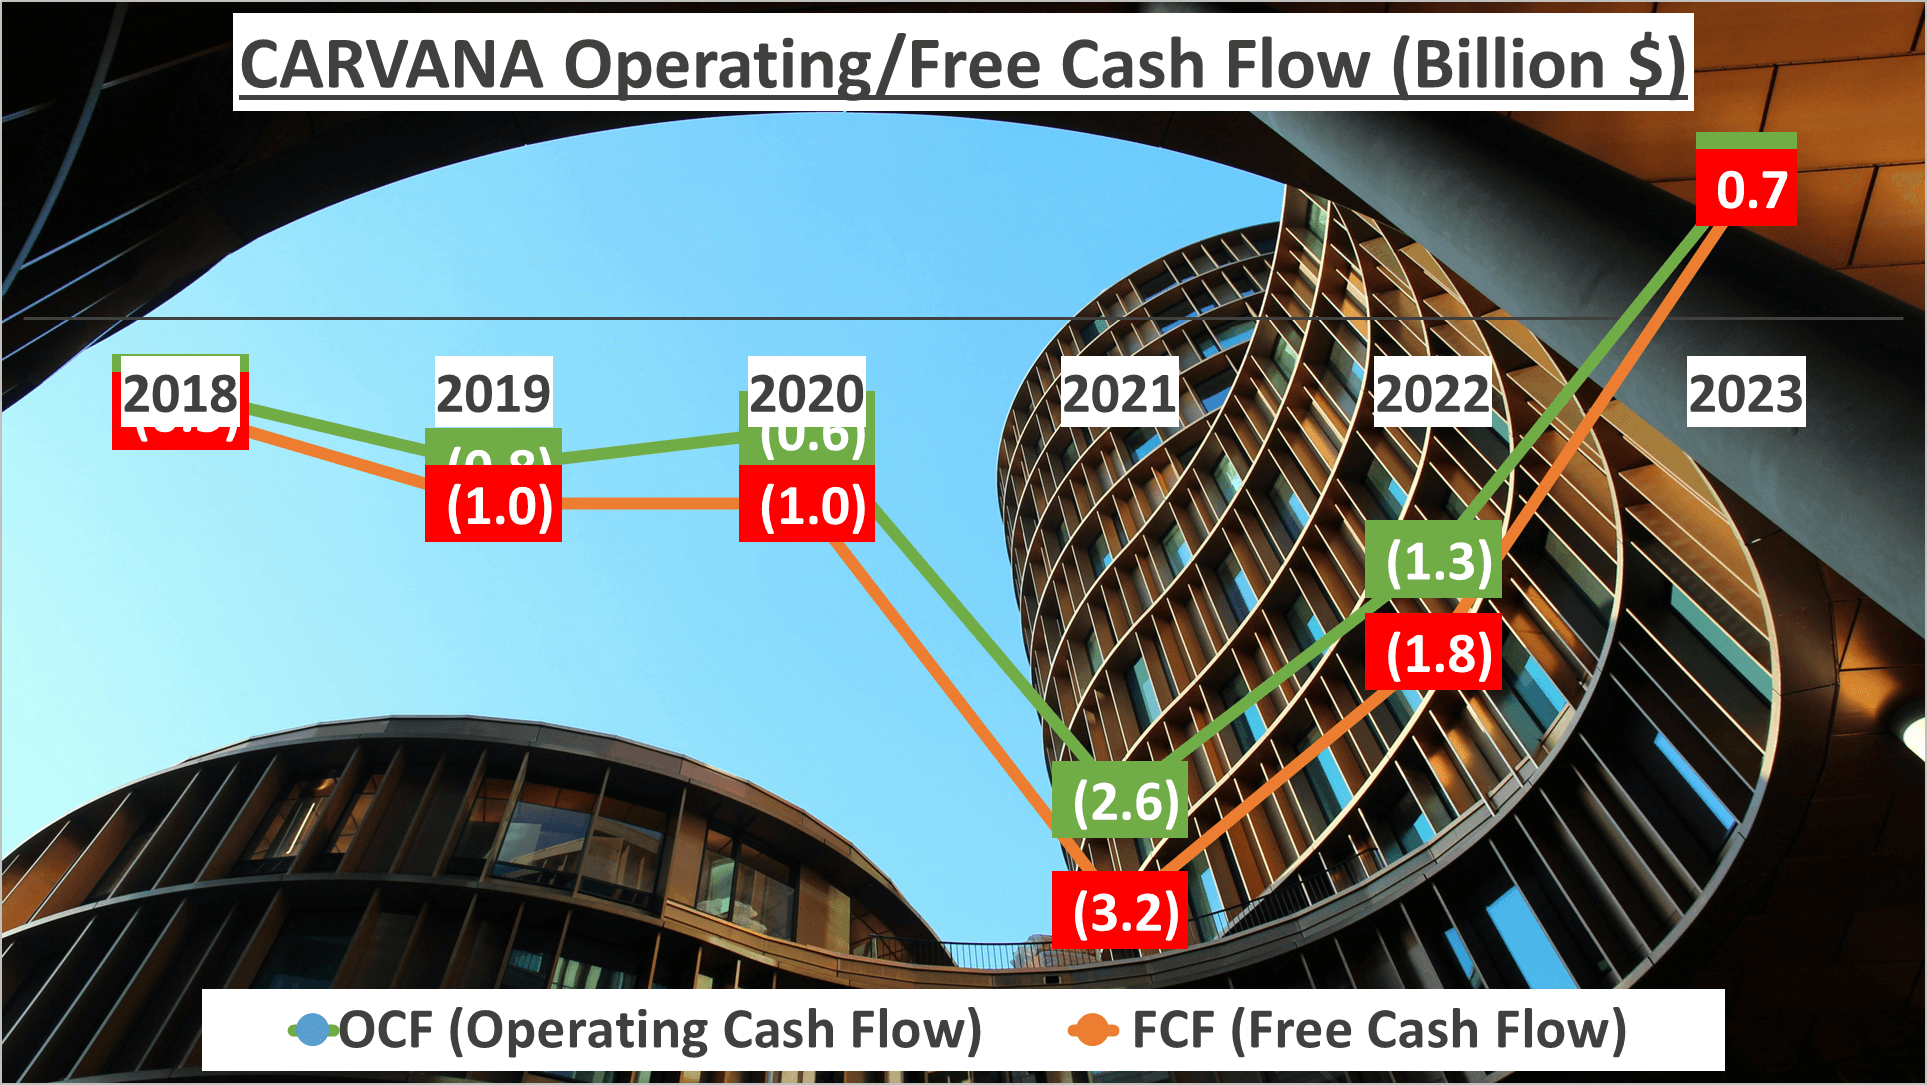
In 2023, Carvana’s operating cash flow amounted to $800M, while its free cash flow reached $700M. These figures underscore the company’s adeptness in generating cash from its core business operations.
Now, let’s delve into pivotal metrics of operational efficiency. In the same year, Carvana’s inventory days increased to 63 from 56 in the previous year. This signifies the average number of days items remain in inventory before being sold.
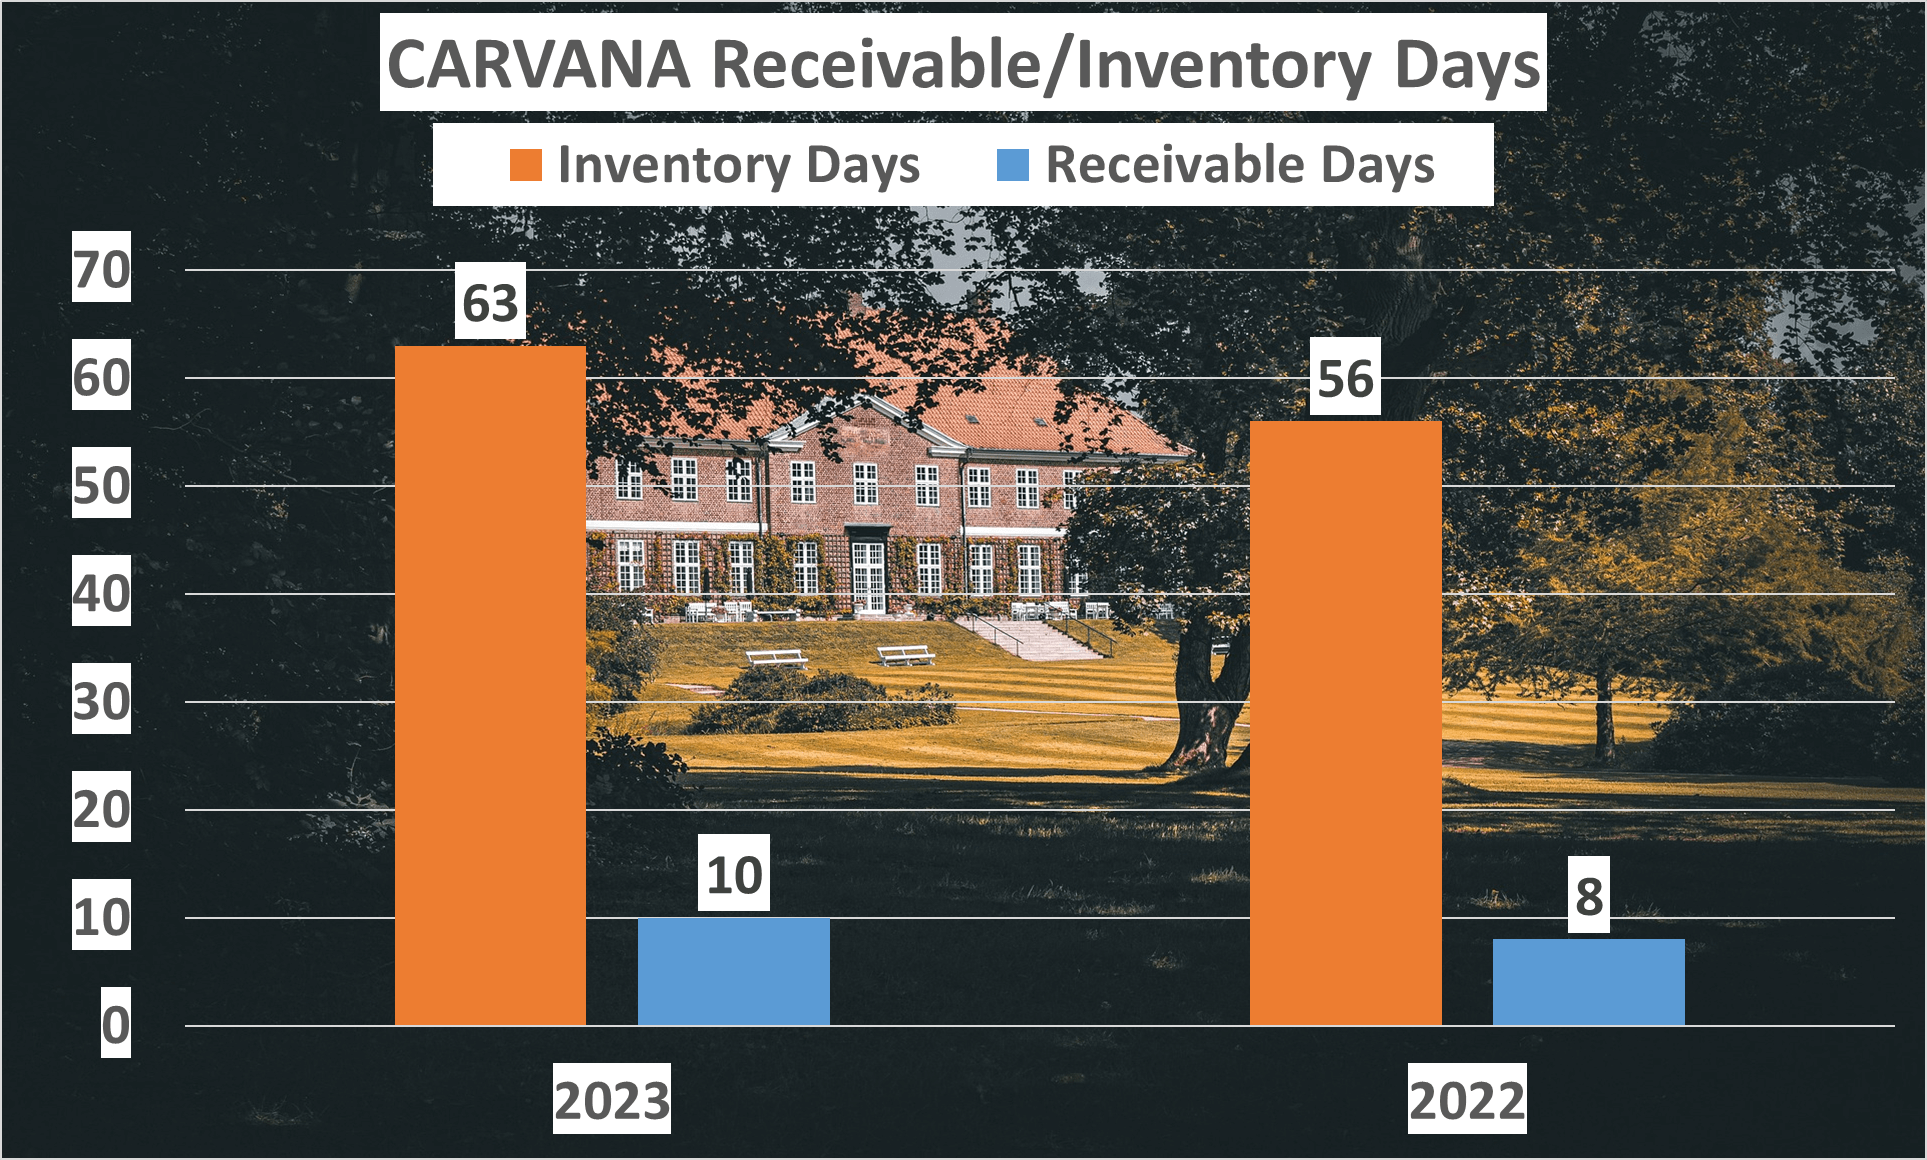
Conversely, the company’s receivable days rose to 10 from 8 in 2022, indicating the average number of days taken to collect payment after a sale. These metrics offer insights into Carvana’s management of inventory and receivables, both critical elements of operational efficiency.
In conclusion, this presents a comprehensive analysis of Carvana’s financial performance. Don’t forget to subscribe and let us know your preferences for businesses to analyze in our upcoming articles.
Watching more on Youtube:
Author: investforcus.com
Follow us on Youtube: The Investors Community

