The Revenue Rumble: Coca-Cola vs PepsiCo Stock Analysis, curious about which soda titan, Coca-Cola or PepsiCo, reigns supreme in financial prowess? Let’s crunch the numbers.
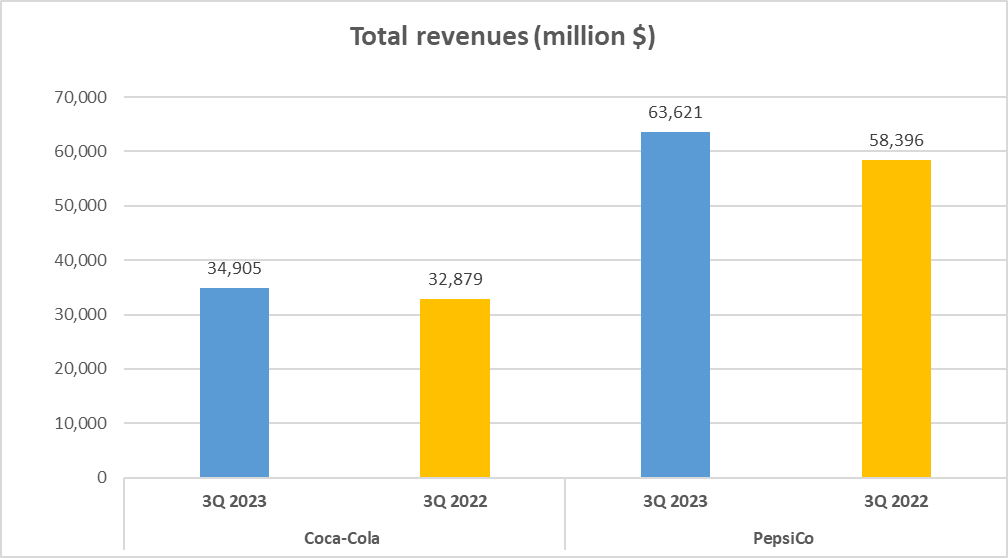
In the soda showdown, the fiscal year 2023 revenues paint an intriguing picture. Coca-Cola tallied an impressive $35B, while PepsiCo surged ahead with a staggering $64B.
Delving deeper, revenue streams for these beverage giants mirror their vast offerings. Coca-Cola’s earnings span the globe: 18% from Europe, the Middle East, and Africa, 12% from Latin America, a substantial 36% from North America, and the remaining 12% from the Asia Pacific region.
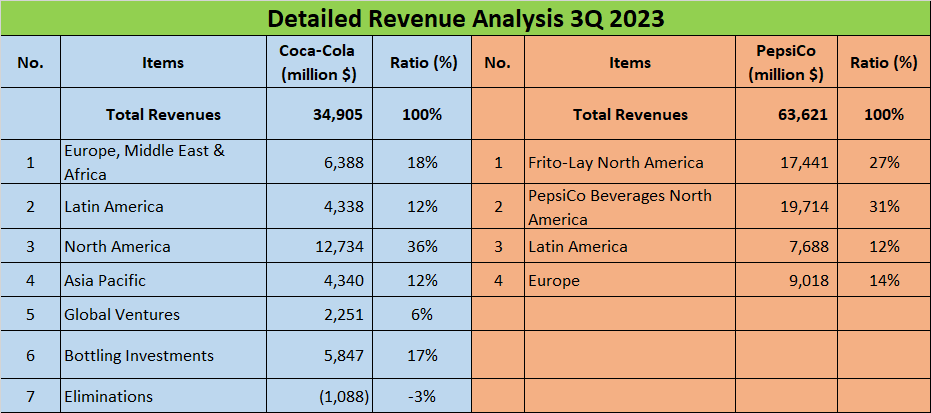
In contrast, PepsiCo’s revenue makeup tells a different story. A substantial 27% hails from Frito-Lay North America, another 31% from PepsiCo Beverages North America, 12% from Latin America, and 14% from Europe.
What’s the takeaway? While PepsiCo leads in total revenue, Coca-Cola’s revenue streams are more globally dispersed, highlighting its extensive international footprint. PepsiCo’s strength, conversely, lies in the North American market.
In this revenue showdown, it’s clear: different strategies for different markets. PepsiCo may dominate in total revenue, but Coca-Cola’s diverse global revenue distribution solidifies its status as a worldwide contender.
In summary, although PepsiCo edges out Coca-Cola in total revenue, Coca-Cola’s broad geographic revenue distribution underscores its global influence.
Profit Maximization: Coca-Cola vs Pepsi Stock Analysis
Quenching our thirst for revenue, let’s now sip on profit figures. It’s time to explore the Gross Profit Margin, Net Profit, and Net Profit Margin of both Coca-Cola and PepsiCo.
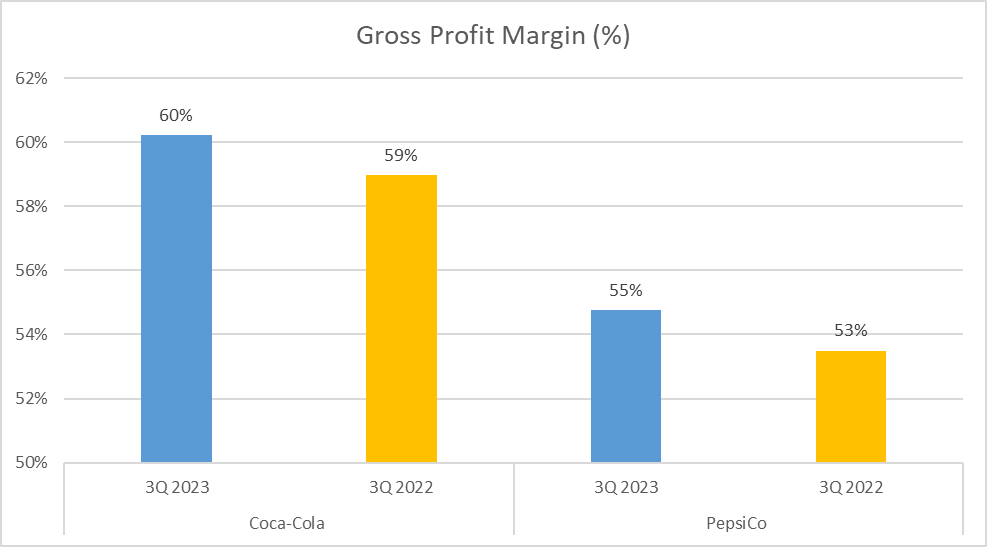
Starting with the Gross Profit Margin, Coca-Cola bubbles over at 60%, with PepsiCo trailing slightly behind at 55%. This metric offers insights into financial health, indicating the percentage of revenue exceeding the cost of goods sold. Higher values signify better financial strength.
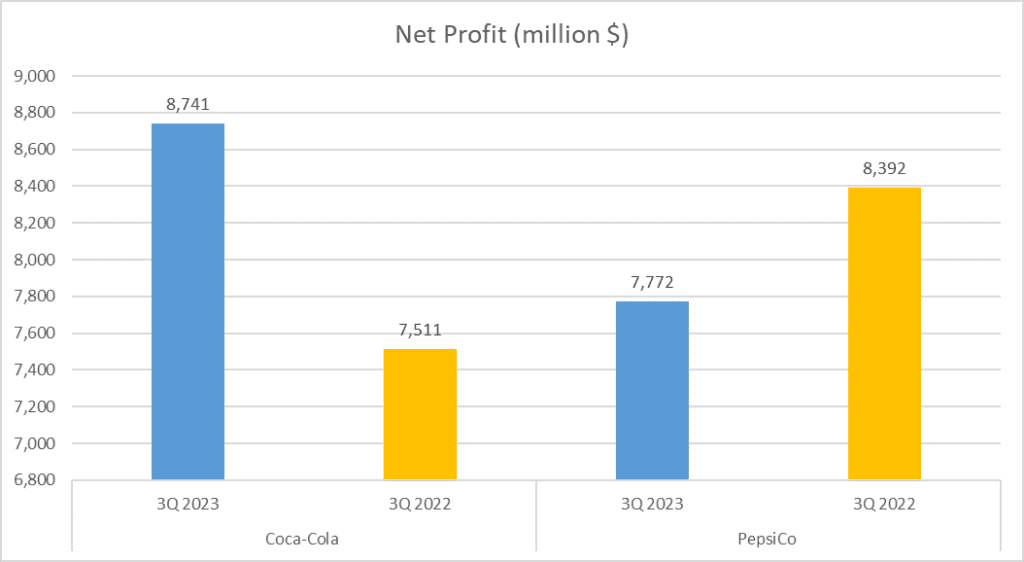
Moving on to Net Profit, Coca-Cola soared to $9B in 2023, closely followed by PepsiCo at $8B. Net Profit represents actual profit after expenses not included in gross profit calculation are paid. It’s a crucial figure for investors, reflecting the company’s retained revenue.
Lastly, the Net Profit Margin: Coca-Cola boasts a robust 25%, while PepsiCo lags at 12%. This metric, calculated by dividing net profit by revenue and multiplying by 100, showcases the portion of revenue retained as profit after all costs are covered.
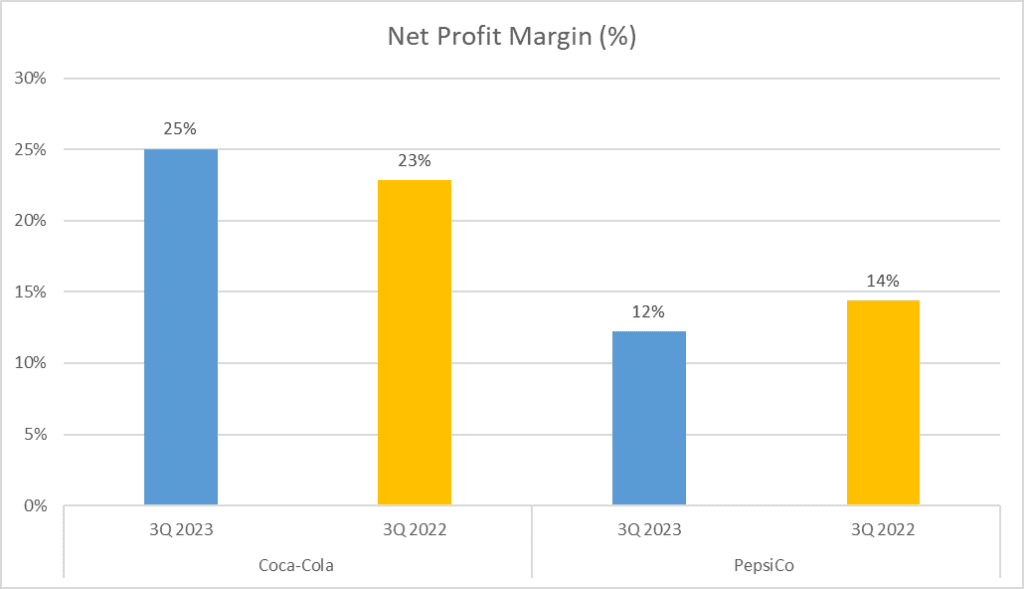
In summary, Coca-Cola demonstrates higher profitability with superior Gross and Net Profit Margins, despite PepsiCo’s larger revenue. However, financial prowess isn’t solely about profit. In our next segment, we’ll delve into returns and assets for a holistic view of these beverage giants’ financial vitality. Stay tuned, and let your investor instincts guide you through!
Maximizing Returns and Assets: Coca-Cola vs Pepsi Stock Analysis
In the realm of finance, returns and assets play a pivotal role. Let’s delve into the numbers and compare how Coca-Cola and PepsiCo fare in this arena.
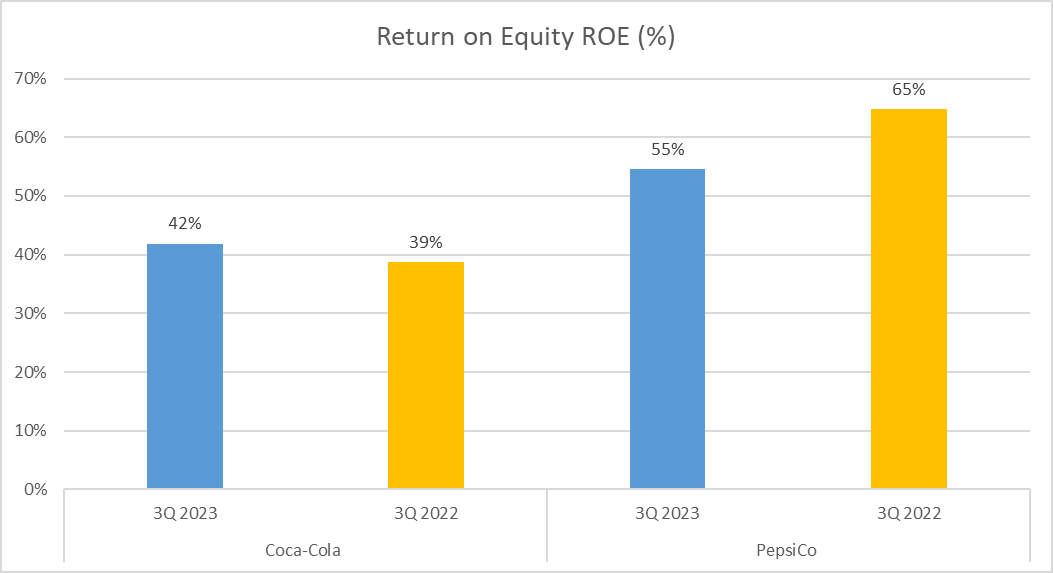
Beginning with Return on Equity (ROE), Coca-Cola stands at 42%, indicating its efficiency in utilizing equity to generate profit. On the flip side, PepsiCo shines with an ROE of 55%, suggesting superior efficiency in income generation.
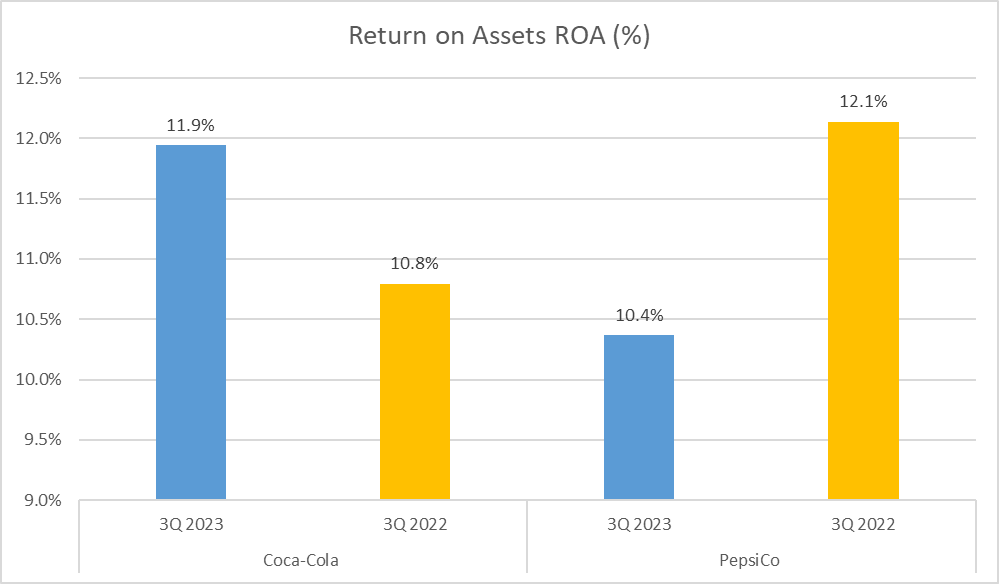
Now, let’s shift focus to Return on Assets (ROA), a metric showcasing how effectively assets generate earnings. Coca-Cola boasts an ROA of 11.9%, slightly ahead of PepsiCo’s 10.4%, implying better asset utilization for profit generation.
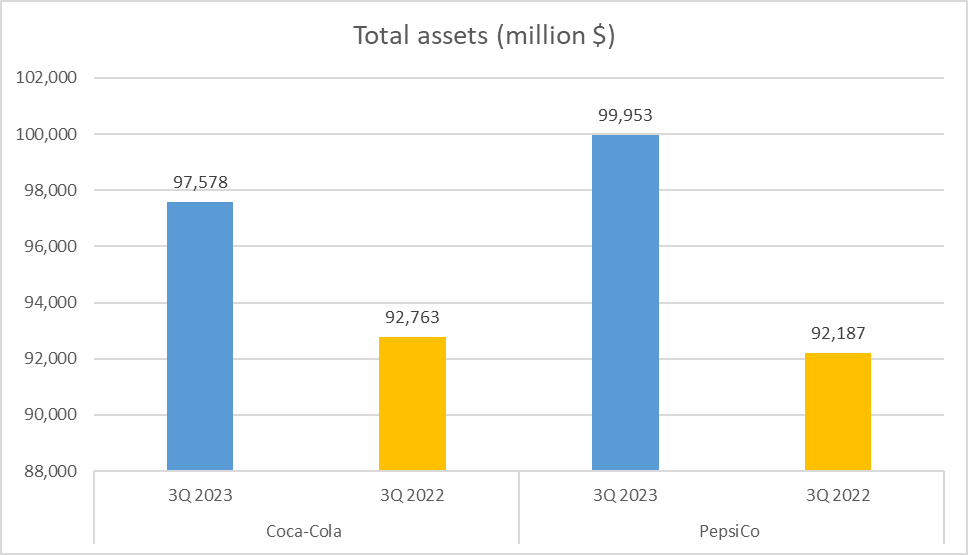
Turning to Total Assets, Coca-Cola holds $98B, while PepsiCo leads slightly with $100B, reflecting their asset strength.
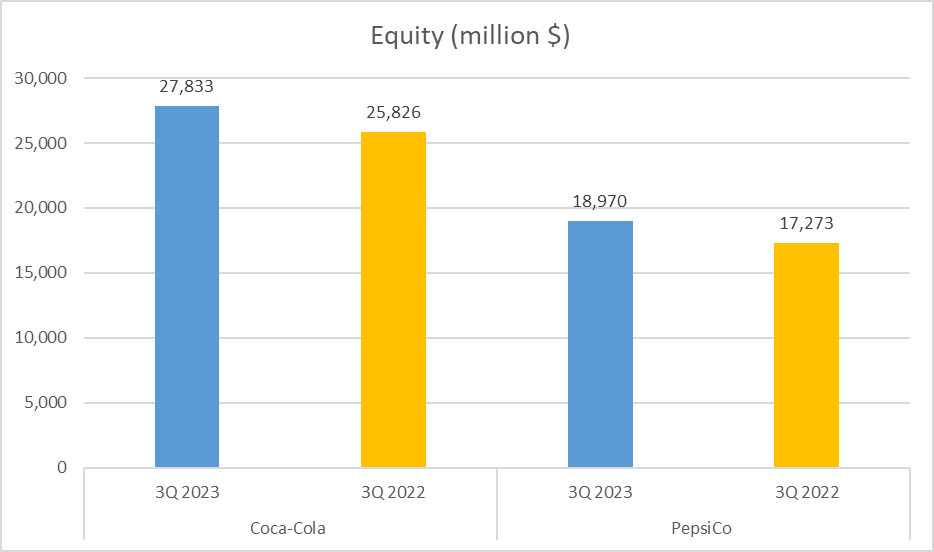
Equity, or Net Assets, reveals Coca-Cola’s dominance with $28B compared to PepsiCo’s $19B, indicating a stronger asset base after debt settlement.
Lastly, the Equity to Total Assets ratio showcases Coca-Cola’s robust position at 29%, signifying stronger equity relative to total assets. PepsiCo trails at 19%.
In summary, while PepsiCo demonstrates efficient equity utilization, Coca-Cola excels in return on assets and maintains a stronger equity to total assets ratio.
Liquidity and Efficiency in Focus: Coca-Cola vs Pepsi Stock Analysis
In the world of business, cash reigns supreme. Let’s examine how these beverage giants handle their cash flows and operational efficiency.
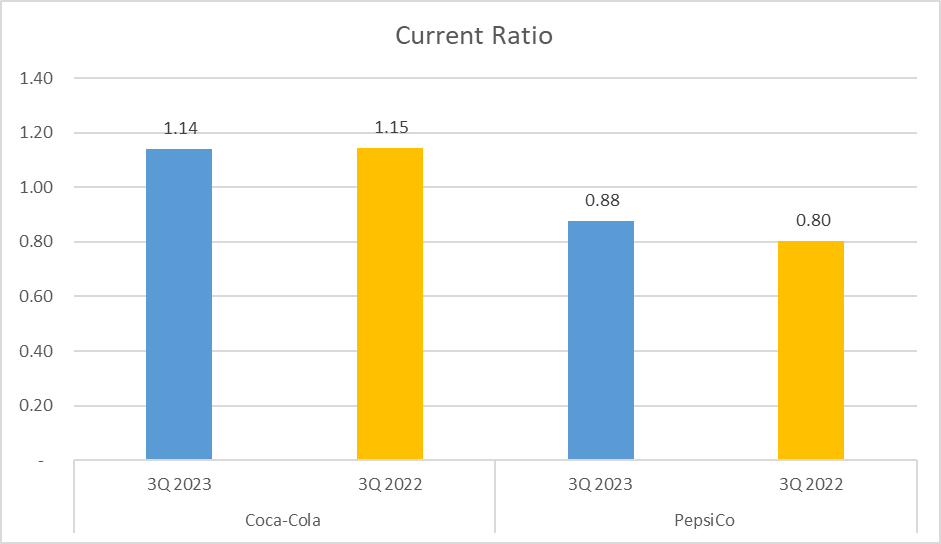
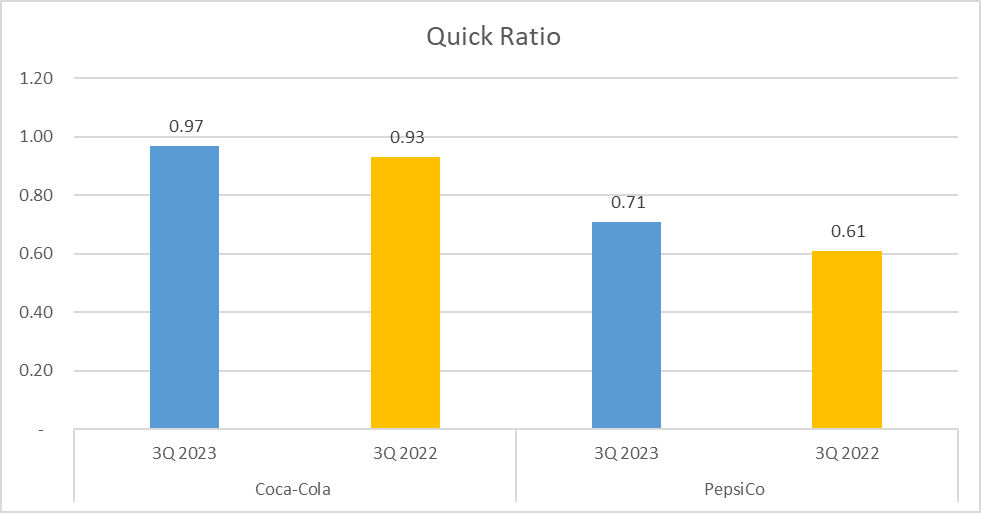
Liquidity, the ability to meet short-term obligations, is crucial in finance. Two key ratios, the Current Ratio and Quick Ratio, gauge this. Coca-Cola boasts a Current Ratio of 1.14, surpassing PepsiCo’s 0.88, indicating better short-term debt coverage.
The Quick Ratio, excluding inventories from assets, further emphasizes Coca-Cola’s superior liquidity at 0.97 compared to PepsiCo’s 0.71.
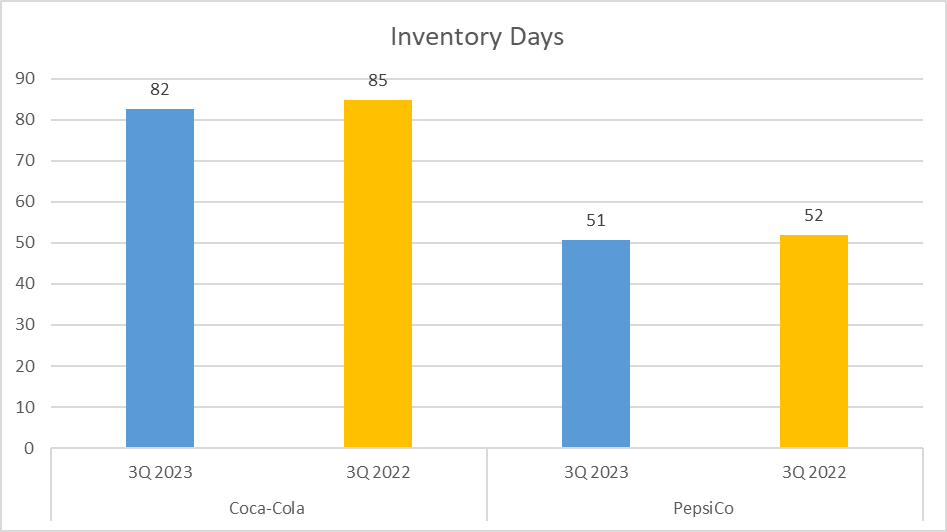
Shifting gears to operational efficiency, we explore Inventory Days and Accounts Receivable Days. PepsiCo excels with Inventory Days at 51, implying efficient inventory management, whereas Coca-Cola lags at 82.
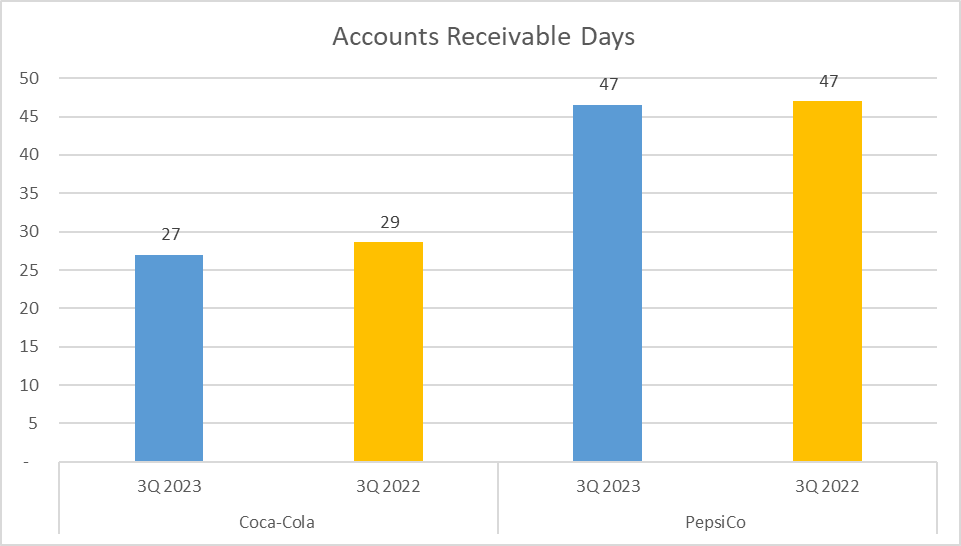
In terms of Accounts Receivable Days, Coca-Cola leads with 27 days versus PepsiCo’s 47, showcasing quicker payment collection.
Total Assets Turnover measures asset utilization for sales generation. PepsiCo outperforms Coca-Cola with a turnover of 0.88 against Coca-Cola’s 0.49.
In summary, PepsiCo demonstrates faster asset turnover and inventory management, while Coca-Cola maintains a stronger liquidity position.
Cash Flows and Dupont Analysis: Coca-Cola vs Pepsi Stock Analysis
Let’s delve into the cash flows and dissect the Return on Equity (ROE) using the Dupont Analysis method to gain deeper insights into Coca-Cola and PepsiCo’s financial standing.
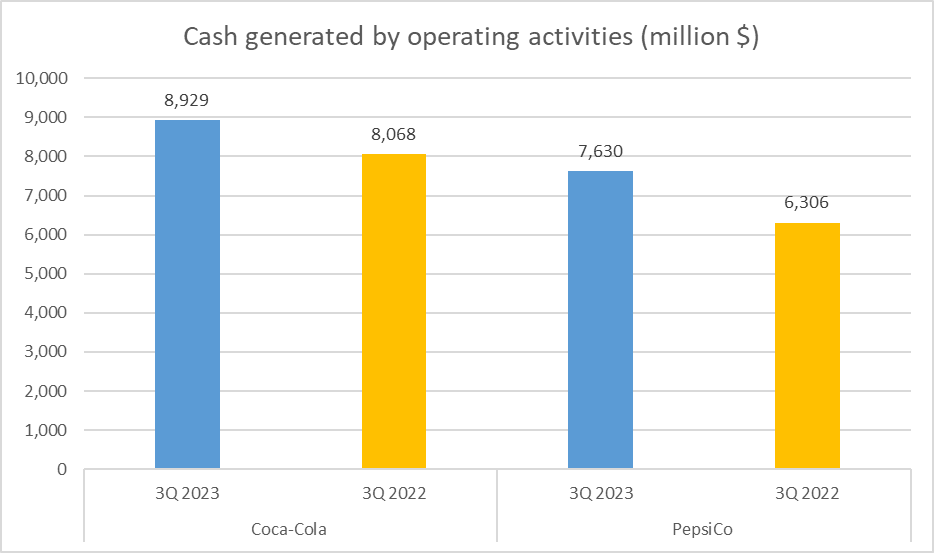
Examining cash generated from operating activities, Coca-Cola leads with $9B, surpassing PepsiCo’s $8B. This metric showcases each company’s ability to generate cash from core business operations.
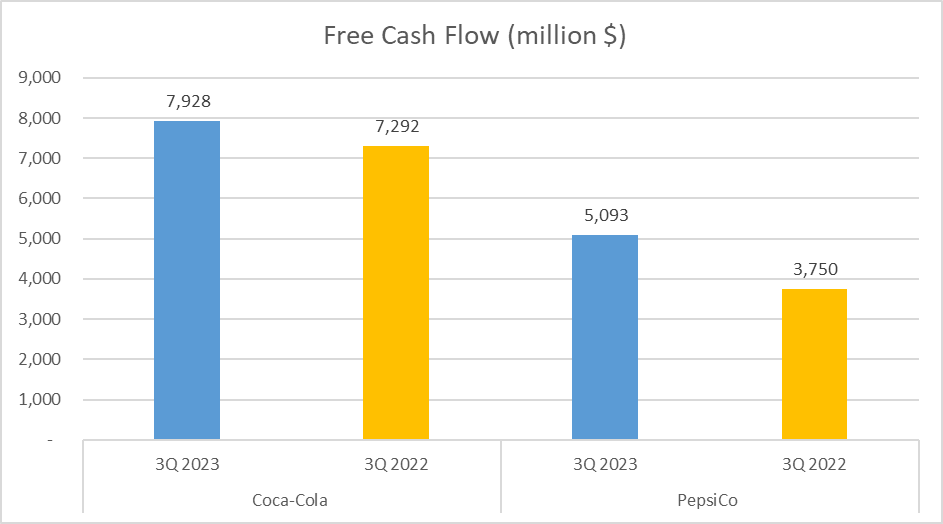
Moving on to Free Cash Flow, Coca-Cola boasts $8B while PepsiCo stands at $5B. This metric reveals the cash available after operational expenses and asset maintenance, illustrating financial strength.
Operating Cash Flow to Net Income ratio remains consistent at 1 for both companies, indicating efficient conversion of profits into cash.
Now, onto the Dupont Analysis, breaking down ROE into Net Profit Margin, Asset Turnover Ratio, and Equity Multiplier.
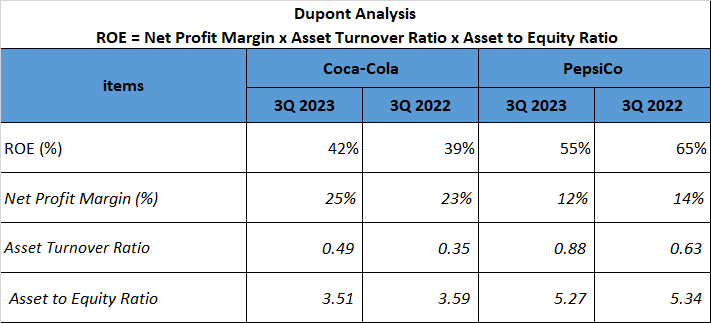
Coca-Cola’s ROE is 42%, driven by a 25% Net Profit Margin, 0.49 Asset Turnover Ratio, and 3.51 Equity Multiplier. In comparison, PepsiCo’s ROE stands higher at 55%, with a Net Profit Margin of 12%, Asset Turnover Ratio of 0.88, and Equity Multiplier of 5.27.
In conclusion, the Dupont Analysis provides insights into how ROE is generated, whether through profit margins, asset efficiency, or leverage. While both companies exhibit strengths and weaknesses, understanding these metrics offers clarity on their financial performance. Remember, these analyses reflect the snapshot of their 2023 performance; it’s crucial to stay updated with their latest financials before making investment decisions.
Watching more on Youtube:
Author: investforcus.com
Follow us on Youtube: The Investors Community
Thank you for being of assistance to me. I really loved this article.
Thank you for writing this article. I appreciate the subject too.
You’ve been great to me. Thank you!
I’m so in love with this. You did a great job!!