Revenue Breakdown – Coinbase Stock Analysis
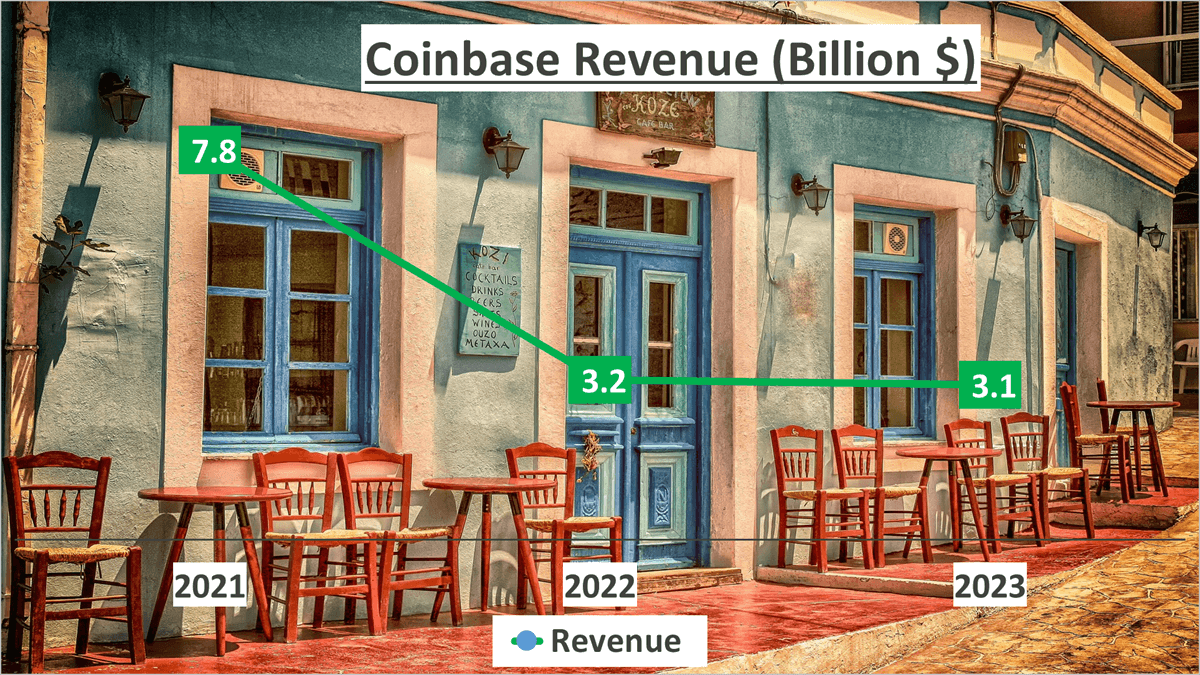
In 2023, Coinbase’s revenue amounted to $3.1 billion, a significant decrease from its 2021 peak of $7.8 billion. This represents a drop of almost 60% in just two years, equivalent to an annual decrease of 37%.
Of particular interest is the restructuring of Coinbase’s revenue sources. In 2023, 48% of the revenue came from transactions, 45% from subscriptions and services, and the remaining 6% from other sources. This is a stark contrast to 2021, when a substantial 87% of revenue was generated from transactions.
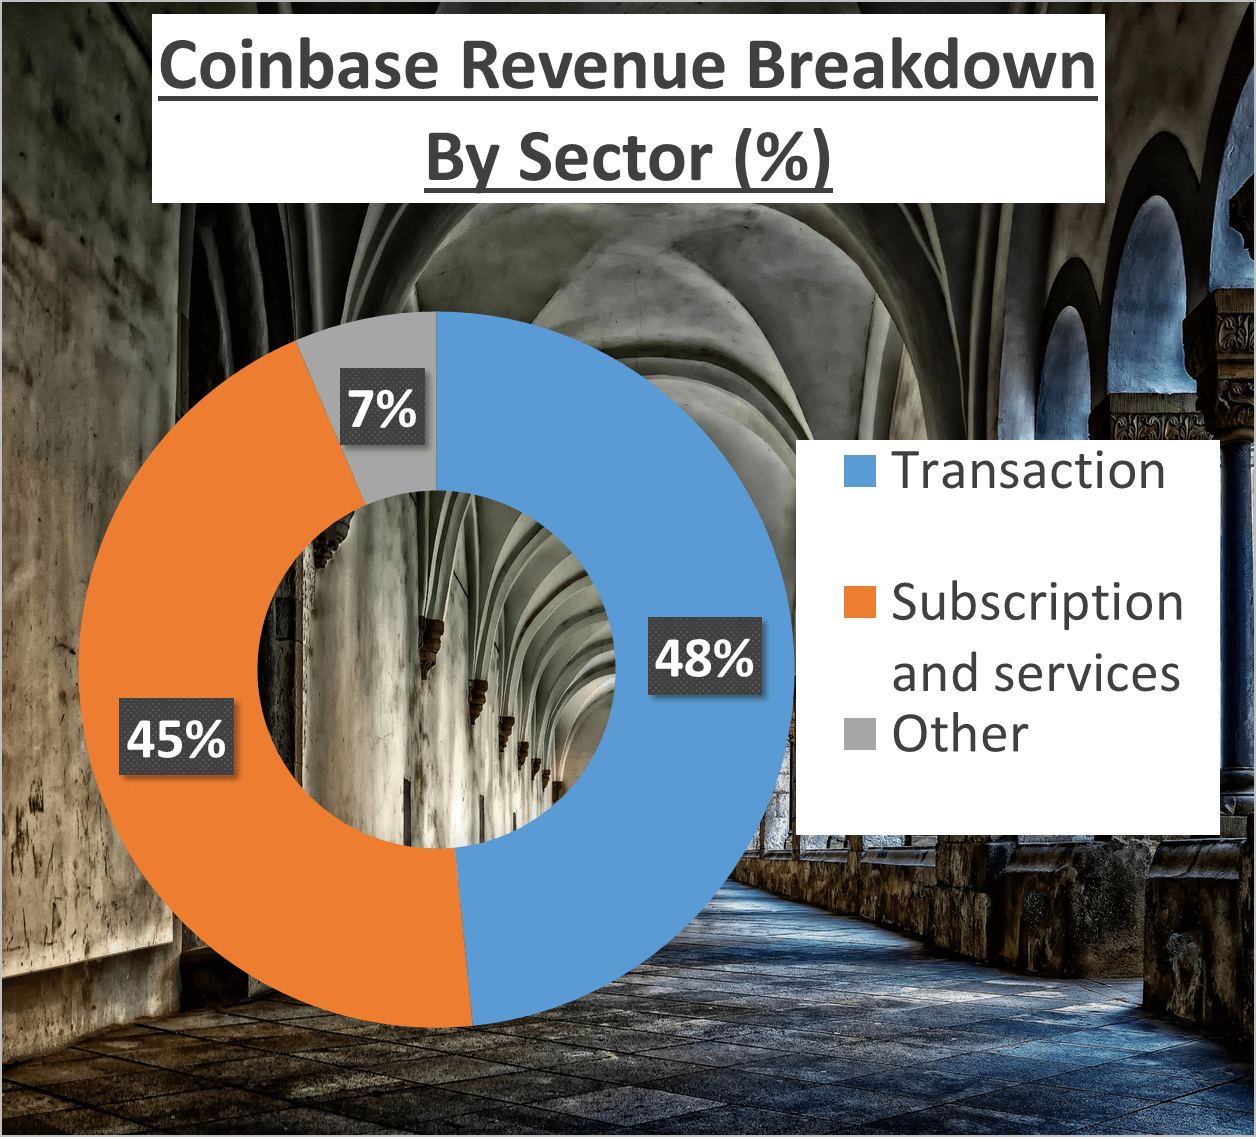
This shift indicates the state of the cryptocurrency market. It suggests that the market experienced a downturn towards the end of 2021, leading to a sharp decline in Coinbase’s transaction revenue. Essentially, the company’s reliance on transaction revenue left it vulnerable to the cryptocurrency market’s volatility.
However, there are positive aspects amid the challenges. The increase in revenue from subscriptions and services is encouraging, showcasing Coinbase’s efforts to diversify its revenue streams and lessen its dependence on transactions. This strategic move could enhance the company’s resilience in future market downturns.
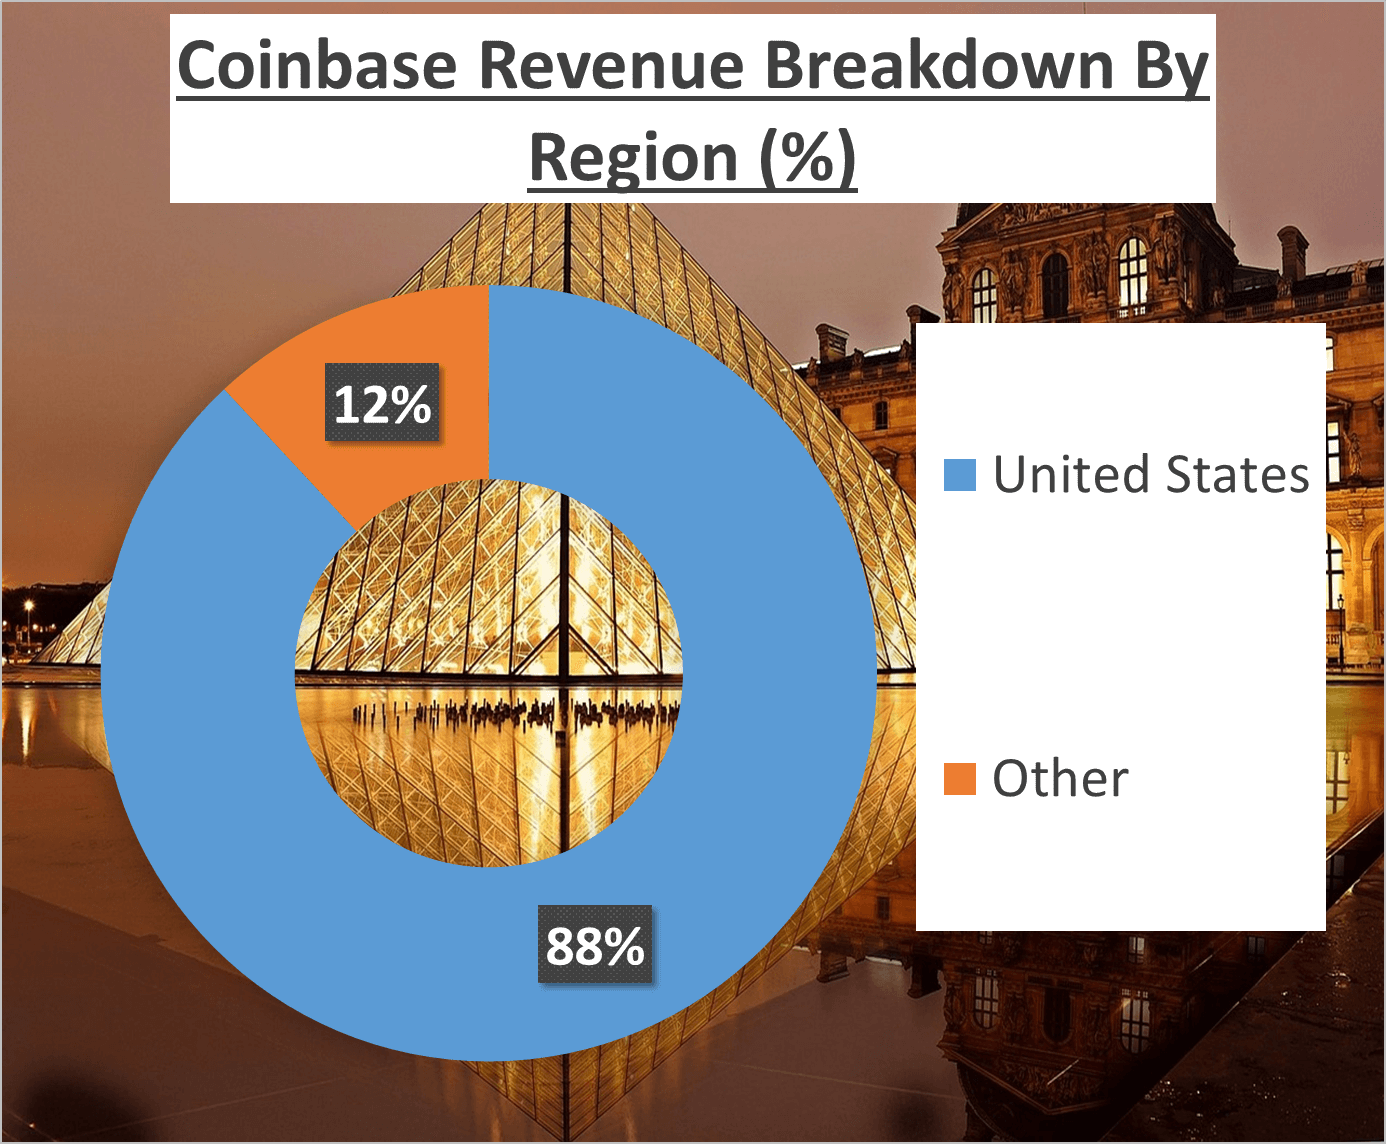
Geographically, 88% of Coinbase’s revenue in 2023 originated from the United States, with the remaining 12% from other regions. This underscores the company’s strong presence in the U.S. market while highlighting opportunities for growth in other regions.
In summary, Coinbase’s revenue story in 2023 reflects change and adaptation. The company has encountered challenges, particularly in its transaction business, yet it has demonstrated its adaptability and diversification capabilities. Although the revenue decline raises concerns, the restructuring of revenue sources signals a potentially more sustainable future for Coinbase.
Coinbase’s revenue composition has undergone a significant shift, indicating the turbulence in the cryptocurrency market.
Profit Margin and Expense Analysis – Coinbase Stock Analysis
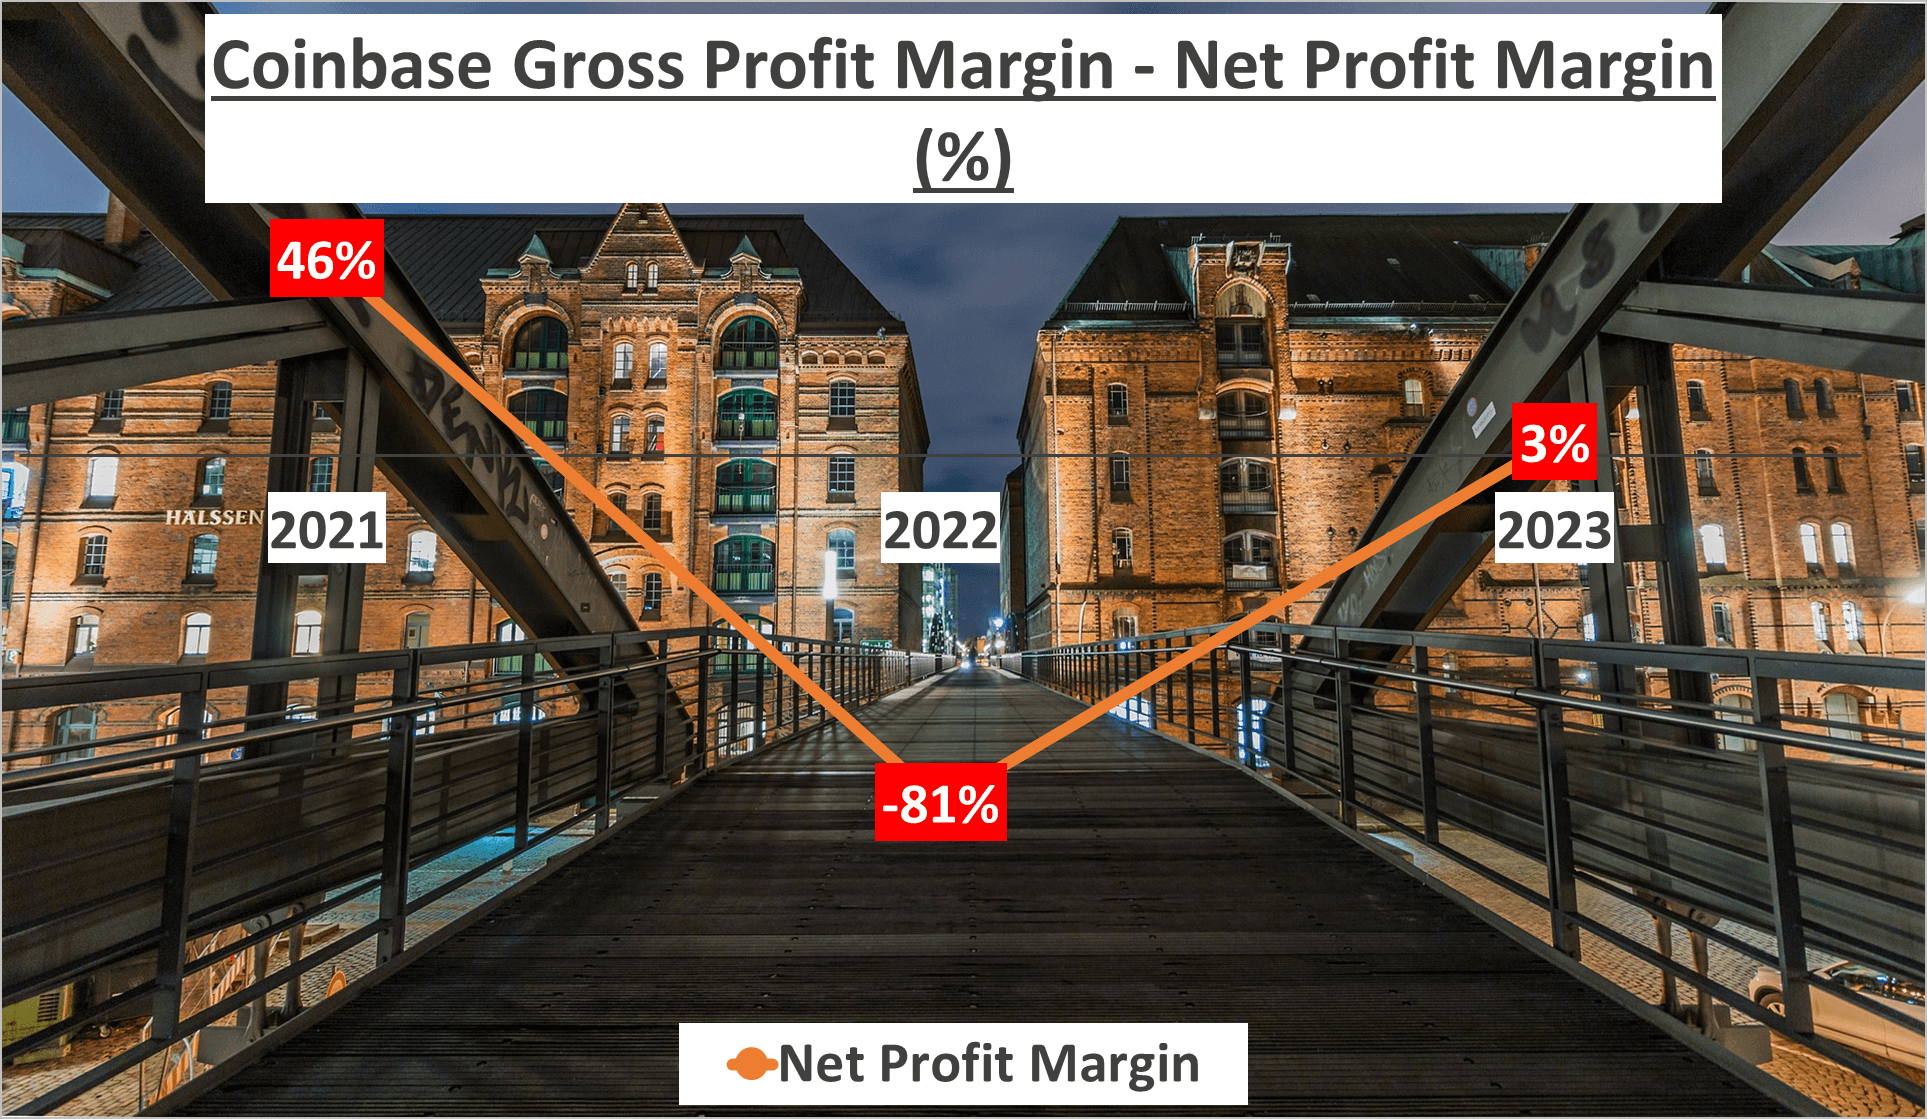
In 2023, Coinbase’s Net Profit Margin surged to 3%, marking a remarkable improvement from the negative 81% in 2022. This significant turnaround is largely attributed to the company’s strategic expense management efforts.
Let’s delve deeper into the numbers. In 2023, Coinbase’s Expense to Revenue ratio was distributed across three main categories: Transaction costs, constituting 13%; Technology and Development costs, comprising 42%; and Selling, General and Administrative (SG&A) expenses, accounting for the remaining 45%.
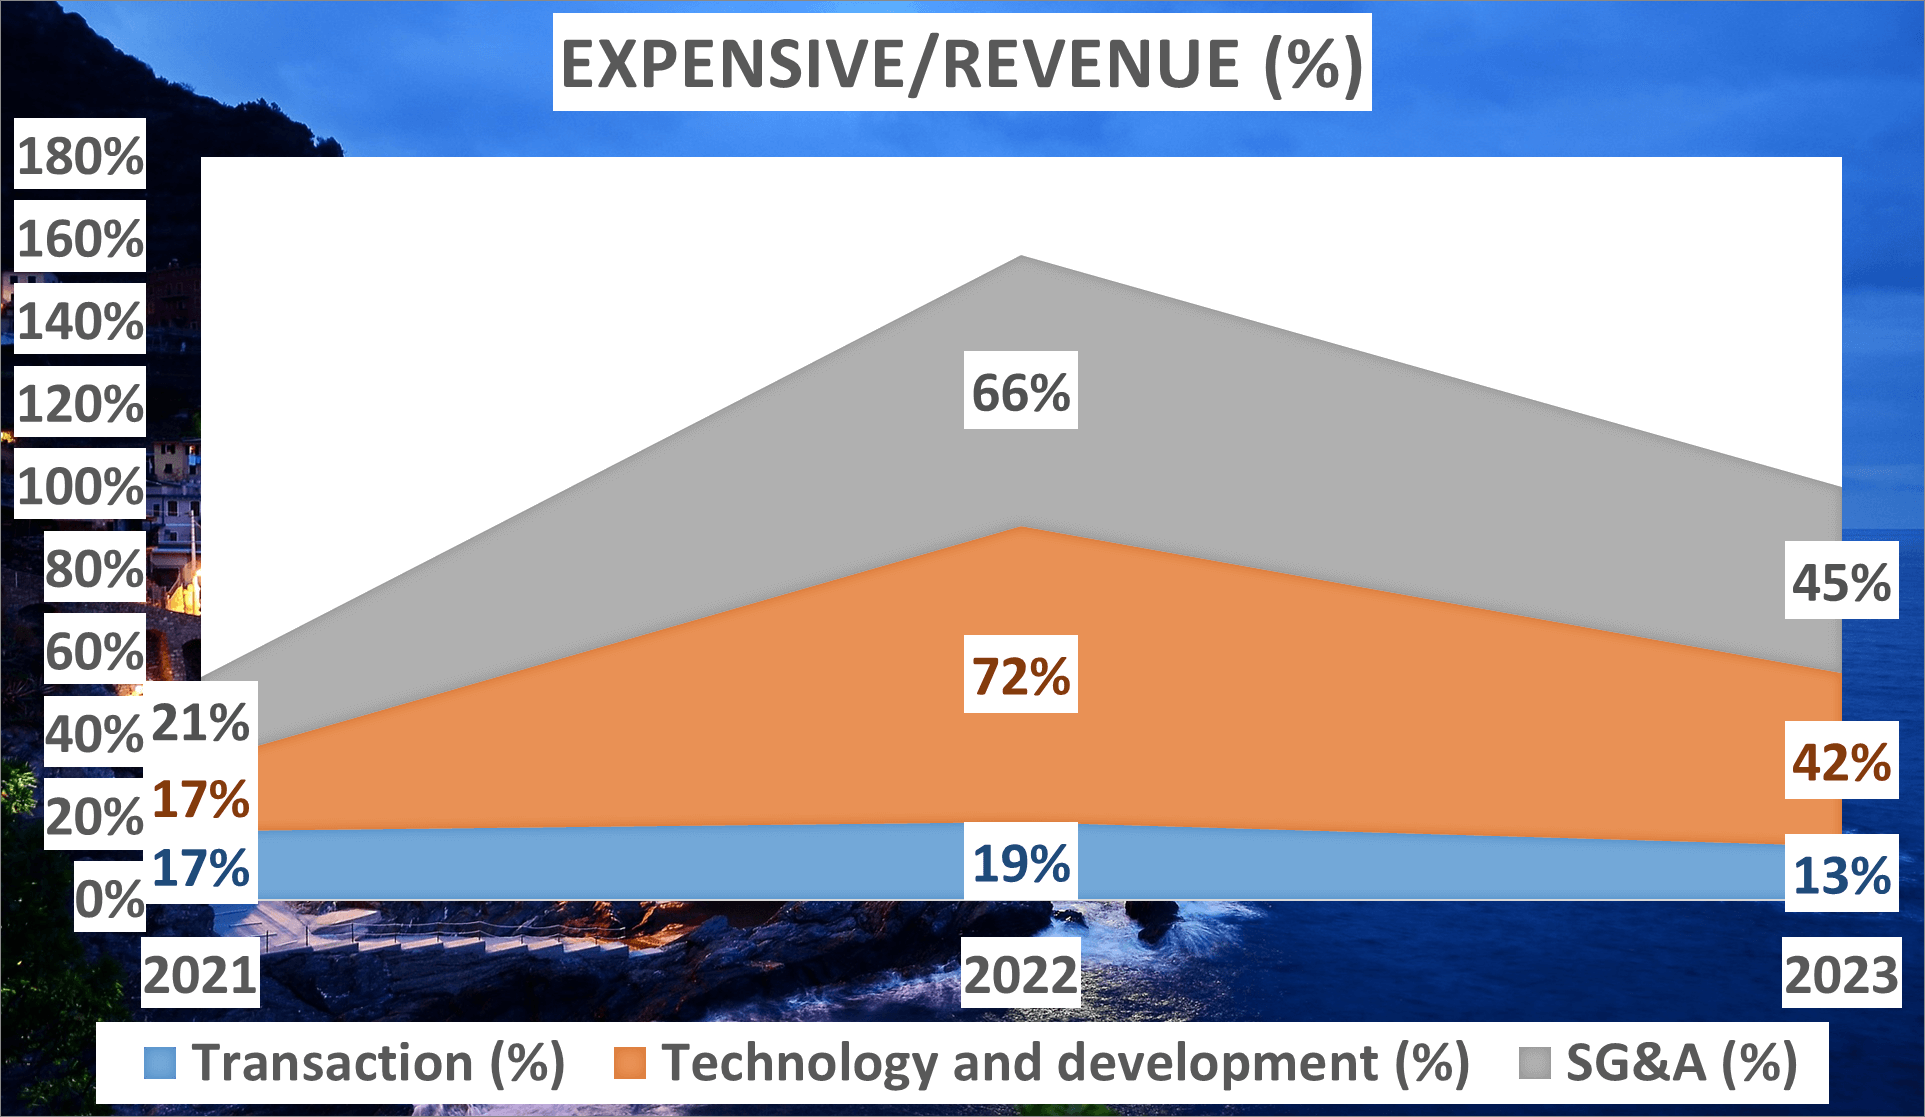
What’s intriguing is that the Expense to Revenue ratio in 2023 decreased compared to 2022. This indicates Coinbase’s effective implementation of cost-cutting measures, a strategy that positively influenced the company’s Net Profit. By maintaining strict control over expenses, Coinbase successfully transitioned from a negative to a positive Net Profit.
In terms of figures, the Net Profit for 2023 reached $100 million, a significant leap from the negative $2.6 billion in 2022. However, it’s worth noting that this figure still falls short of the impressive $3.6 billion recorded in 2021.

This improvement in Net Profit Margin underscores Coinbase’s adaptability and resilience in a volatile market. Through a focus on enhancing expense management practices, Coinbase has demonstrated strategic acumen and resilience. The company’s ability to reverse a negative Net Profit Margin to a positive one within a year is a notable achievement.
In conclusion, the positive Net Profit in 2023 reflects Coinbase’s effective cost-cutting measures and underscores its resilience and adaptability. However, it’s essential to bear in mind that past performance does not guarantee future outcomes. Monitoring market trends and the company’s strategic decisions remains crucial moving forward.
Asset Analysis – Coinbase Stock Analysis
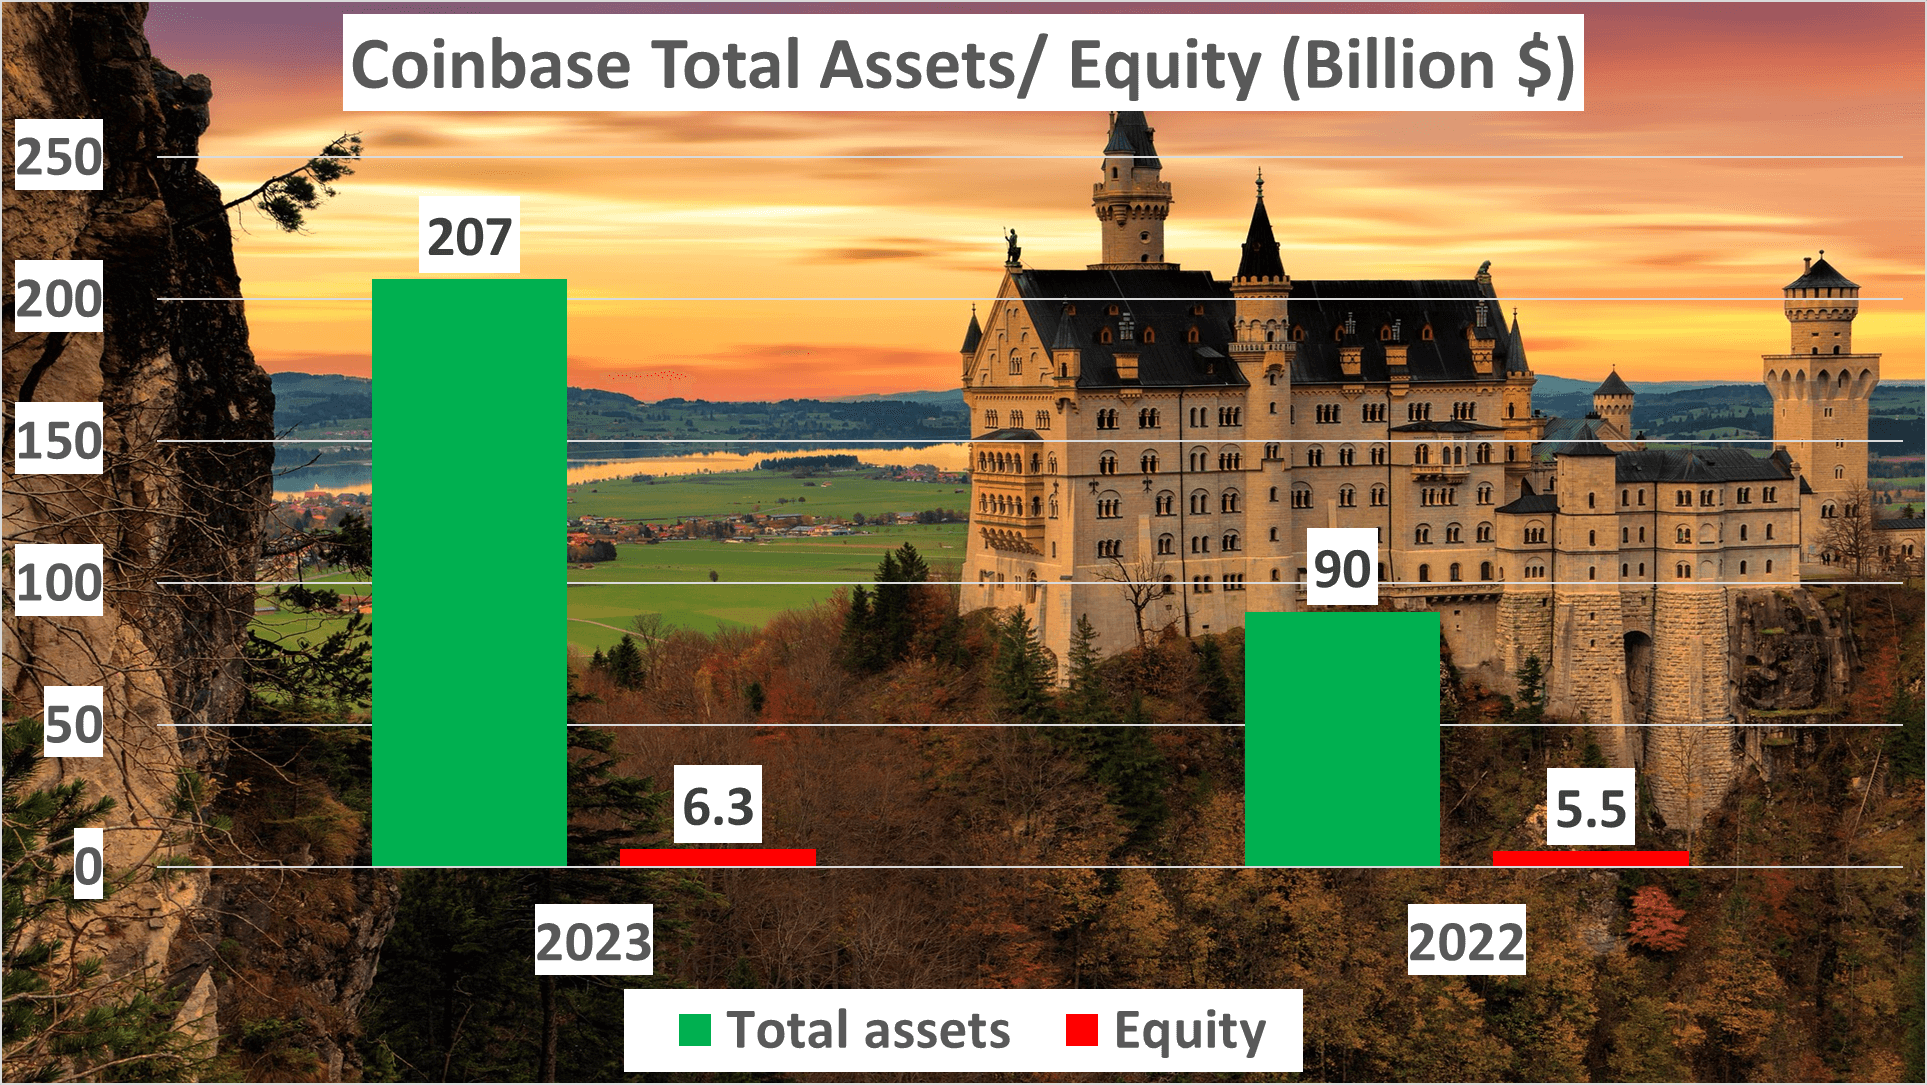
In 2023, Coinbase’s total assets skyrocketed to $207 billion, more than doubling its 2022 figure of $90 billion.
This remarkable increase in total assets is primarily attributed to a surge in a specific category of assets: safeguarding customer crypto assets. Safeguarding customer crypto assets refers to the cryptocurrency that Coinbase holds on behalf of its users. This category of assets surged from $75 billion in 2022 to an astounding $193 billion in 2023, representing a growth of over 150% in just one year.
But why is this significant? The answer is straightforward. The more assets Coinbase safeguards for its customers, the more transactions it can potentially facilitate. Each transaction generates fees, contributing to Coinbase’s revenue. Therefore, an increase in safeguarded assets implies the potential for more transactions and, consequently, higher revenues.
Moreover, the growth in safeguarded assets signifies growing trust in Coinbase. It indicates that an increasing number of customers are entrusting Coinbase with their cryptocurrency. This expanding customer base is crucial for Coinbase’s future profitability.
However, it’s essential to acknowledge the risks associated with safeguarding customer crypto assets. Cryptocurrencies are known for their volatility, and a sudden drop in cryptocurrency prices could lead to a significant decrease in the value of these assets. Yet, Coinbase’s ability to navigate these risks, evident from the growth in safeguarded assets, demonstrates its robust risk management strategies.
In summary, the surge in Coinbase’s total assets, driven by the growth in safeguarded customer crypto assets, is a positive development for the company. It not only suggests potential revenue growth but also reflects the increasing trust of customers in Coinbase’s services. The growth in safeguarding customer crypto assets bodes well for Coinbase’s potential profit growth.
Cash Flow and Dupont Analysis – Coinbase Stock Analysis
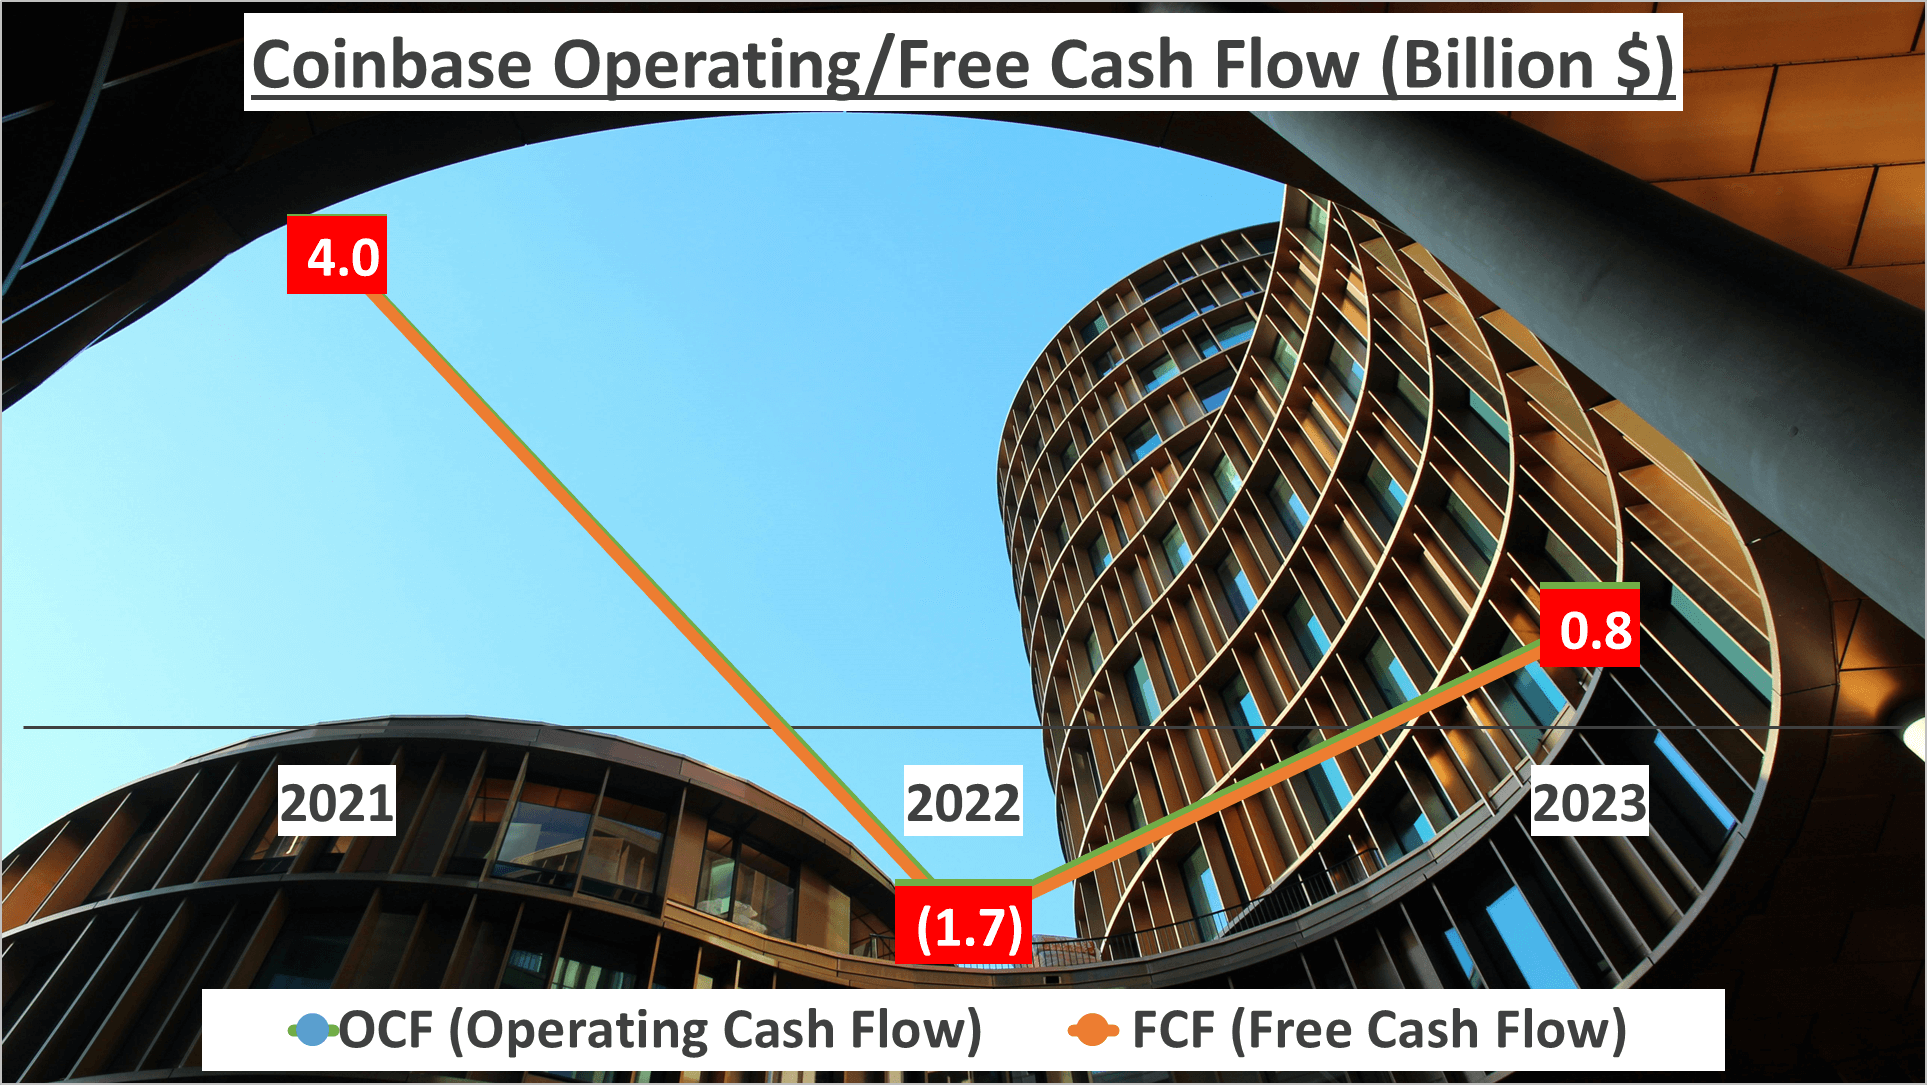
In 2023, Coinbase’s Operating Cash Flow (OCF) and Free Cash Flow (FCF) both turned positive, marking a significant turnaround from 2022. This bullish signal indicates that the company’s core operations are once again generating cash.
Now, let’s dive into our Dupont analysis for Coinbase in 2023 and compare it to 2022. The Dupont analysis breaks down Return on Equity (ROE) into three components: Net Profit Margin, Asset Turnover, and Equity Multiplier. It’s a powerful tool that offers a nuanced view of a company’s financial health.
In 2023, Coinbase’s ROE stood at 2%. This marked a vast improvement over the -47% from 2022. The primary driver behind this improvement was the significant enhancement in Coinbase’s Net Profit Margin, which rebounded to 3% in 2023 from a low of -81% the previous year.
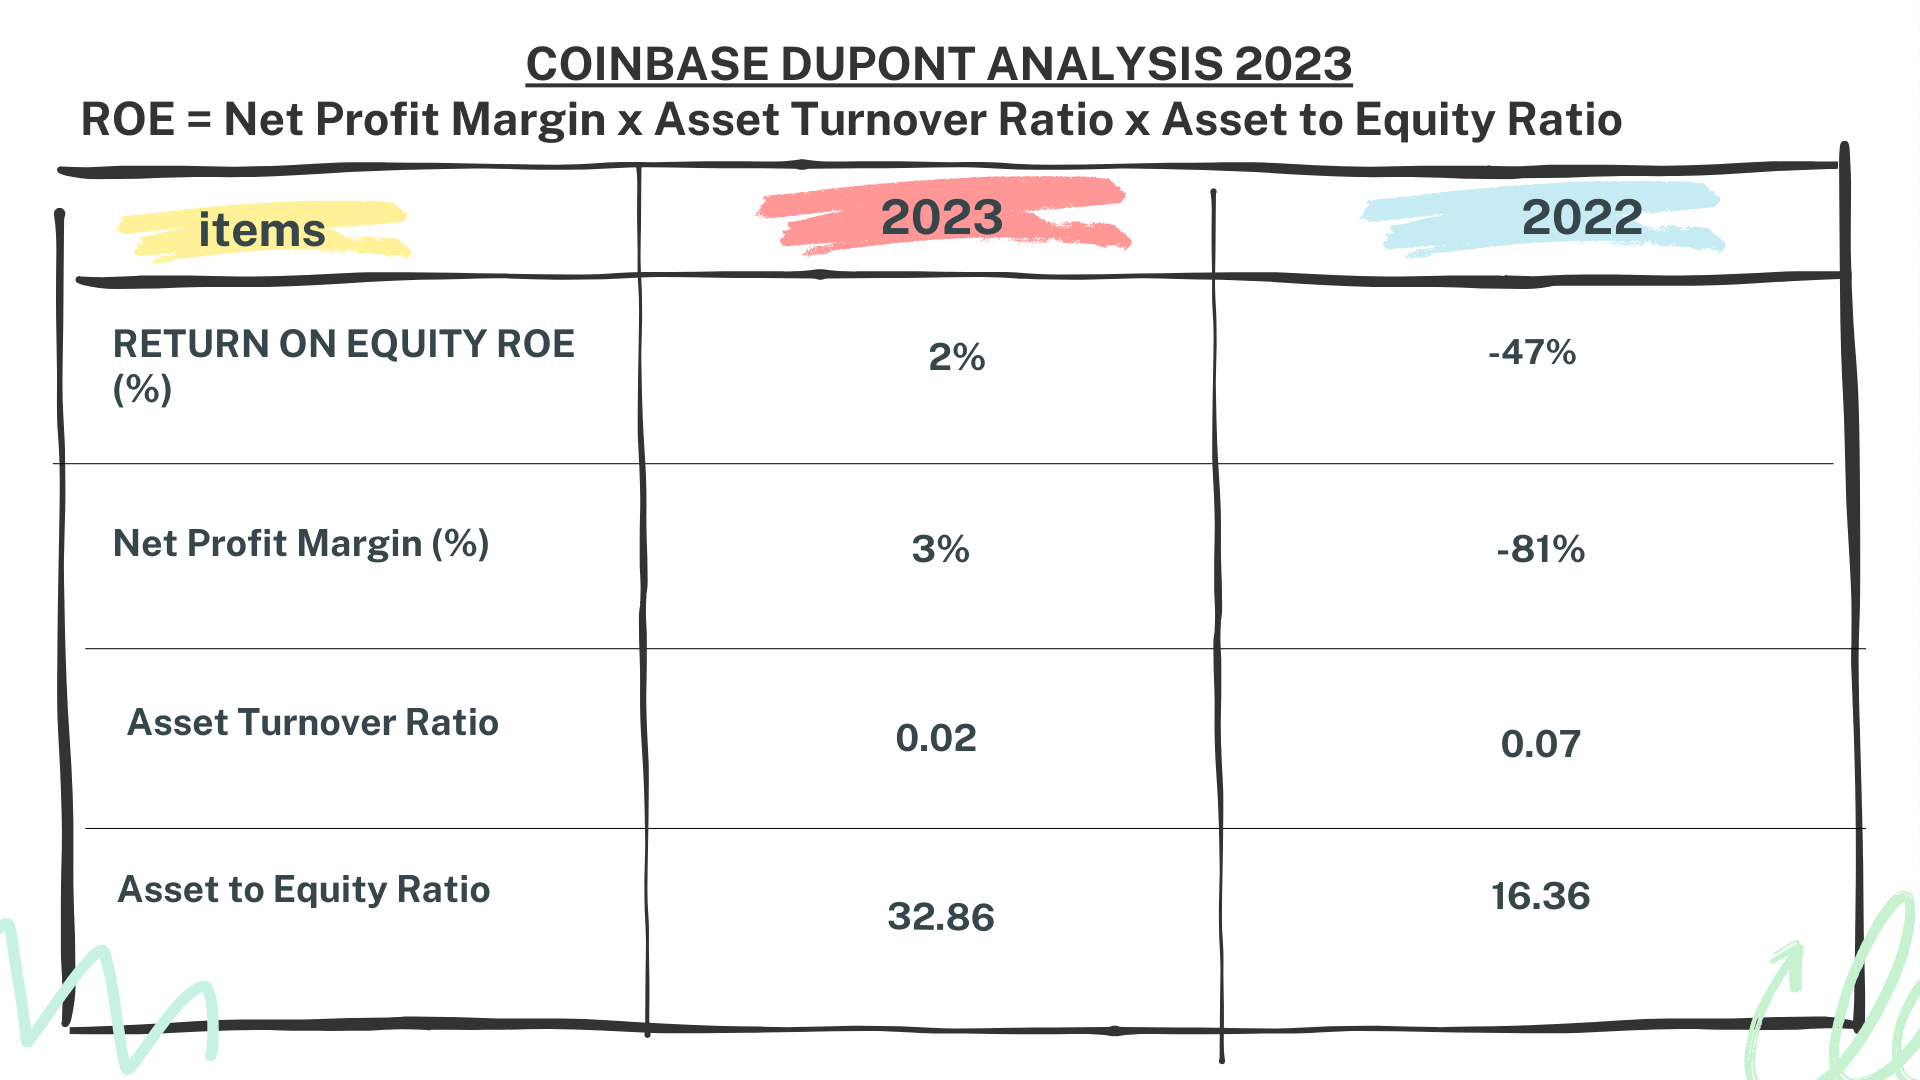
Let’s discuss Asset Turnover next, which measures how efficiently a company utilizes its assets to generate revenue. Coinbase’s Asset Turnover in 2023 was 0.02, a decrease from 0.07 in 2022. This decline suggests that Coinbase was less efficient in utilizing its assets to generate revenue in 2023.
The final component of our Dupont analysis is the Equity Multiplier, which reflects a company’s financial leverage. In 2023, Coinbase’s Equity Multiplier surged to 32.86, a significant increase from 16.36 in 2022. This indicates that Coinbase relied more heavily on debt to finance its assets in 2023.
In conclusion, while Coinbase demonstrated substantial improvements in its Net Profit Margin and returned to profitability in 2023, it exhibited less efficiency in utilizing its assets to generate revenue and relied heavily on debt. These are crucial factors for potential investors to consider.
Author: investforcus.com
Follow us on Youtube: The Investors Community


