Dell Stock Analysis – Have you ever pondered the fate of your investment had you put your money into Dell back in 2018? Let’s rewind the clock and explore this hypothetical scenario. If you had invested $1000 in Dell’s stock in 2018, you’d now be looking at a substantial return. Fast forward to March 2024, that initial investment would have ballooned to an impressive $4693.
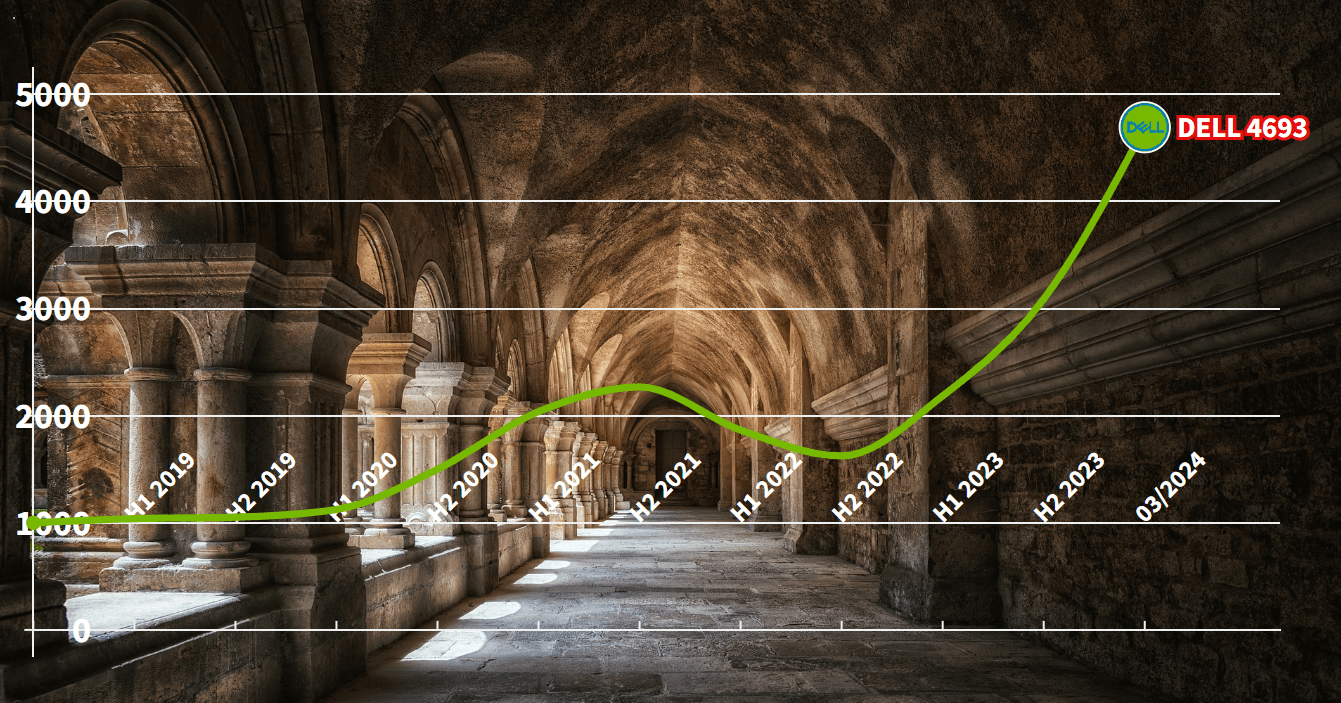
That’s an astounding 369% increase from your original investment.
Now, let’s paint a picture. Envision a seed planted in fertile soil. With the right balance of sunlight, water, and care, that seedling sprouts and flourishes into a towering tree. Your investment in Dell mirrors a similar trajectory, growing exponentially over the years.
However, this growth hasn’t been without its fluctuations. Like any stock, Dell has experienced its share of ups and downs, its seasons of drought and abundance. Yet, the overarching trend has been undeniably upward.
This isn’t merely a case of a rising tide lifting all boats. Dell’s performance has eclipsed that of the broader market. The company’s relentless dedication to innovation, strategic acquisitions, and adept pivot towards more lucrative sectors within the tech industry have all contributed to its stellar performance.
In the bigger picture, your $1000 investment in Dell would have grown at an average annual rate of 36%. That’s a return rate that would catch the eye of even the most seasoned Wall Street investor.
But the burning question remains, what fueled this remarkable growth? What were the driving forces behind Dell’s ascent to such dizzying heights?
Well, the answer lies in unraveling the intricacies of Dell’s financial performance, its revenue breakdown, financial health, cash flow, and other pivotal indicators.
Join us as we peel back the layers and delve into the financial narrative behind Dell’s impressive stock performance.
Dell’s Financial Performance – DELL Stock Analysis
Let’s dissect Dell’s financial performance to unravel the factors driving its stock growth.
Revenue Analysis:
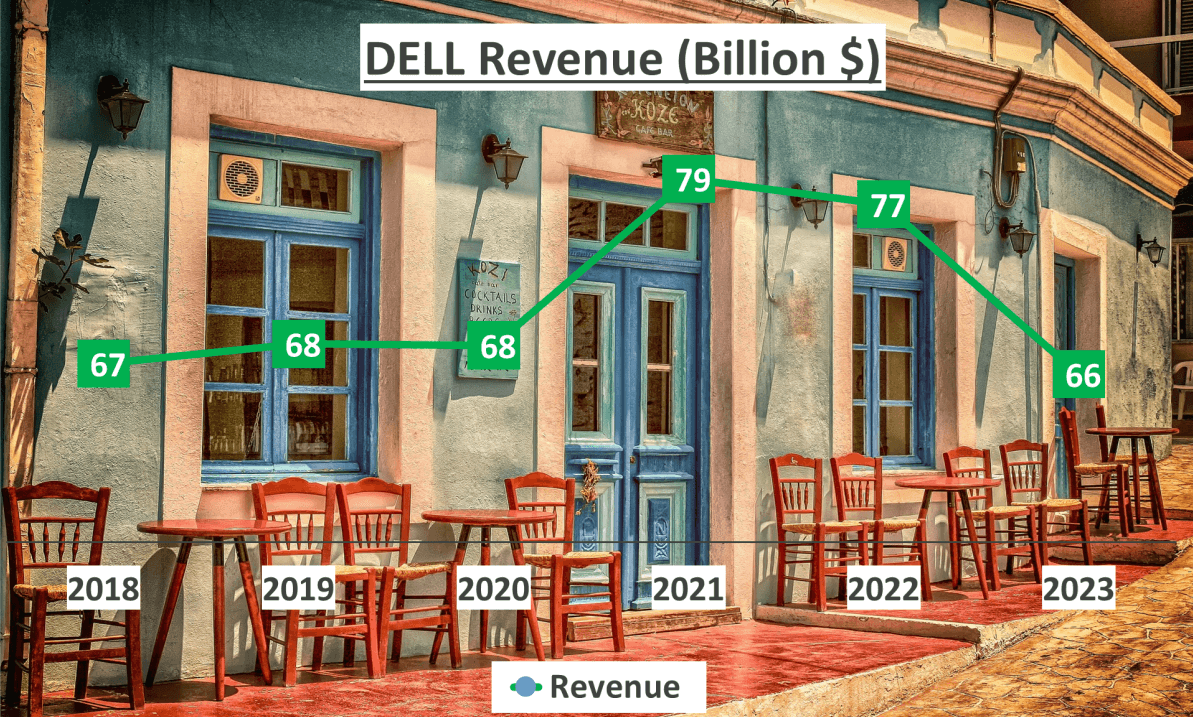

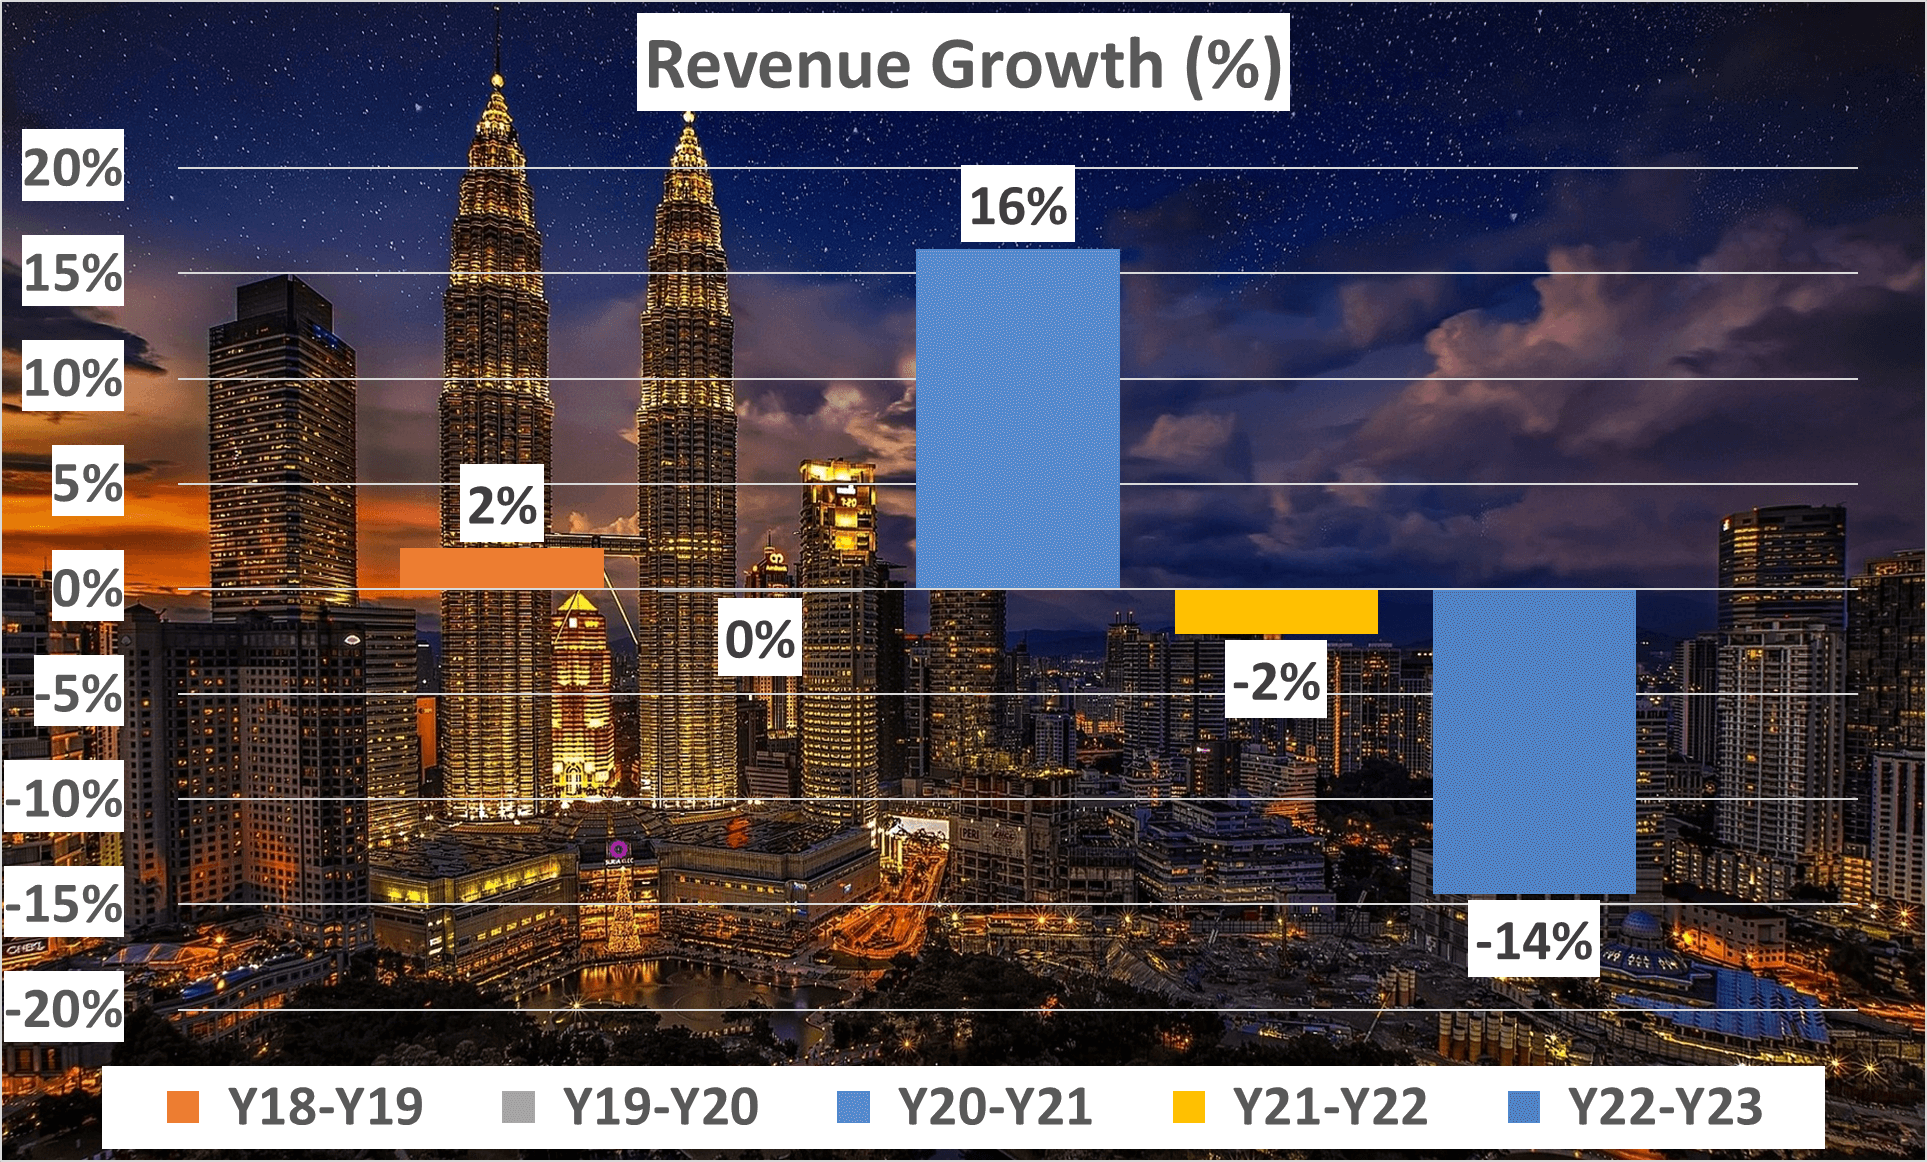
From 2018 to 2023, Dell experienced a mixed bag in revenue. The peak was in 2021, witnessing a substantial 16% growth from the previous year. However, subsequent years witnessed a downward trend, with a 2% decrease in 2022 and a significant 14% decrease in 2023, marking it as the lowest revenue year in the last six.

In 2023, Dell’s gross profit margin stood at 23%, a decrease from its five-year average of 27%. Notably, research and development consumed 3% of revenue, while selling, general, and administrative expenses took up 15%.
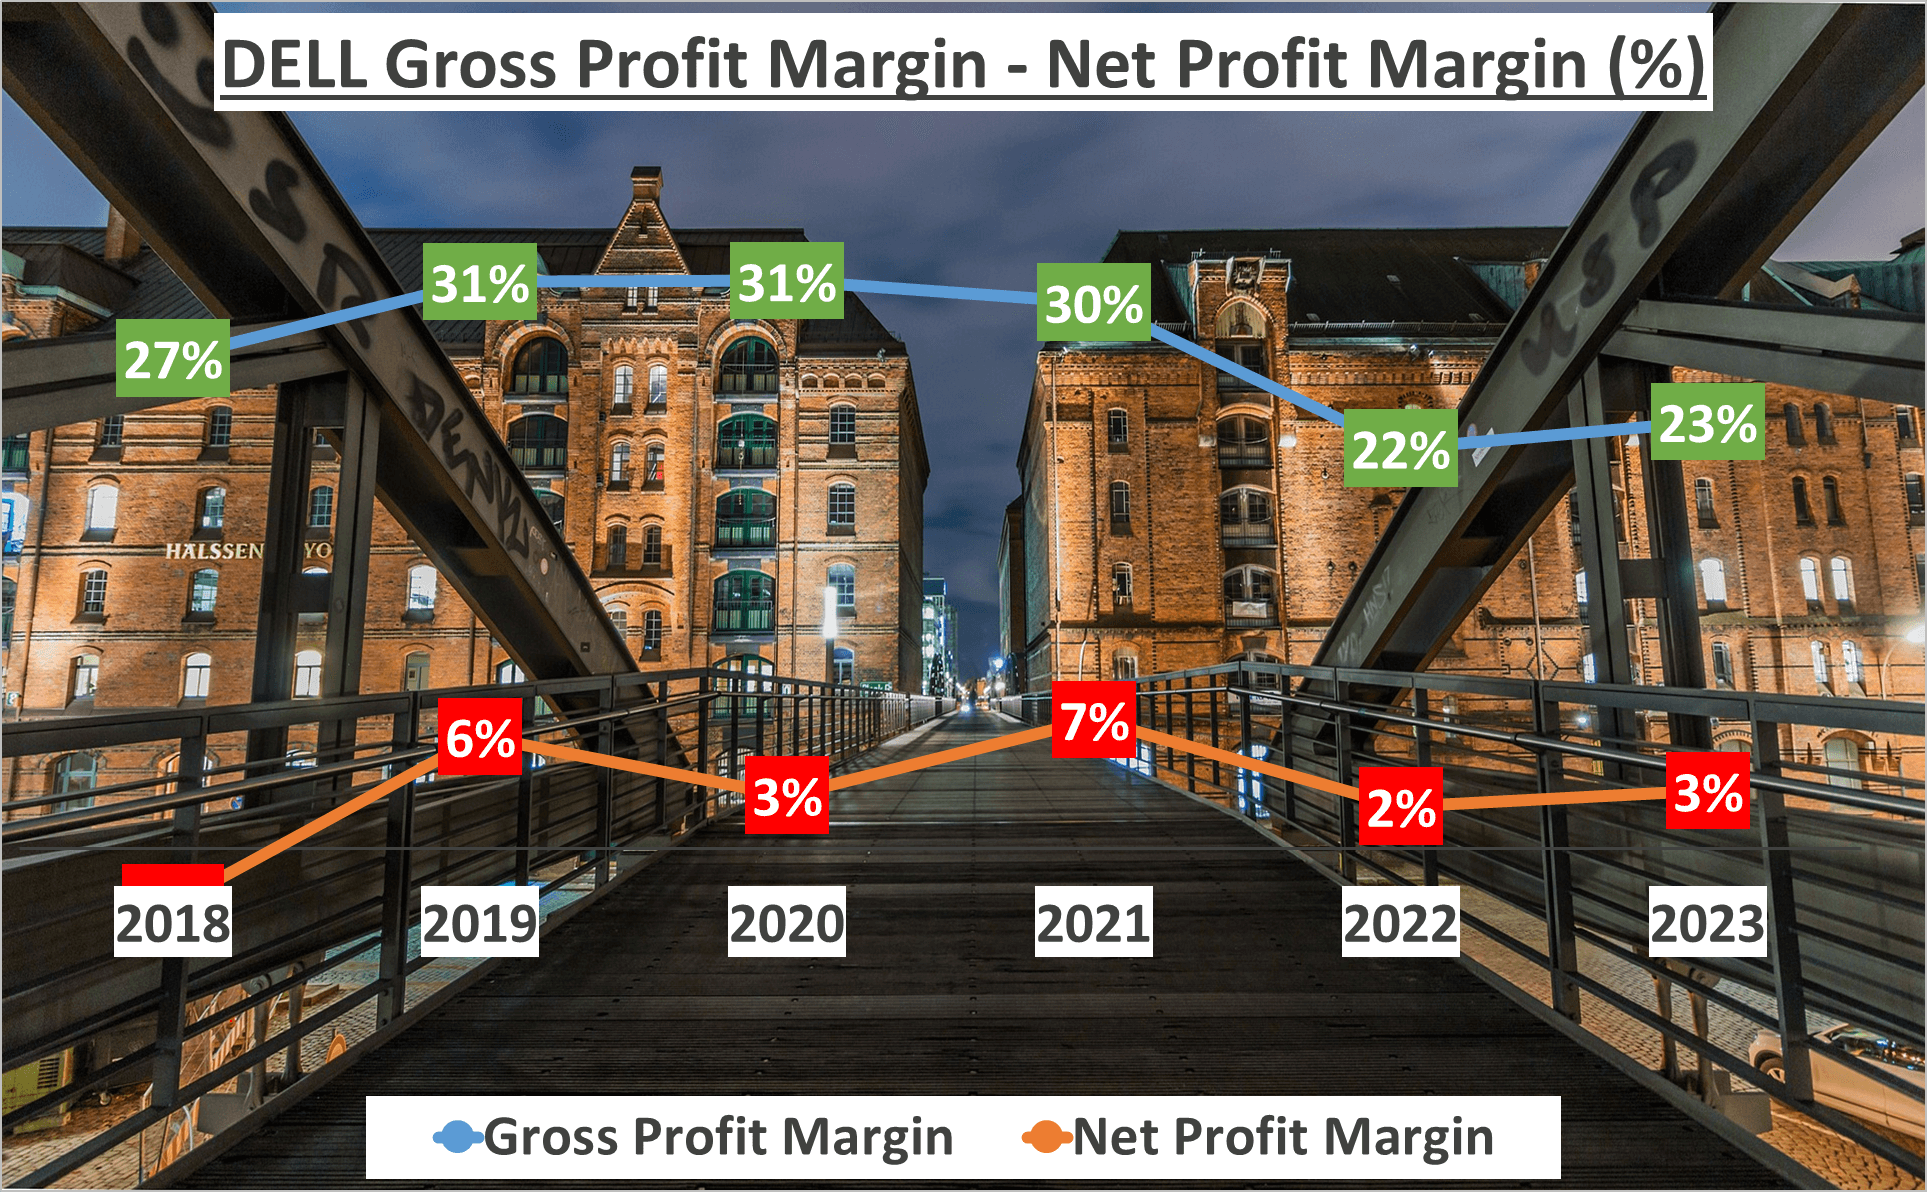

Despite revenue and profit margin downturns, Dell’s net profit margin maintained a steady 3%, aligning with the five-year average. Delving deeper, there was a year-over-year increase of $200 million from 2022 to 2023. However, this fell short of the $5.6 billion net profit recorded in 2021. Nonetheless, Dell’s net profit has been on an overall upward trend since 2018.


While Dell’s revenue witnessed fluctuations, its net profit exhibits an upward trend. This signifies Dell’s focus on bolstering its bottom line and enhancing profitability, a promising sign for investors. With a consistent net profit margin and an upward trend in net profit, Dell’s financial performance portrays a company adept at navigating challenges and maintaining profitability.
Dell’s Revenue Breakdown – DELL Stock Analysis
Now, where exactly does Dell’s revenue originate from? This question frequently crosses the minds of investors.
Dell’s revenue stream is far from one-dimensional. The company adeptly generates income from a wide array of sources, ensuring a diverse and stable financial structure.
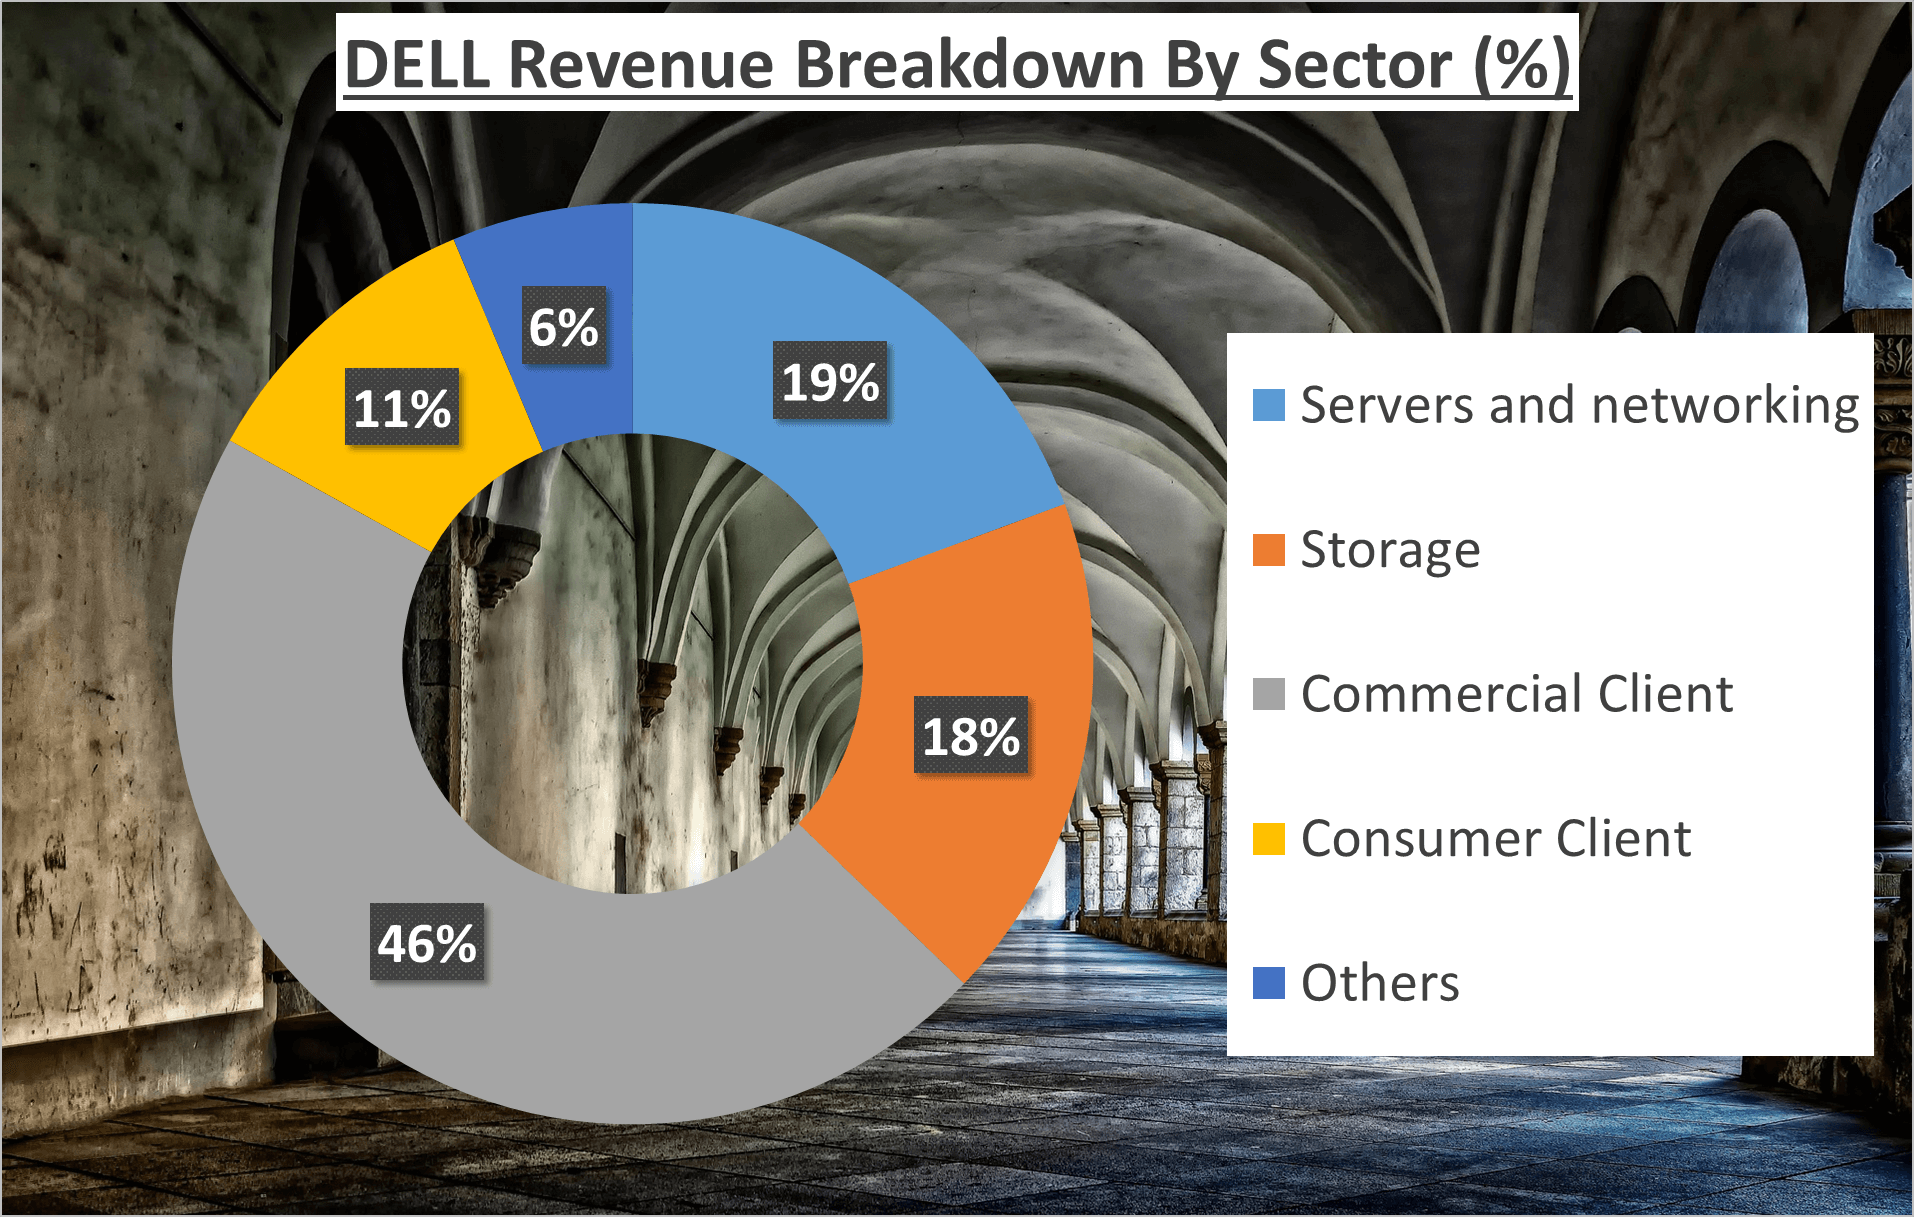

Servers and Networking: Contributing approximately 19% to Dell’s total revenue, this segment offers a broad spectrum of server and networking products tailored to various businesses, from startups to corporations.
Storage: Accounting for around 18% of Dell’s revenue, this sector provides diverse storage solutions, including data protection, backup services, and software-defined storage, catering to diverse customer needs.
Commercial Client Segment: The lion’s share of Dell’s revenue, a hefty 46%, stems from this segment, encompassing sales of notebooks, desktops, and workstations to corporate entities. This underscores Dell’s robust presence and credibility in the corporate realm.
Consumer Client Segment: Contributing about 11% to Dell’s revenue, this segment comprises sales of notebooks, desktops, and other products to individual consumers, showcasing Dell’s ability to cater to both corporate and individual clienteles.
Others Category: Constituting approximately 6% of Dell’s total revenue, this category includes various services such as cloud solutions, software, and peripherals. Despite its smaller size, this segment adds to the diversity of Dell’s revenue sources.
In summary, Dell’s revenue stems from a diverse range of sources, with the Commercial Client segment emerging as the largest contributor. This diversified revenue structure not only mitigates the company’s reliance on a single segment but also presents multiple avenues for growth and expansion, rendering Dell a potentially enticing option for investors.
Dell’s Financial Health – DELL Stock Analysis
How robust is Dell’s financial situation? This query leads us directly to the core issue – the company’s overall financial well-being.
Total Assets Analysis:
A closer examination of Dell’s total assets reveals a slight decline from $90 billion in 2022 to $83 billion in 2023. Conversely, net assets exhibited a marginal improvement, shifting from -$3 billion in 2022 to -$2.6 billion in 2023. While this signifies progress, it’s crucial to note that negative net assets may signal that a company’s outstanding liabilities exceed its total assets, indicating financial distress.
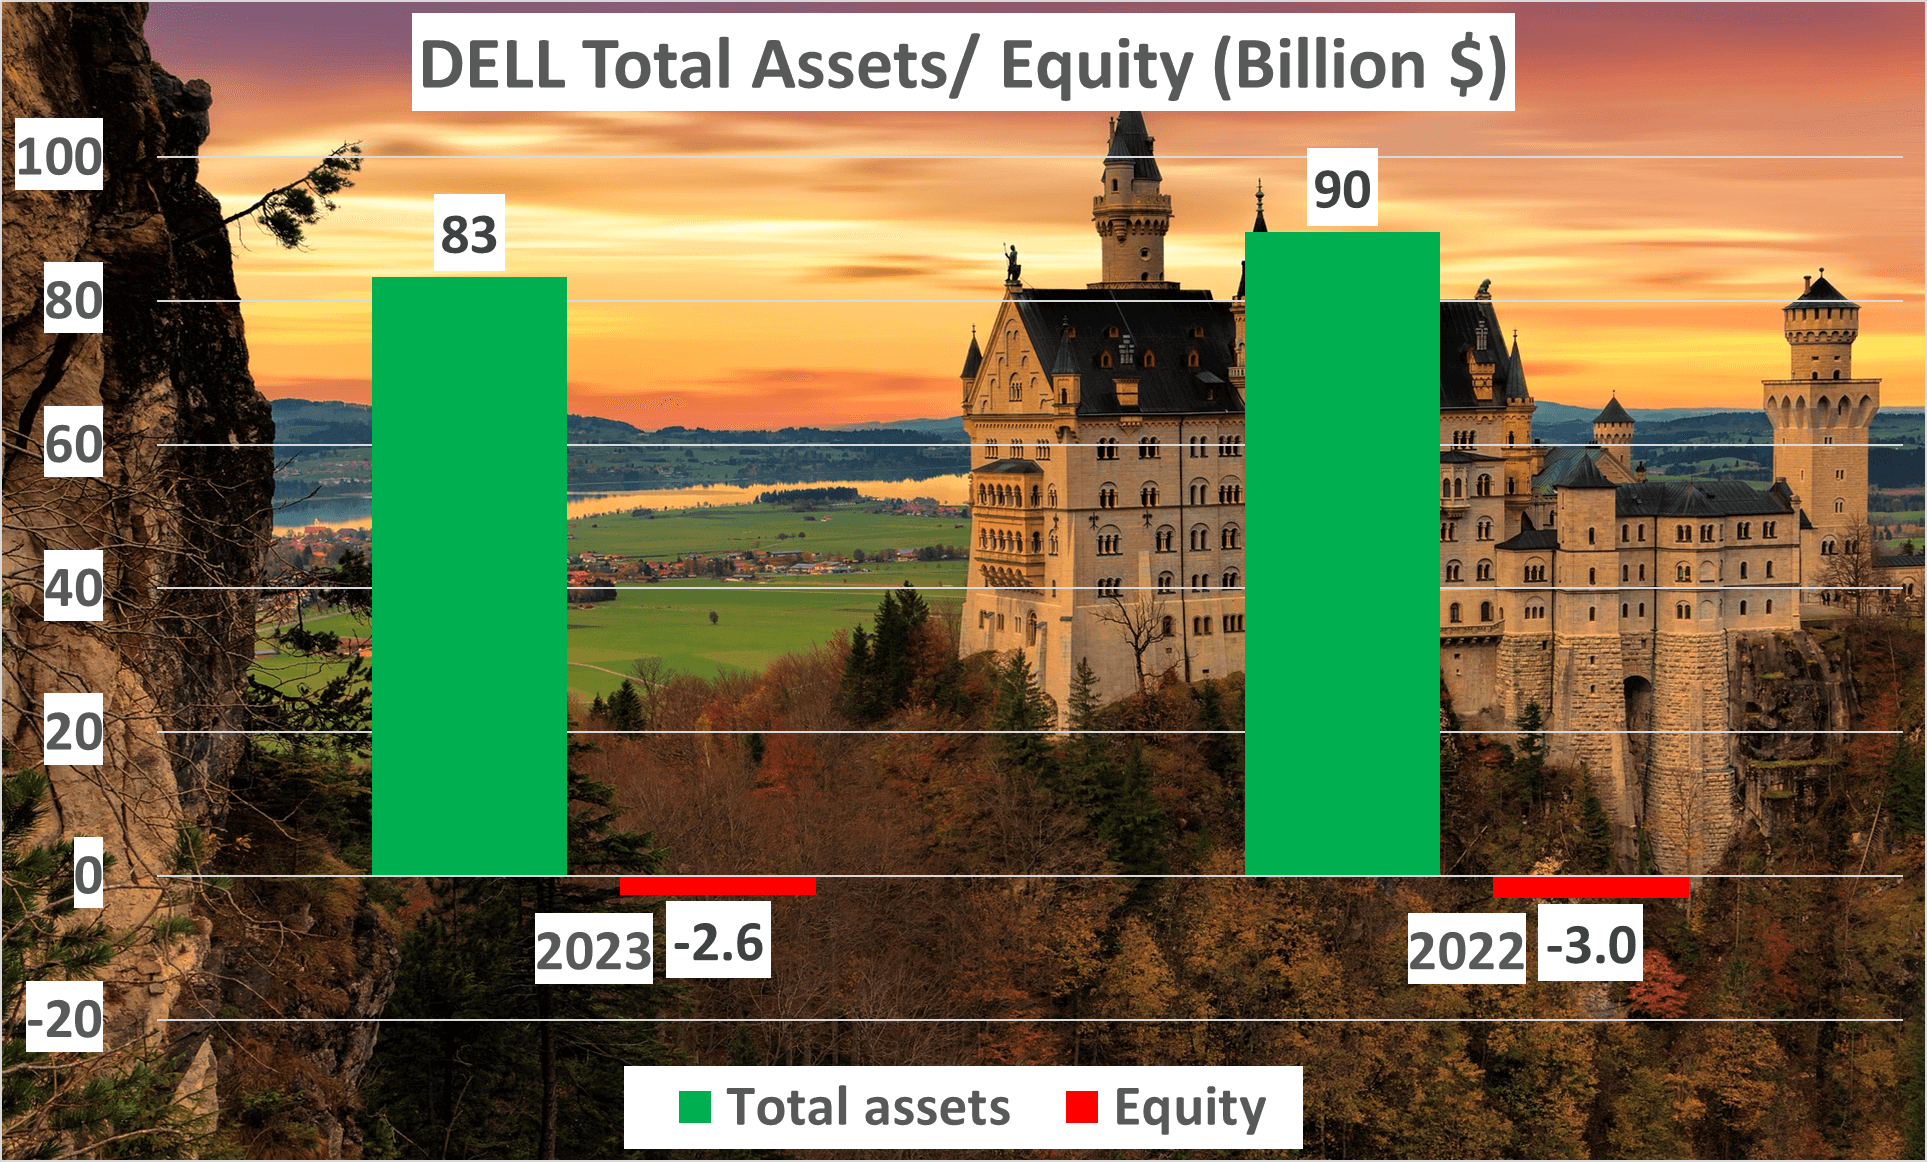

Of greater concern is the equity to total assets ratio, standing at -3% for both 2022 and 2023. This negative ratio indicates that Dell’s liabilities exceed its assets, raising a red flag for potential investors.
Liquidity Ratios Assessment:
Now, let’s explore liquidity ratios, commencing with the current ratio. This metric reflects a company’s ability to settle its short-term liabilities with its short-term assets. In 2023, Dell’s current ratio was 0.76, a slight decrease from 0.82 in 2022. This lower ratio suggests potential difficulty in paying off short-term liabilities.
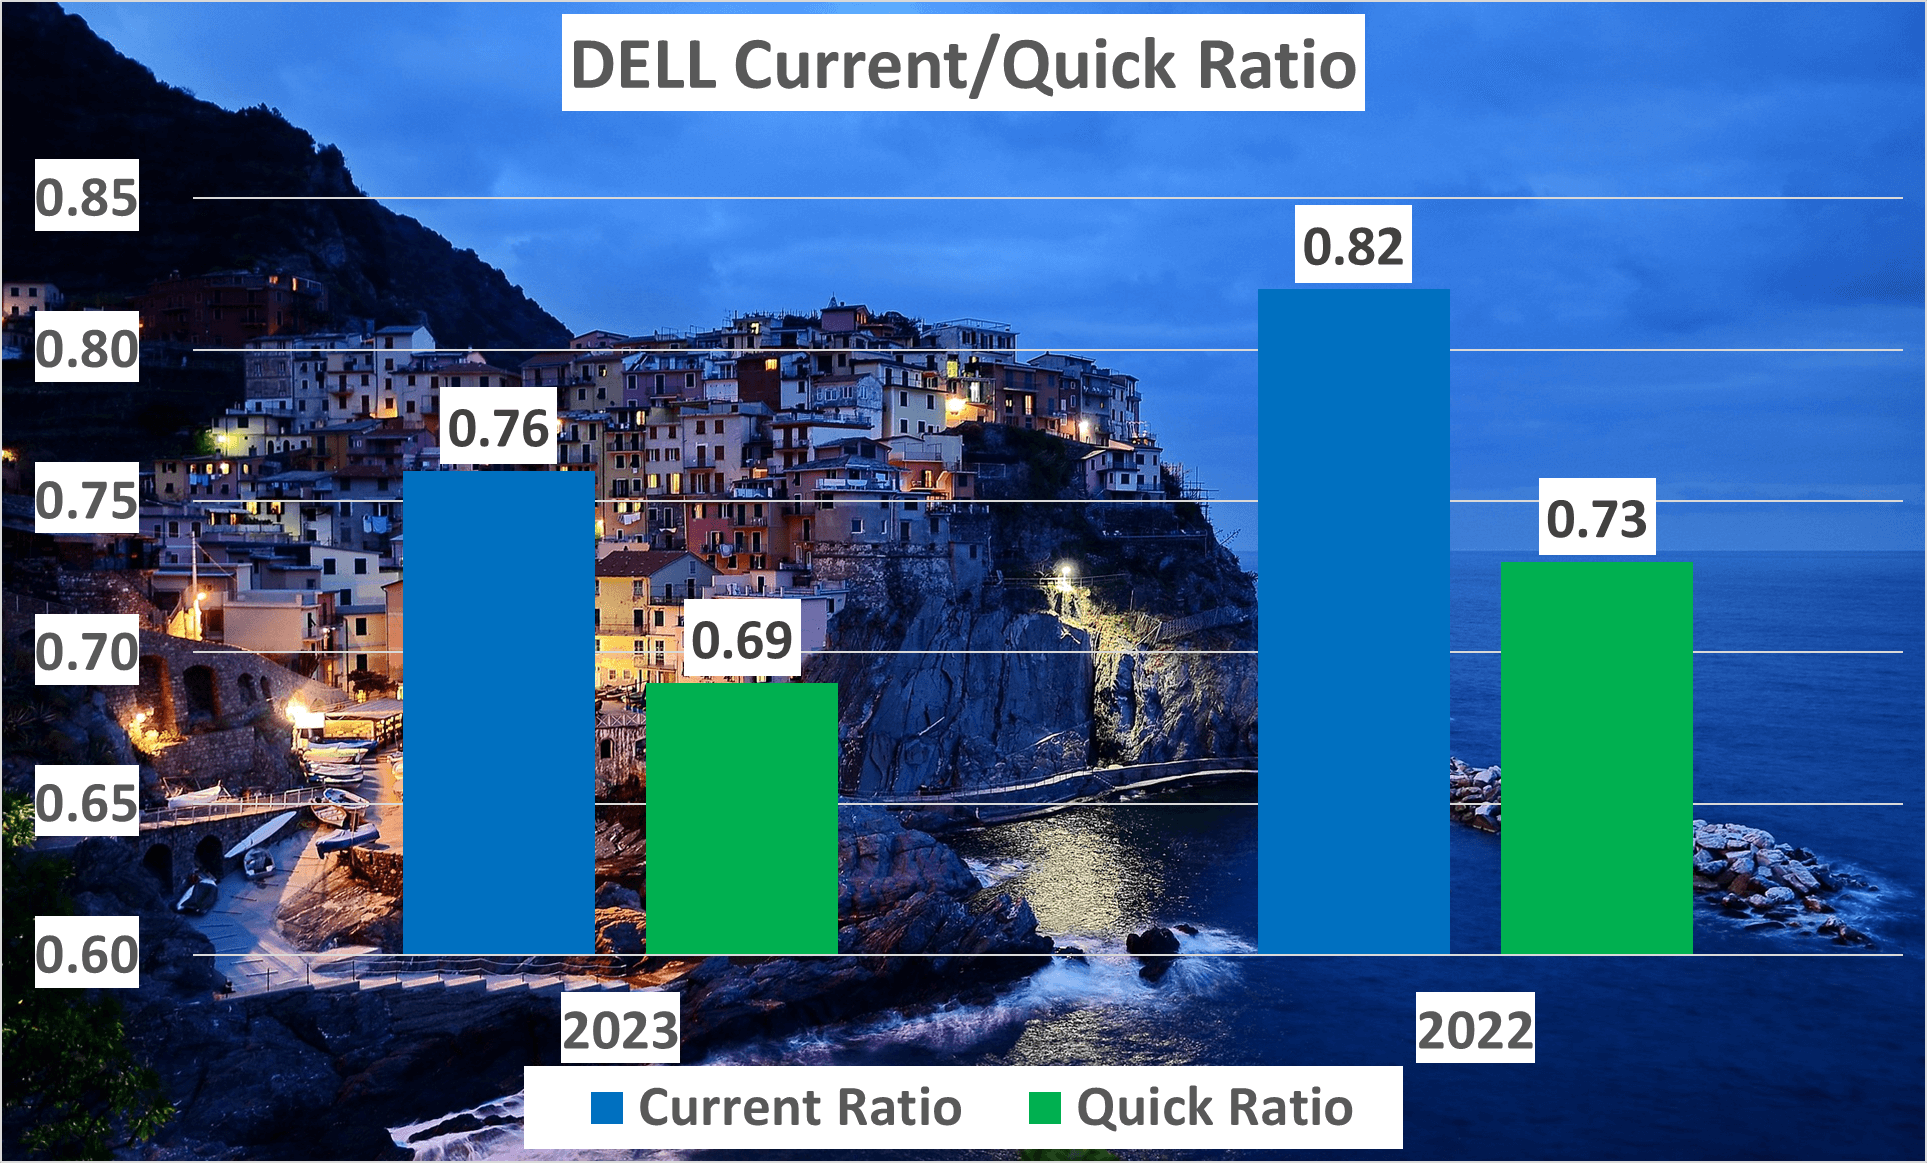

Moving on to the quick ratio, a more stringent measure of liquidity excluding inventory from current assets. In 2023, Dell’s quick ratio was 0.69, again slightly lower than 0.73 in 2022. Similar to the current ratio, a lower quick ratio may signal liquidity issues.
In summary, while Dell has displayed resilience in its net assets, the overall landscape raises concerns. The negative equity to total assets ratio, coupled with decreasing current and quick ratios, suggests that Dell’s financial health encounters challenges. Dell’s financial health reflects some hurdles, particularly evidenced by a negative equity to total assets ratio.
Dell’s Cash Flow and Dupont Analysis – DELL Stock Analysis
Let’s dive deeper into Dell’s cash flow and Dupont analysis.
In the realm of finance, a company’s cash flow stands as a pivotal indicator of its financial well-being. Simply put, cash flow delineates the movement of funds in and out of a business. For Dell, the operating cash flow for 2023 amounted to $7.1 billion, marking a significant increase compared to the preceding year.
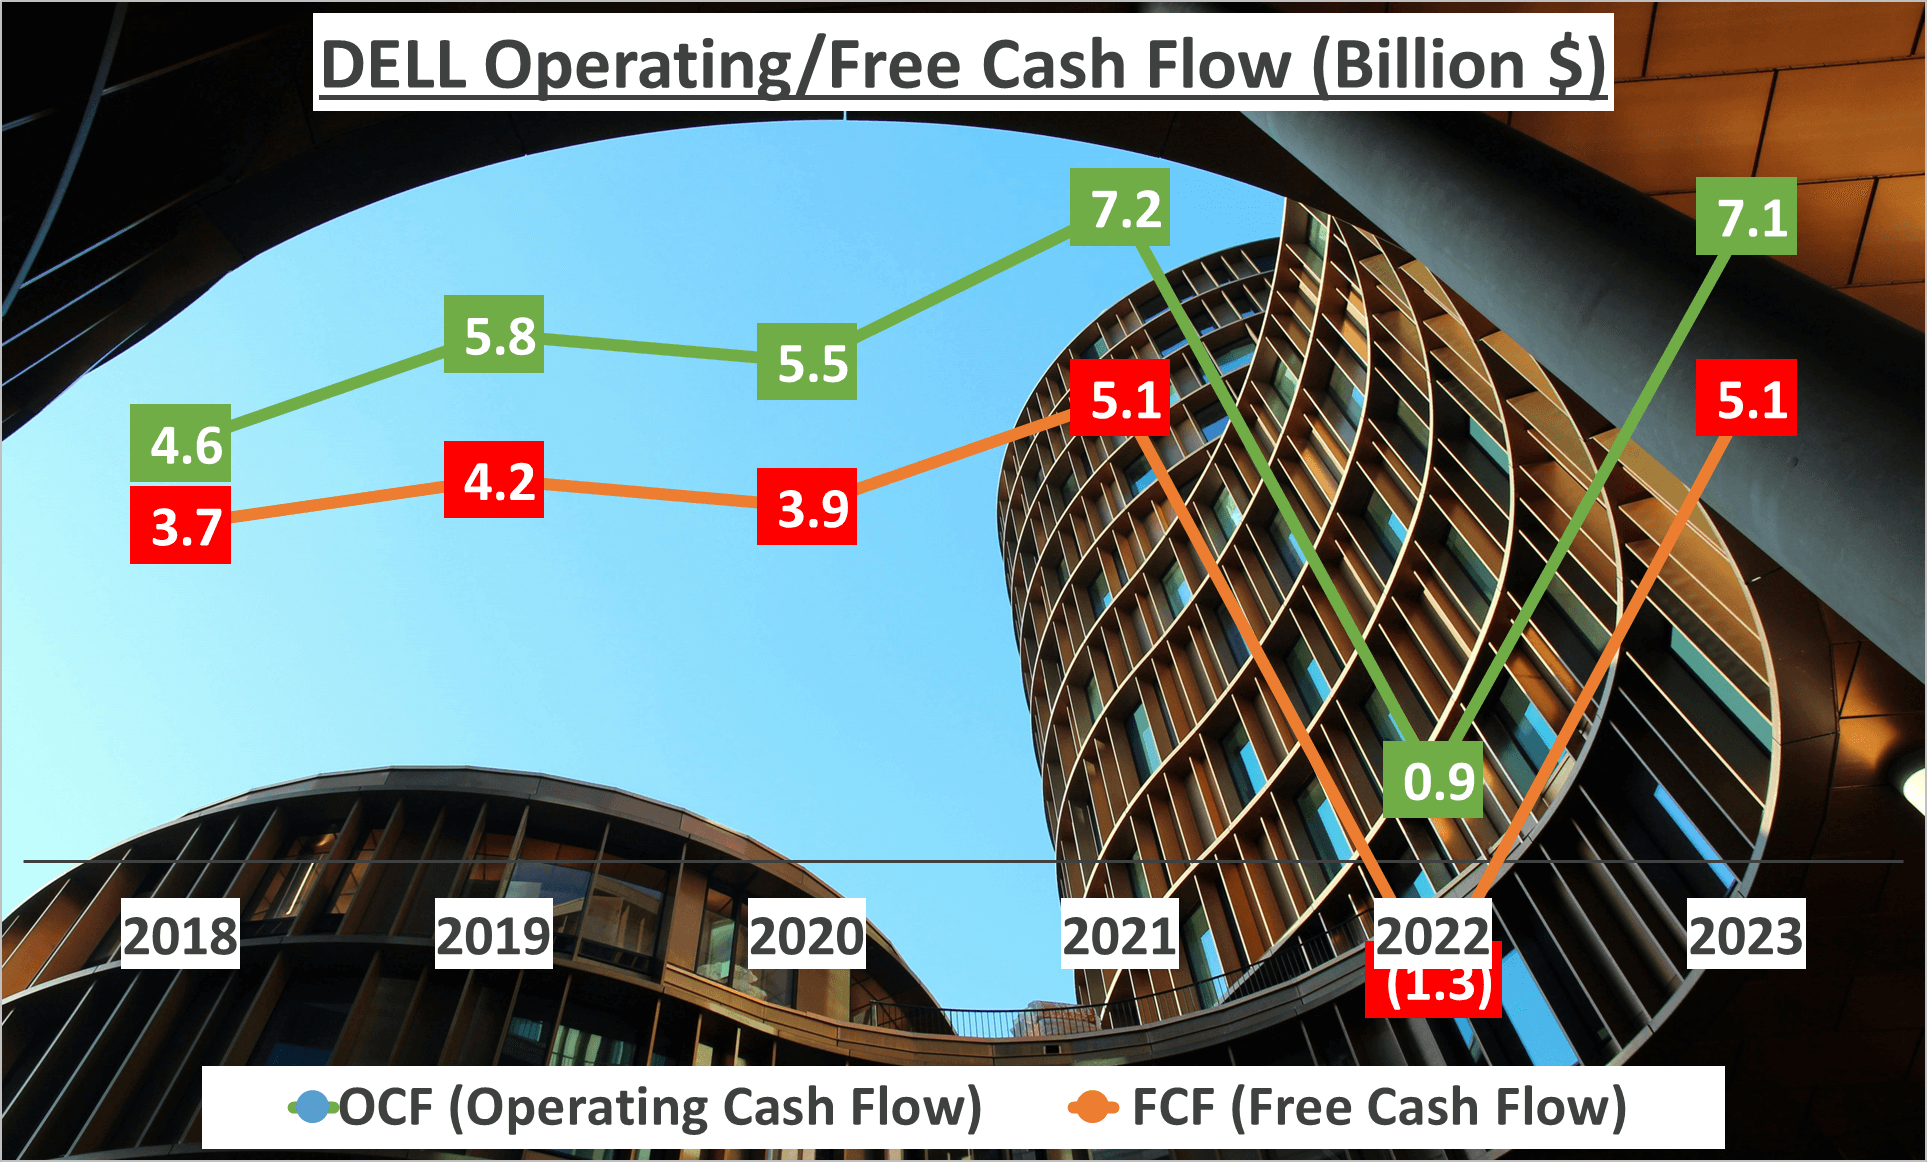

Similarly, Dell’s free cash flow, representing the cash generated after accounting for capital expenditures, also exhibited robust growth. In 2023, Dell’s free cash flow stood at $5.1 billion.
Dupont Analysis Insight:
To obtain a comprehensive understanding of Dell’s financial performance, it’s imperative to move beyond cash flow alone. This leads us to the Dupont analysis, a technique dissecting return on equity (ROE) into three components: net profit margin, asset turnover, and equity multiplier. This analysis enables scrutiny of return sources and comprehension of the company’s operational efficiency, asset utilization, and financial leverage.
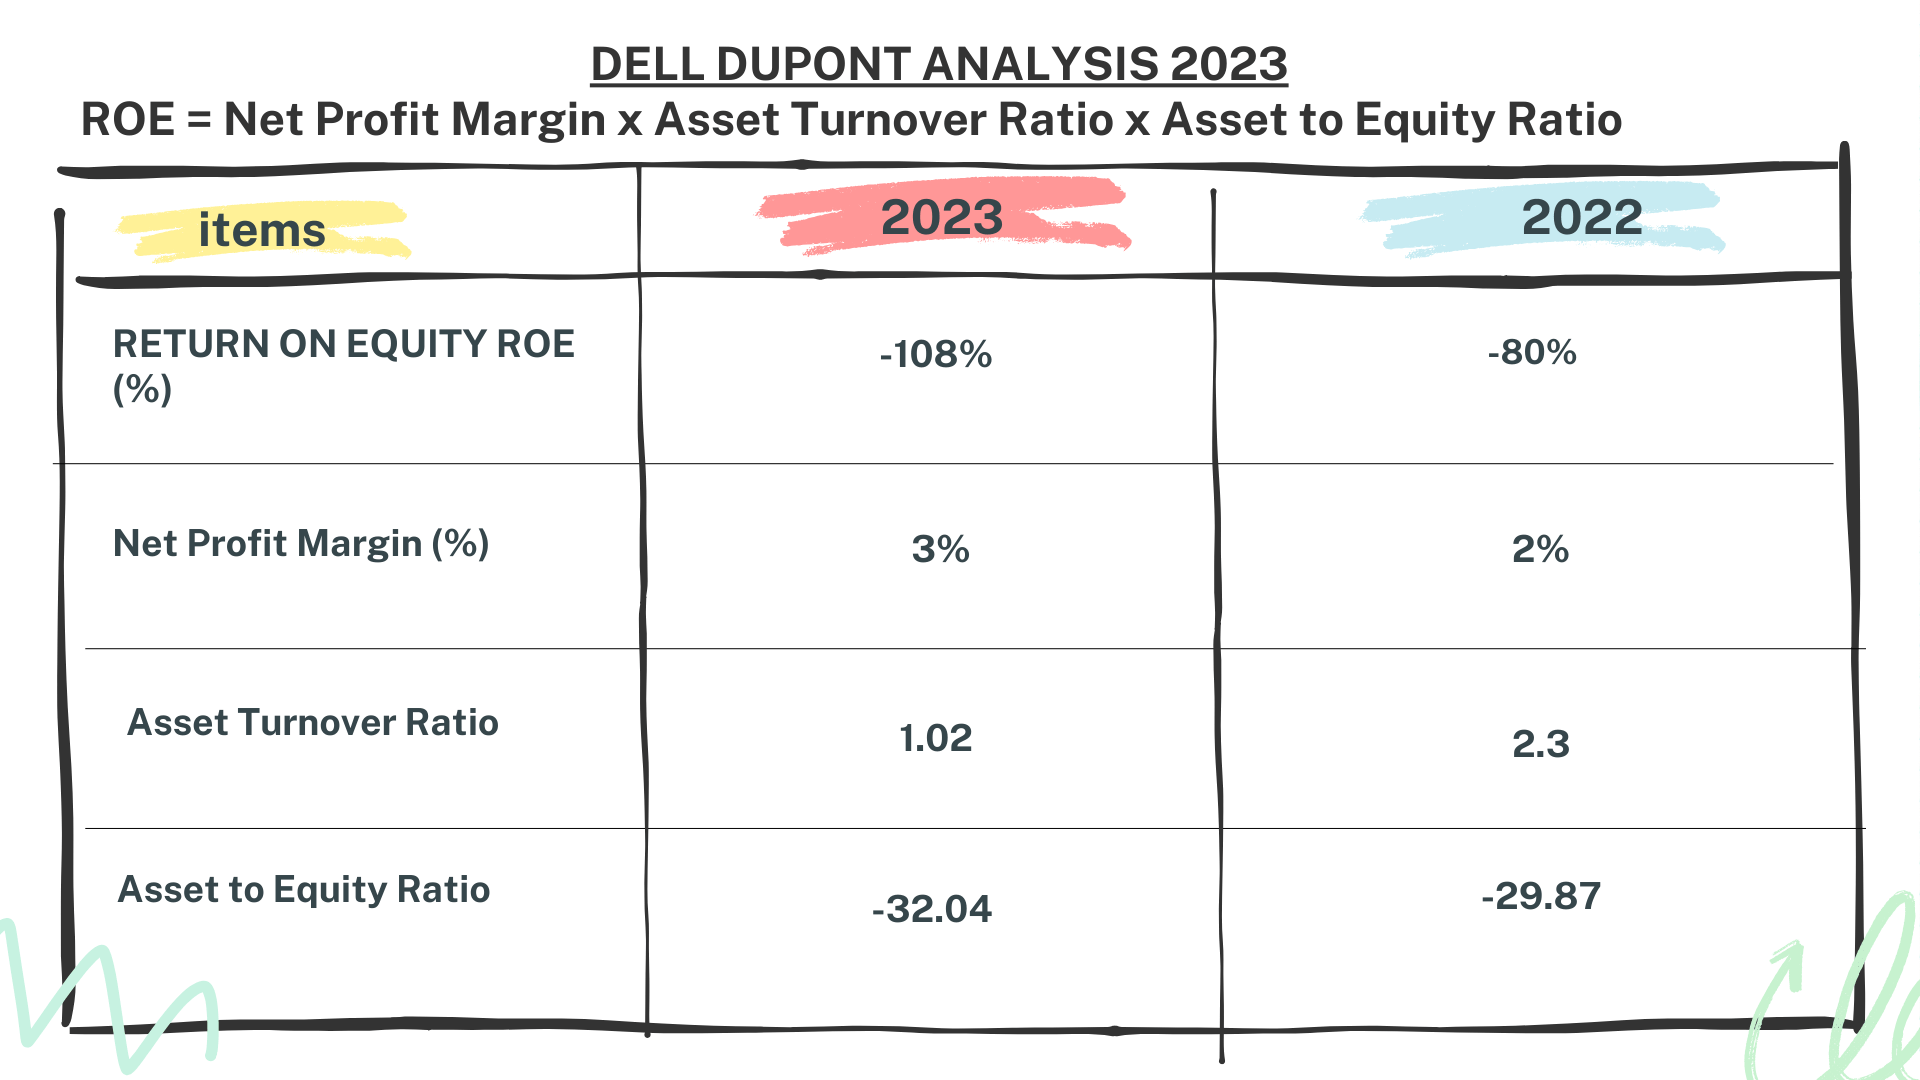

In 2023, Dell’s ROE registered at -108%. This stemmed from a net profit margin of 3%, an asset turnover of 1.02, and an equity multiplier of -32.04. Despite turning revenue into profit, Dell’s high financial leverage resulted in negative ROE.
By comparison, in 2022, Dell’s ROE stood at -80%, with a net profit margin of 2%, asset turnover of 2.3, and an equity multiplier of -29.87.
In summary, although Dell’s ROE reflects negativity, indicative of financial leverage issues, it’s crucial to highlight the substantial growth in operating cash flow and free cash flow. These figures signify Dell’s success in cash generation despite challenges.
Despite negative ROE, Dell’s operating cash flow and free cash flow exhibit remarkable growth.
Conclusion and Call to Action – Dell Stock Analysis
So, what implications does all this hold for potential investors?
Over the past six years, Dell has showcased remarkable growth of 369%, transforming a $1,000 investment in 2018 into $4,693 by March 2024. Despite fluctuations, Dell’s revenue and net profit have maintained an overall upward trajectory, bolstered by its diverse revenue structure, lending resilience to its financial stability.


However, challenges persist. Dell’s financial health metrics, such as its current ratio and quick ratio, have experienced some decline, alongside net assets remaining in negative territory.
Nevertheless, amidst these challenges, Dell’s robust operating cash flow and free cash flow in 2024 underscore its ability to generate profits and uphold liquidity. Additionally, its Dupont analysis unveils a complex web of factors shaping its return on equity.
It’s crucial to remember that investing inherently carries risks. Therefore, conducting thorough research is paramount. Don’t hesitate to subscribe for more insightful company analysis videos. If there’s a specific company you’d like us to analyze, feel free to share your thoughts in the comments. Your feedback is invaluable to us.
Author: investforcus.com
Follow us on Youtube: The Investors Community


