Delta Airlines vs American Airlines Stock Analysis – Curious about which airline offers a superior investment opportunity in the stock market – Delta Air Lines or American Airlines?
As we embark on this financial journey, we’ll be comparing two of the leading airlines in the United States: Delta Air Lines, a major player in the aviation industry, and American Airlines, another titan of the skies.
But before we proceed, let’s delve into the financial metrics of these companies.
Why is this important, you might wonder? Because comprehending the financial performance is paramount for successful investing.
Think of it as the pre-flight checklist before a plane takes off. Just as you wouldn’t board a flight that hasn’t undergone thorough inspection, you wouldn’t want to invest in a company without understanding its financial fundamentals.
So, fasten your seatbelt and get ready for takeoff as we analyze the numbers, juxtapose the financials, and assess the investment potential of these two airlines.
Stay tuned as we sift through the data to determine which airline offers a more promising investment opportunity.
Revenue Analysis – Delta Airlines vs American Airlines Stock Analysis
Let’s dive into the numbers regarding revenue. How much capital are these corporations generating?
Let’s start with the fundamentals.
In the third quarter of 2023, Delta Air Lines raked in total revenues of $44B, whereas American Airlines trailed slightly behind with $40B.

Now, let’s zoom out for a broader perspective. Over the past five years, Delta has witnessed a Compound Annual Growth Rate (CAGR) of 5% in its revenues, while American Airlines clocked in a slightly lower growth rate of 3%.
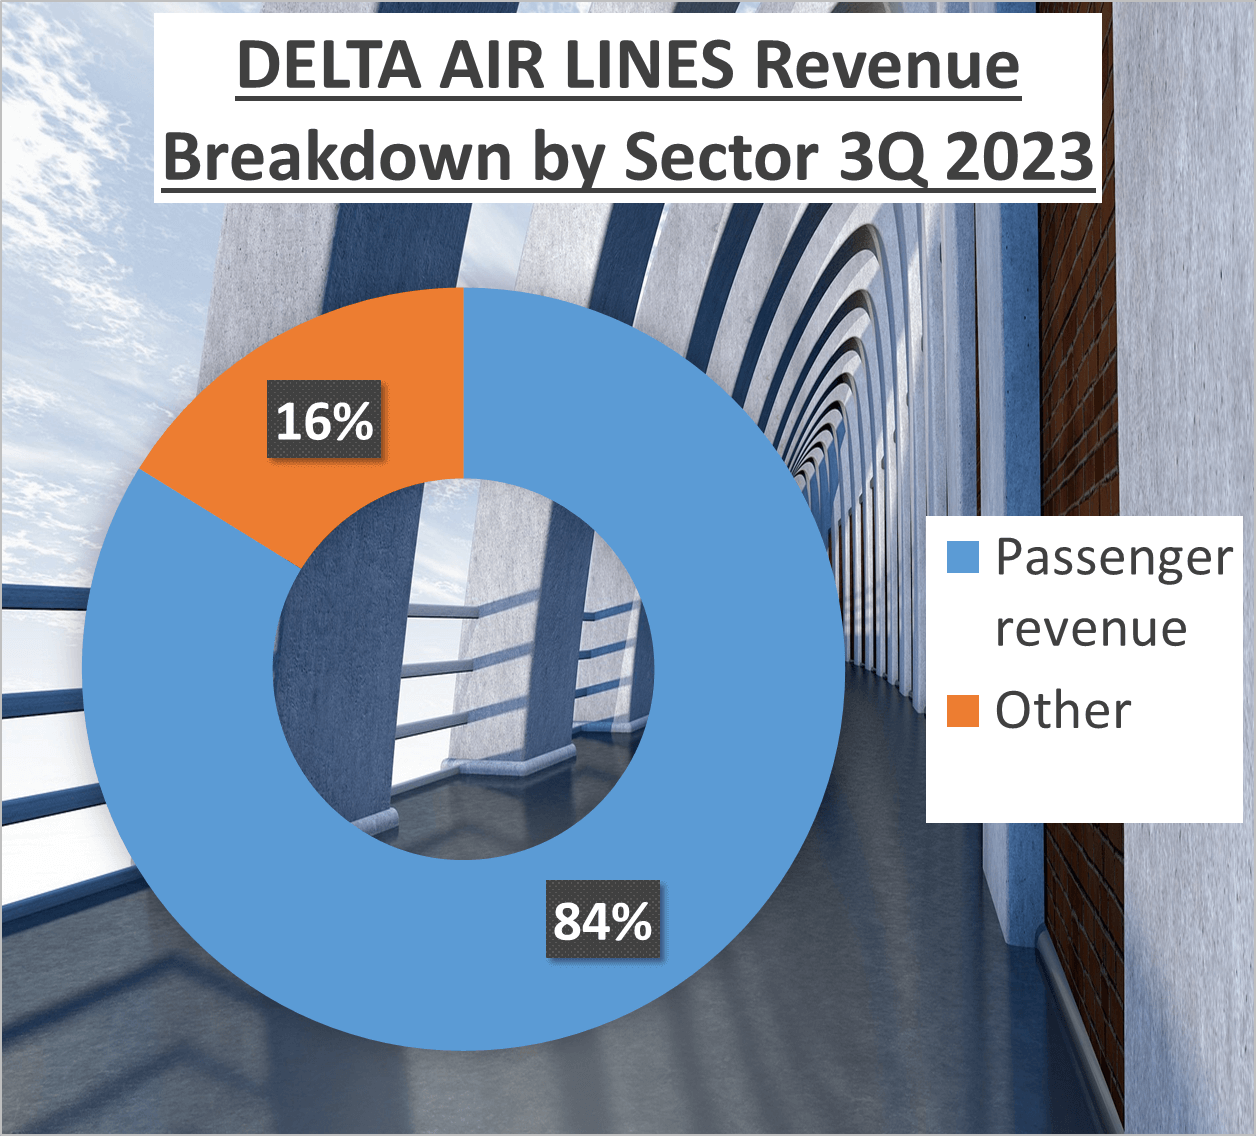
When dissecting the revenue by source, we observe that 84% of Delta’s revenues stem from passenger revenue, with the remaining 16% originating from other sources. Similarly, American Airlines reflects a parallel pattern, with 92% of its revenues sourced from passenger revenue and the remaining 8% from other avenues.
Let’s further enrich our analysis by scrutinizing the revenue breakdown by region.
For Delta, 70% of its revenues originate from domestic flights, while the remaining 30% is divided among Atlantic, Latin, and Pacific routes, contributing 19%, 7%, and 4%, respectively.
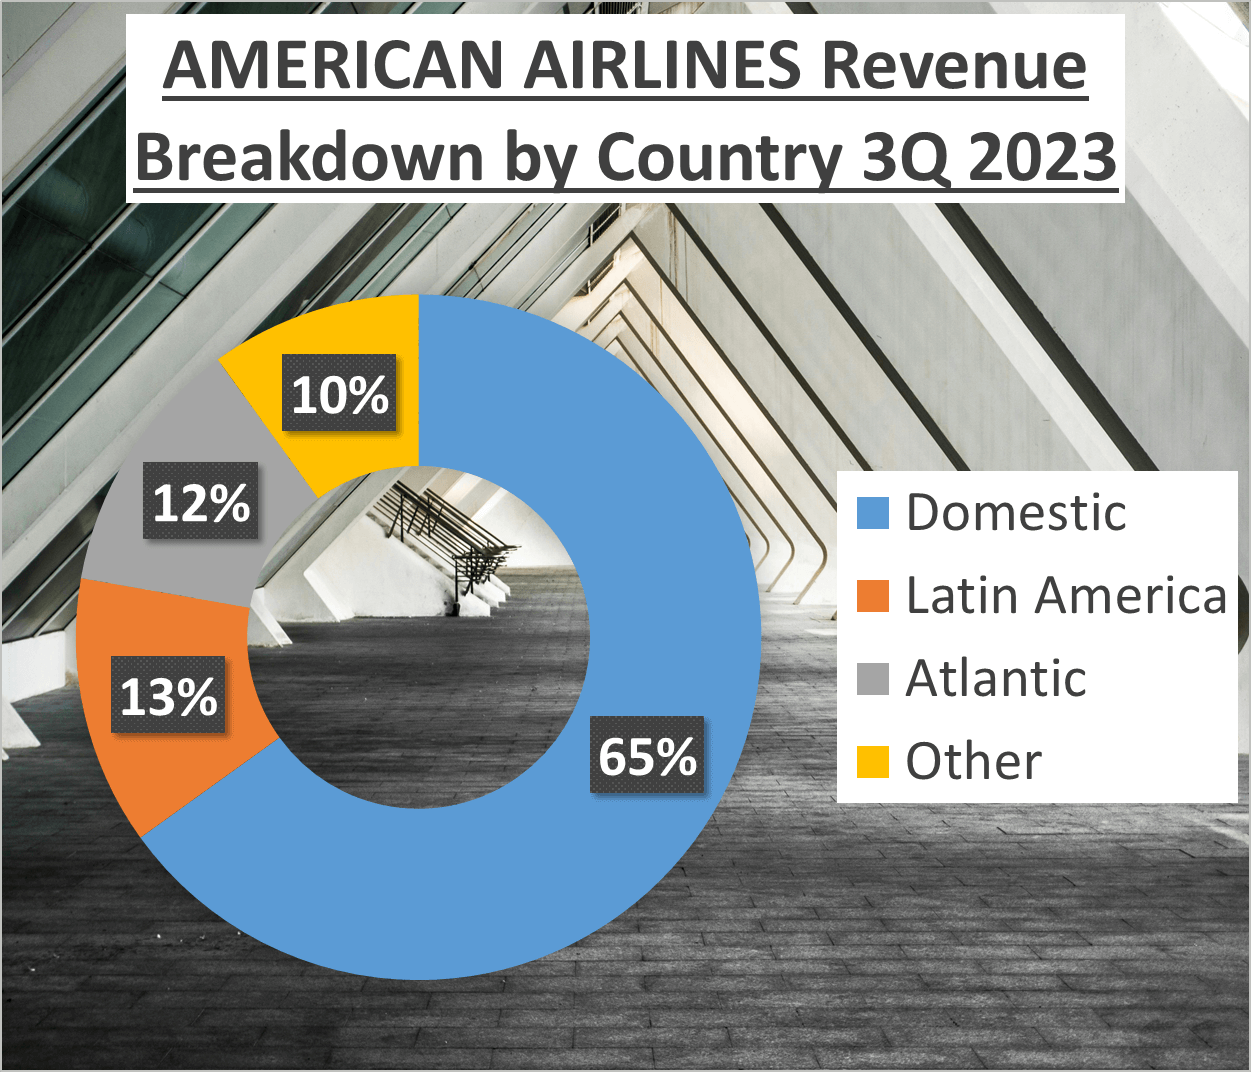
In comparison, American Airlines generates 65% of its revenues from domestic flights, with the remaining 35% dispersed across Latin America, Atlantic, and other regions, contributing 13%, 12%, and 10%, respectively.
Evidently, both airlines boast diverse revenue streams, yet Delta appears to hold a slight advantage. It boasts a marginally higher total revenue, a swifter growth rate, and a more diversified revenue source.
However, it’s crucial to acknowledge that these figures comprise only a fraction of the entire puzzle. In the subsequent section, we’ll plunge deeper into their profitability analysis to garner a clearer understanding of their financial robustness and operational efficacy.
Stay tuned as we persist in our comparative analysis of Delta Air Lines and American Airlines, two of the paramount players in the U.S. airline industry. Thus far, Delta seems to be forging ahead, but as seasoned investors recognize, the game is far from concluded.
Profit Analysis – Delta Airlines vs American Airlines Stock Analysis
Profitability stands as a pivotal factor in any investment deliberation. Hence, let’s scrutinize the profitability metrics of these airline behemoths.
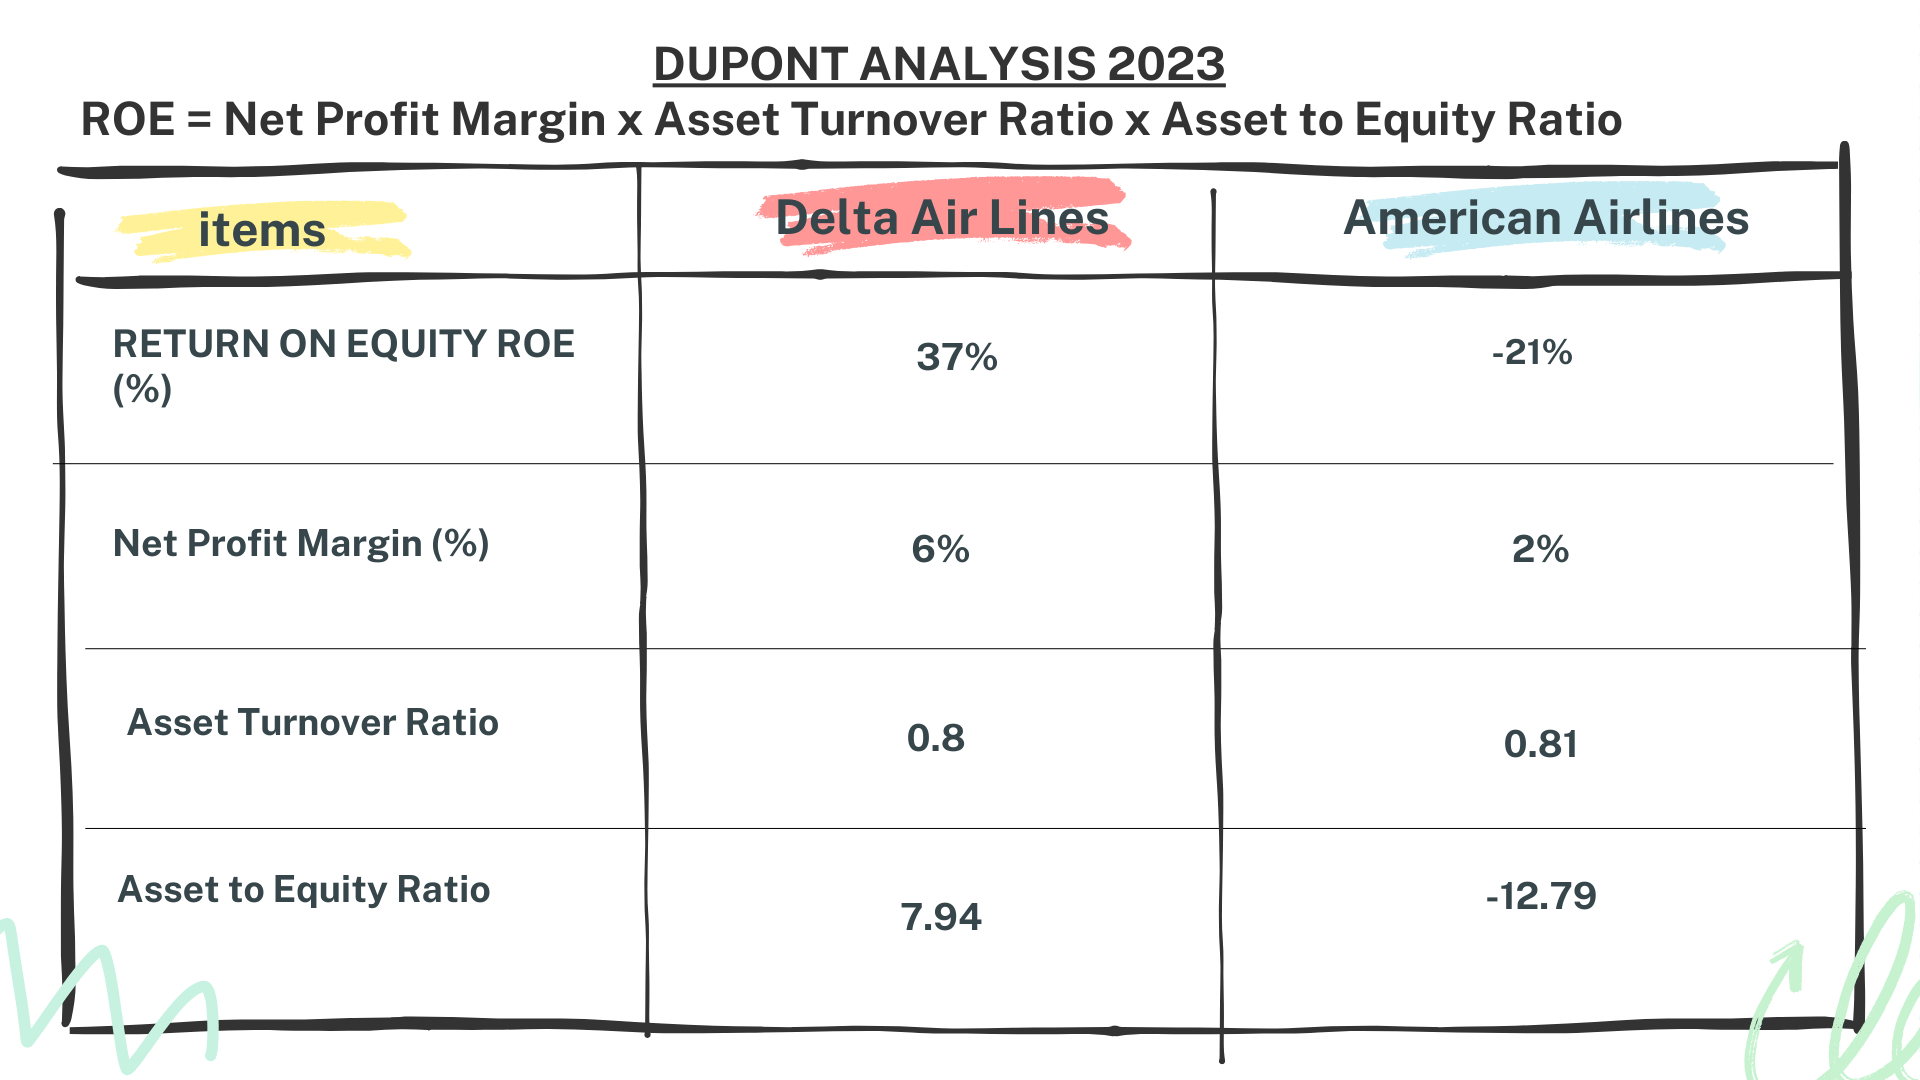
Delta Air Lines boasts a net profit margin of 6%, marking a notable ascent from their five-year average of -10%. Conversely, American Airlines exhibits a net profit margin of 2%, showing an improvement from their five-year average of -8%.

While these net profit margins might appear conservative, it’s vital to acknowledge the airline industry’s reputation for slender margins due to soaring operational expenses.
Regarding net profit growth rates, the first three quarters of 2023 witnessed Delta Air Lines amassing a net profit of $2.6B, while American Airlines garnered a net profit of $0.8B. When juxtaposed with the same timeframe in 2018, Delta Air Lines manifests a Compound Annual Growth Rate (CAGR) of -2%, whereas American Airlines showcases a CAGR of -6% over the preceding five years.

Let’s address the elephant in the room – the COVID-19 pandemic. The year 2020 proved grueling for the entire aviation sector. Delta Air Lines reported a net loss of -$6.7B, while American Airlines incurred a net loss of -$11.6B. These losses predominantly stemmed from the precipitous decline in passenger demand triggered by global lockdowns and travel restrictions.
What inference can we draw from these figures? Evidently, Delta Air Lines maintains a higher net profit margin in contrast to American Airlines. Nevertheless, both carriers encountered substantial hurdles in sustaining profitability over the past five years, with the COVID-19 pandemic exacerbating these challenges.
Delta may flaunt a superior net profit margin, yet both airlines grappled with profitability concerns in the preceding five-year period.
Asset and Liquidity Analysis – Delta Airlines vs American Airlines Stock Analysis
Let’s shift our focus to the asset side of the balance sheet, which plays a pivotal role in assessing the financial robustness of any enterprise, encompassing everything from aircraft to liquid cash reserves.
As of the third quarter of 2023, Delta Air Lines boasted total assets amounting to $73B, whereas American Airlines trailed slightly with total assets valued at $66B. This disparity underscores a significant variance in the asset base of both airlines, with Delta enjoying a $7B advantage.
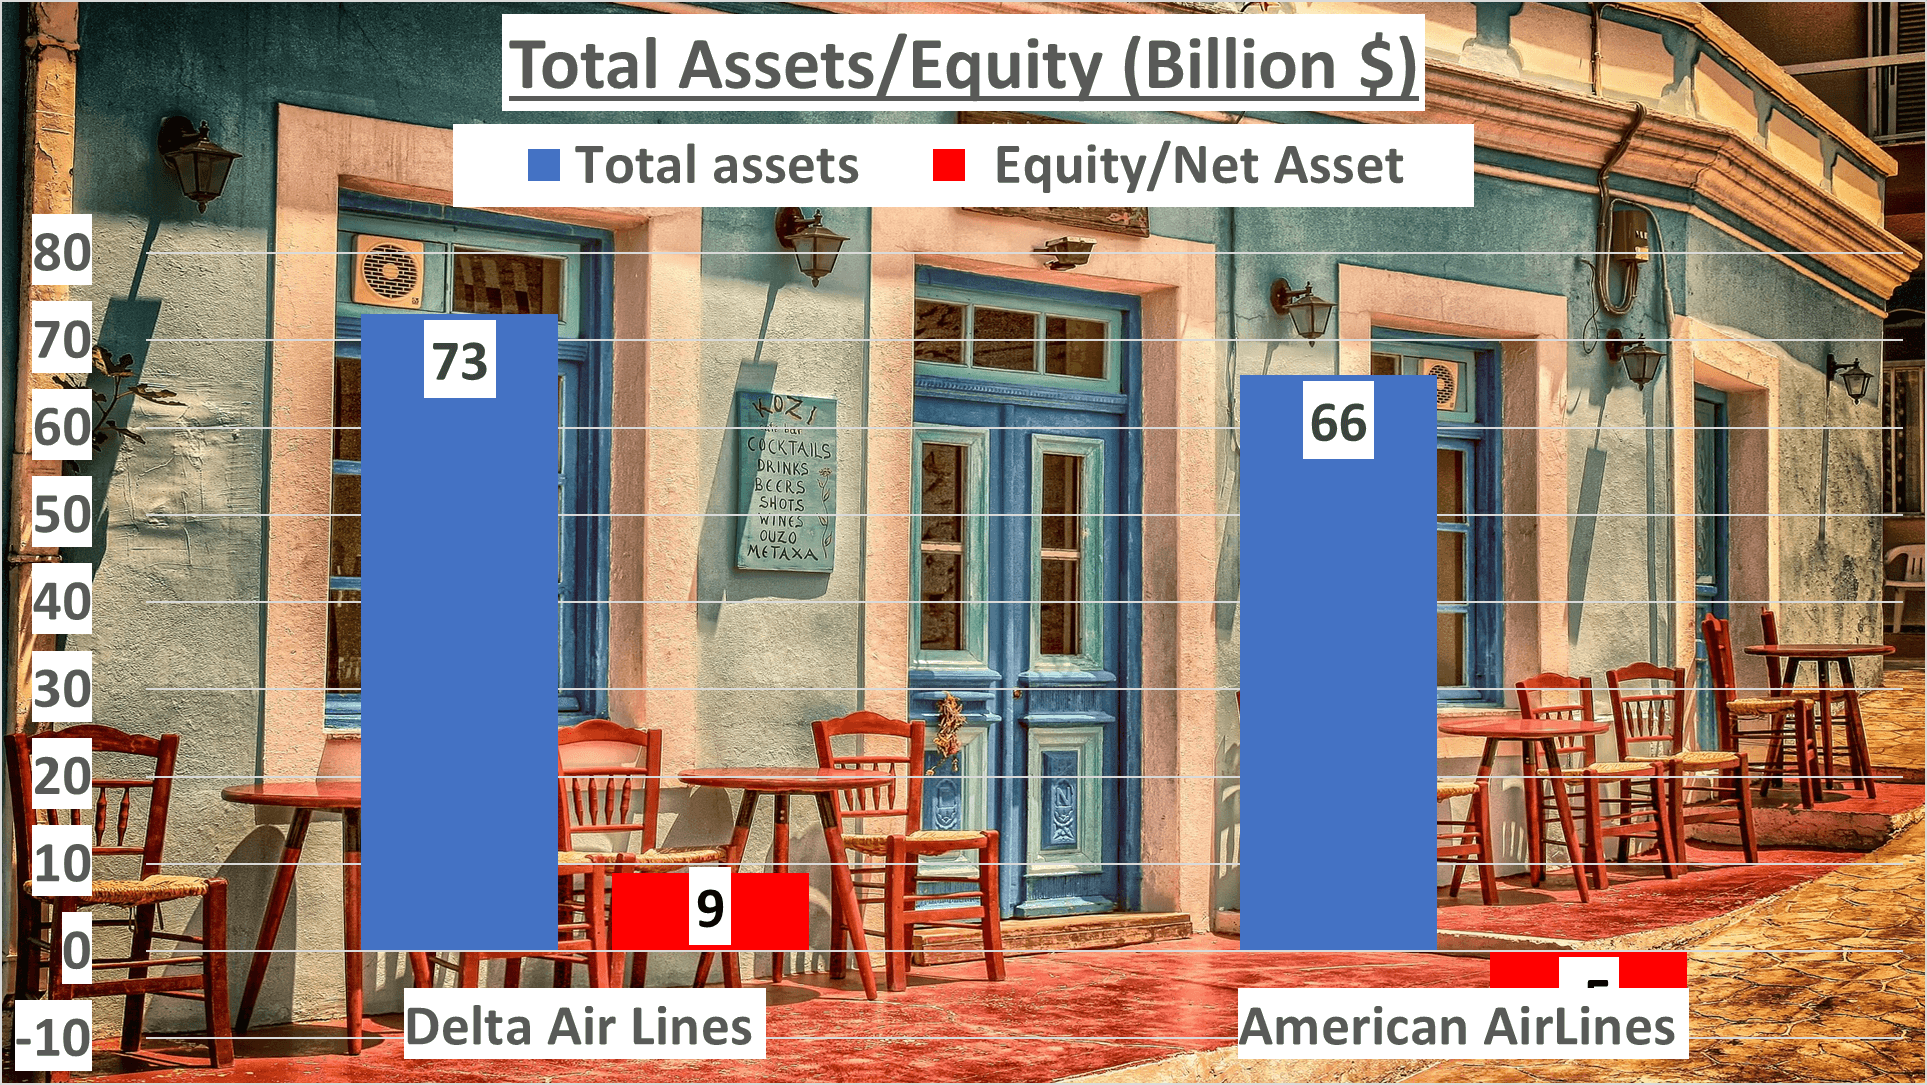
Next, let’s scrutinize net assets, also referred to as equity, which delineate the residual value for shareholders post deduction of liabilities from total assets. For Delta, net assets stood at $9B, contrasting starkly with American Airlines’ negative net assets of -$5B, indicative of liabilities surpassing assets—a disconcerting revelation for potential investors.
The current ratio, another pivotal metric, gauges a company’s ability to settle short-term liabilities with short-term assets, with a ratio below one hinting at potential liquidity constraints. In the third quarter of 2023, Delta’s current ratio stood at 0.44, marginally trailing behind American Airlines’ slightly superior ratio of 0.69.

Lastly, let’s address accounts receivable days, a metric denoting the duration for a company to collect cash from credit sales. For airlines, this duration typically remains low, given upfront payment for most tickets. Delta reported accounts receivable days of 20, whereas American Airlines exhibited an even swifter cash collection cycle at 14 days.
While American Airlines boasts a marginally higher current ratio, Delta stands out with a more robust asset base. This comparative analysis provides intriguing insights into the financial health and operational efficacy of these two aviation giants.
Cash Flow Analysis – Delta Airlines vs American Airlines Stock Analysis
Cash reigns supreme in the realm of business. So, how do these aviation giants fare in terms of cash flow?
In the third quarter of 2023, Delta Air Lines disclosed an operating cash flow of $5.9B, depicting the revenue generated from core business operations before accounting for capital expenditures. Conversely, American Airlines reported an operating cash flow of $5.2B, slightly trailing behind Delta.

However, when scrutinizing free cash flow, which represents the cash surplus post deduction of capital expenditures, the narrative takes a turn. Delta recorded a free cash flow of $2.2B, while American Airlines showcased a higher free cash flow of $3B, suggesting a superior efficiency in converting operating cash flow into free cash flow for the latter.

Now, let’s delve into the OCF to Net Income ratios, providing insights into how a company’s cash flow from operations aligns with its net income. A higher ratio signifies a greater proportion of cash generation vis-à-vis reported net income. Delta boasted a ratio of 2.3, indicative of its operating cash flow being 2.3 times its net income. Conversely, American Airlines boasted a ratio of 6.5, signaling a substantial surplus of cash generated compared to net income.
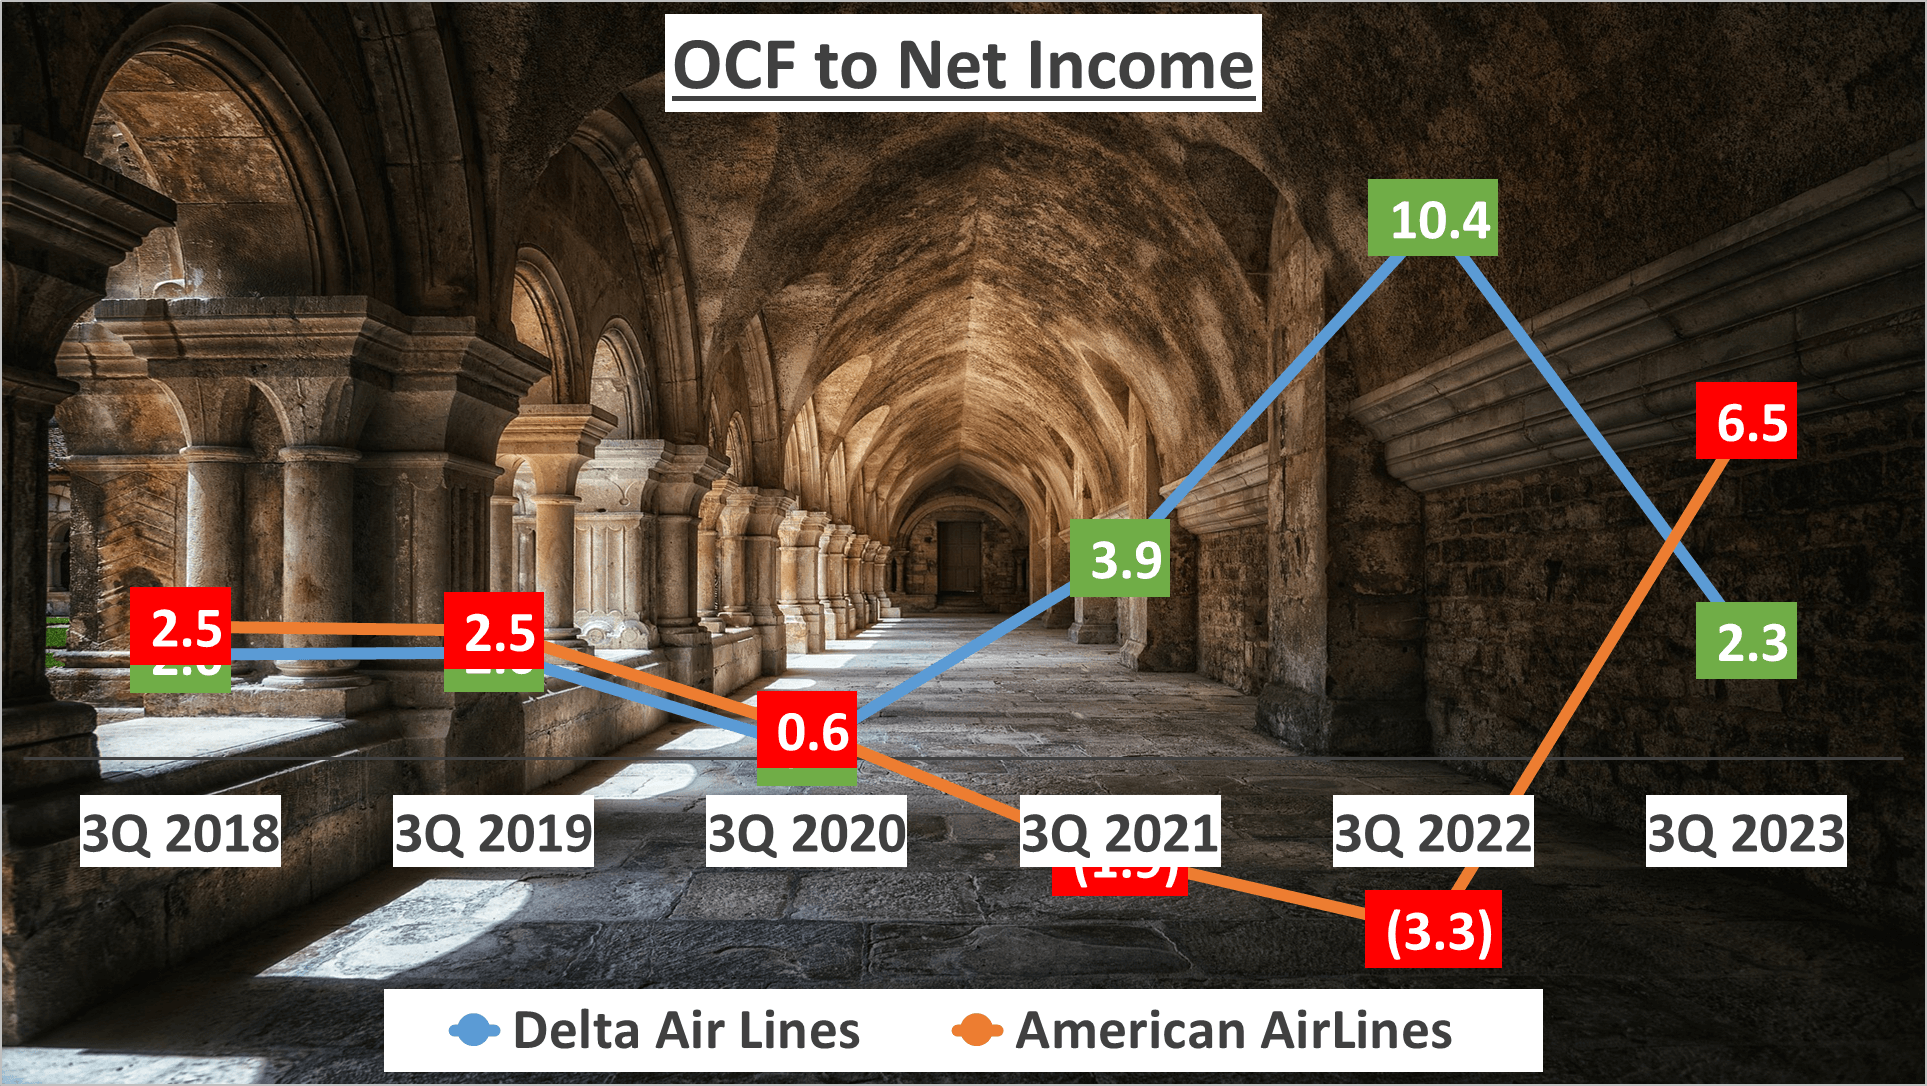
What does this signify? Both airlines exhibit commendable cash flow generation from operations. However, American Airlines demonstrates a penchant for efficient conversion of operating cash flow into free cash flow and manifests a significantly higher cash surplus compared to net income, as highlighted by its elevated OCF to Net Income ratio.
In summation, while both contenders display robust cash flows, American Airlines holds a slight advantage in this arena. Nonetheless, it’s imperative to consider the broader financial landscape before making investment decisions.
Both airlines exhibit robust cash flows, yet American Airlines holds a slight edge in this domain.
Author: investforcus.com
Follow us on Youtube: The Investors Community
