Tesla Stock Analysis Over the years, TESLA’s stock has exhibited remarkable growth. From its modest origins to emerging as a dominant player in the electric vehicle (EV) sector, TESLA’s ascent is truly impressive. Picture this: if you’d invested $5,000 in TESLA in 2018, your investment would now be valued at over $40,000. That’s an eightfold increase in just six years.

TESLA’s evolution from a startup with big ambitions to a global powerhouse in automotive and renewable energy sectors underscores its innovative spirit and relentless pursuit of excellence. The company’s financial performance has been exceptional, with revenue and profits consistently increasing year over year.
From 2018 to 2024, TESLA’s stock has experienced an outstanding annual growth rate of 52%. This extraordinary growth isn’t merely a result of market speculation or investor enthusiasm. It’s a reflection of TESLA’s solid business fundamentals, diverse and innovative product portfolio, and robust financial performance.
TESLA Stock Analysis – Revenue Breakdown
The revenue growth of TESLA has been extraordinary over the years. In 2023 alone, TESLA amassed a staggering $96.8B in revenue.
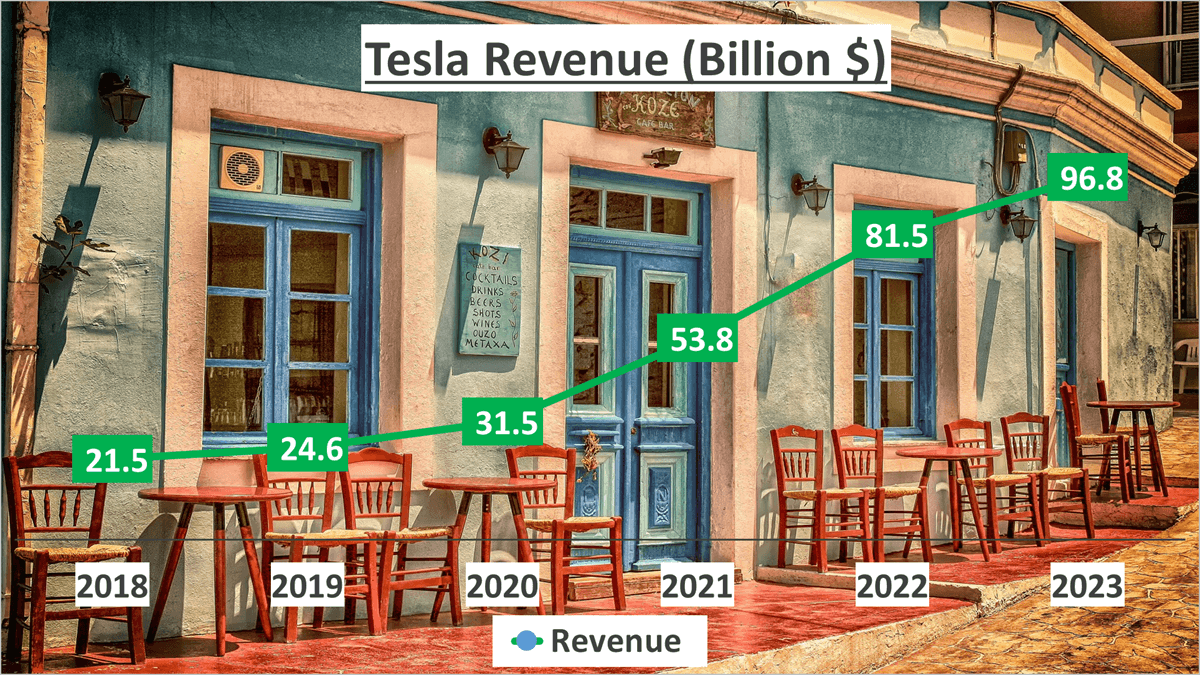
This achievement is noteworthy, especially considering the company’s consistent revenue growth rate of 35% per annum since 2018.
Let’s delve into the yearly breakdown:
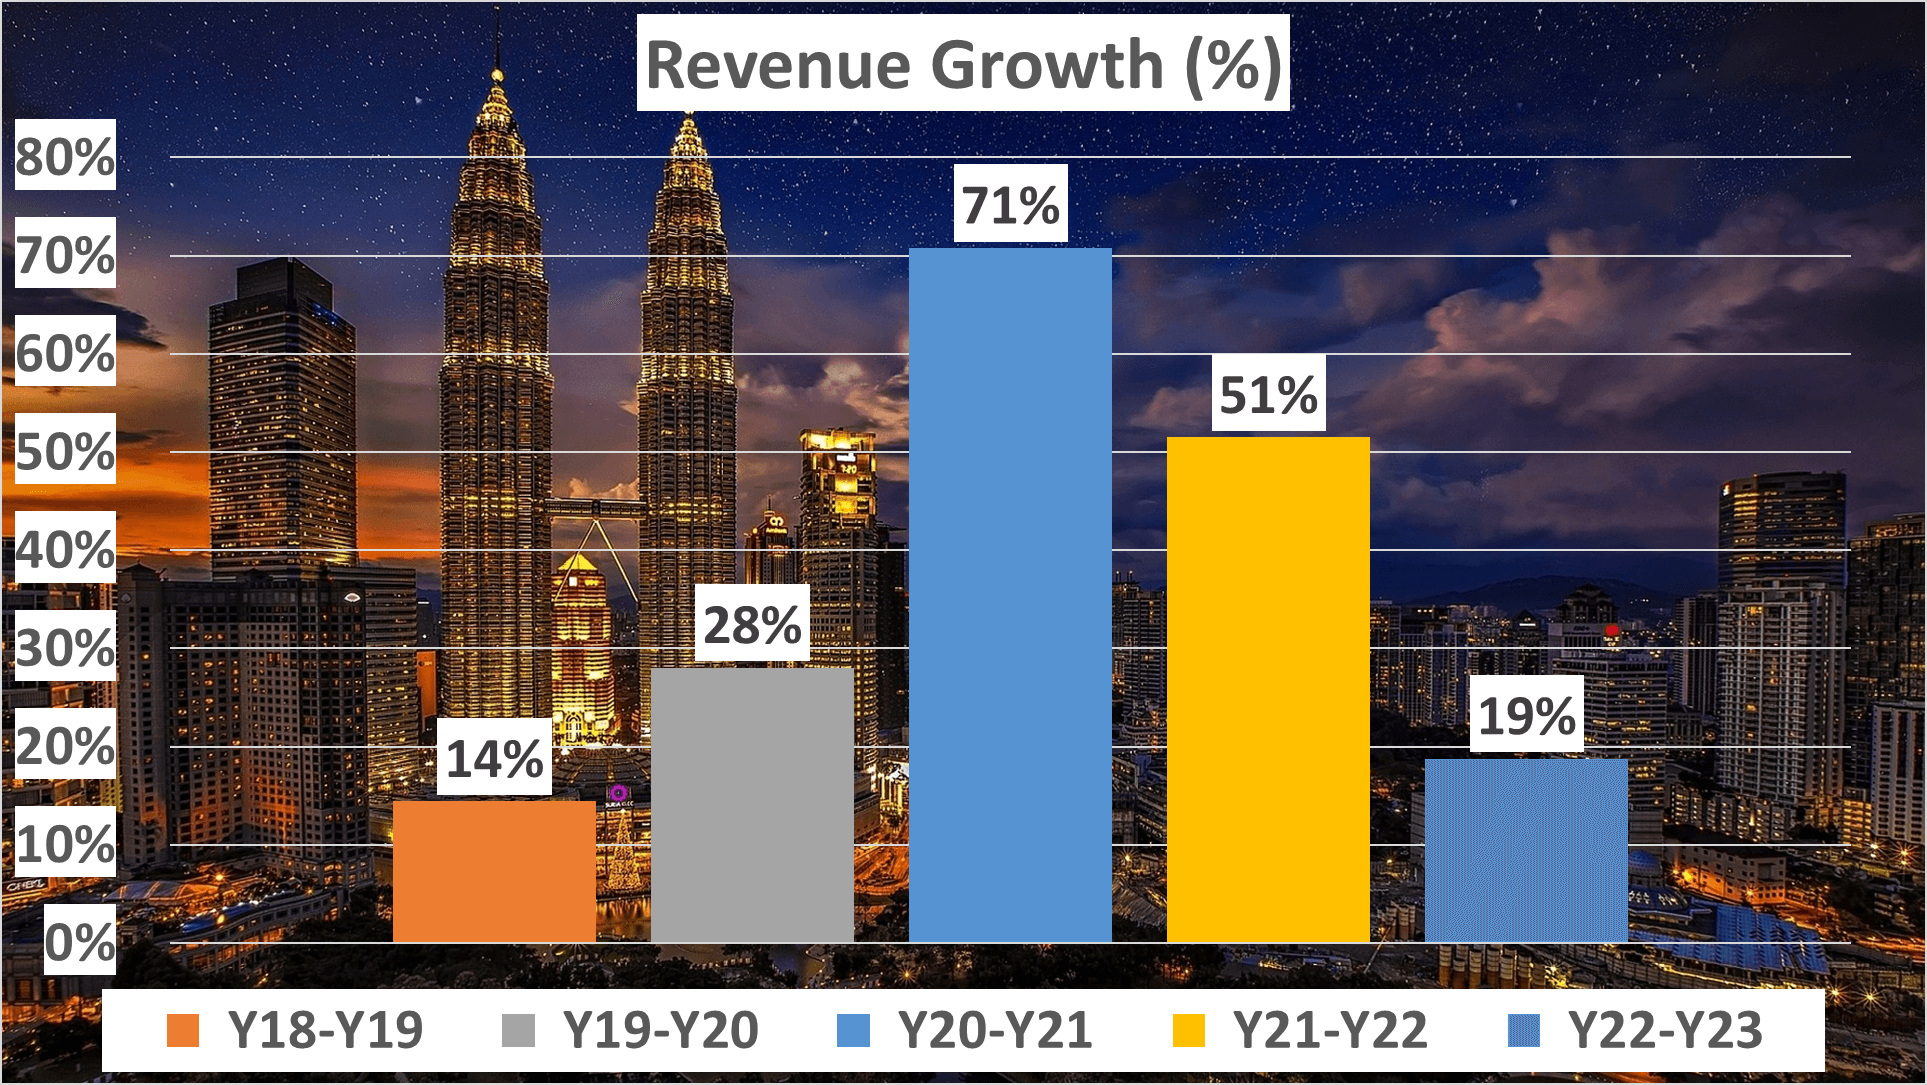
- Between 2018 and 2019, TESLA experienced a 14% uptick in revenue.
- The following year, from 2019 to 2020, revenue surged by 28%.
- In 2021, revenue skyrocketed by an impressive 71%.
- Despite a slight slowdown in 2022, with a 51% increase, TESLA maintained robust growth.
- By 2023, growth moderated to 19%, yet it remained substantial given the elevated base.
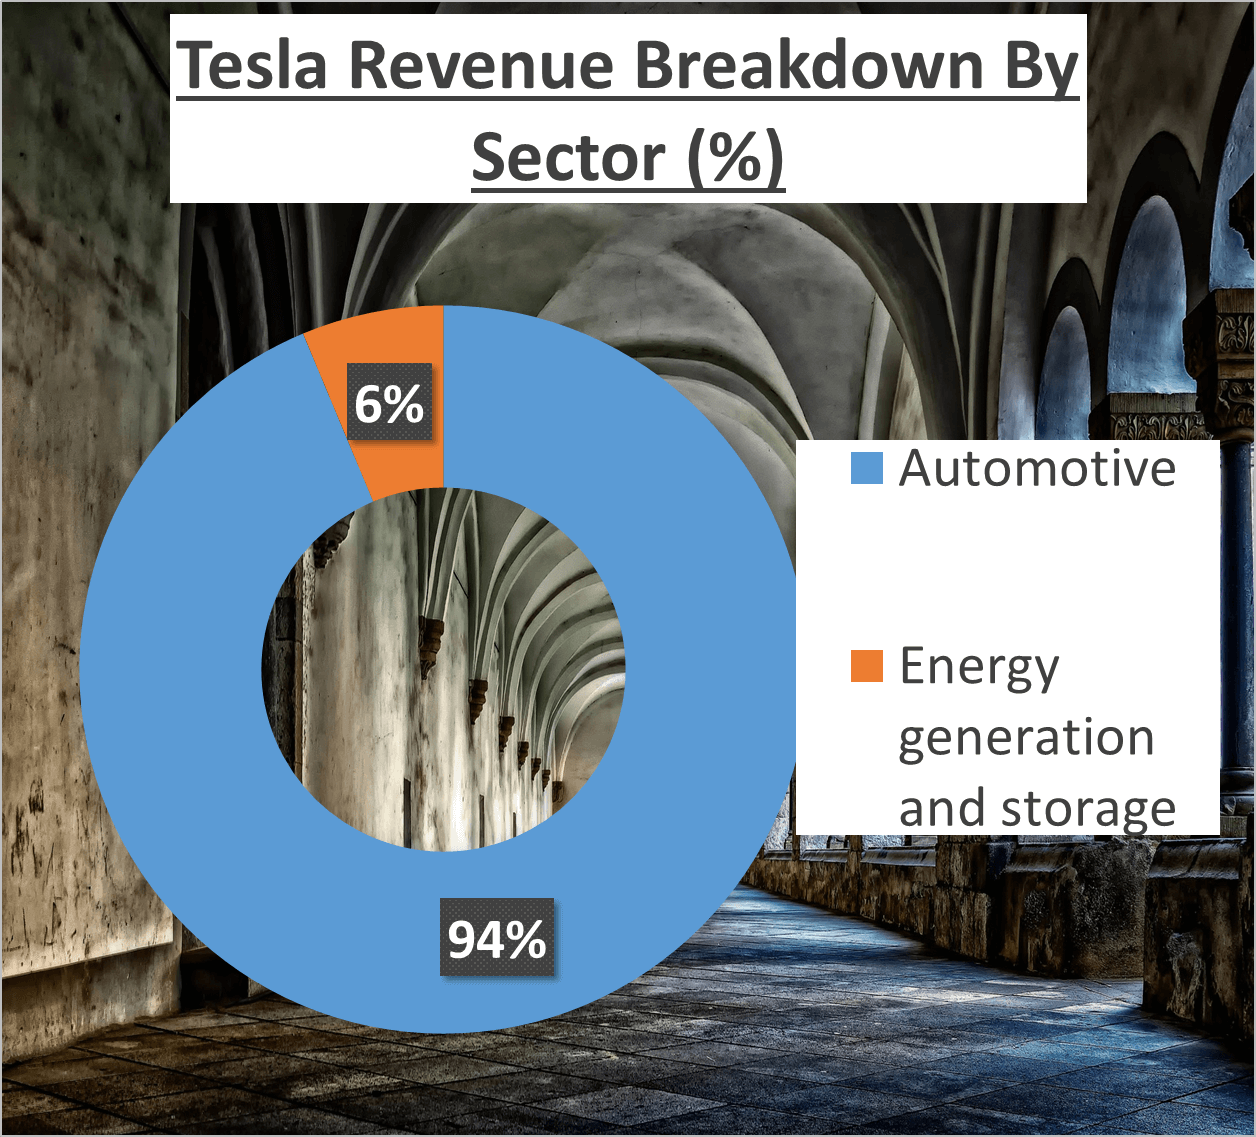
Understanding the revenue sources is crucial. A vast 94% of TESLA’s revenue stems from its automotive segment, while the remaining 6% is derived from energy generation and storage.
Geographically, the United States contributes 47% to TESLA’s revenue, with China and other regions making up 22% and 31%, respectively.
TESLA’s consistent revenue expansion underscores its market supremacy and rising popularity. The company’s ability to expand its customer base and increase car sales propels top-line growth. Additionally, its foray into energy generation and storage augments revenue, albeit on a smaller scale at present.
In essence, TESLA’s revenue narrative epitomizes steadfast and remarkable growth. Leveraging its brand, technology, and product portfolio, TESLA continues to achieve higher revenue figures year after year. This trajectory augurs well for its future, as revenue growth is pivotal for business success and shareholder value.
TESLA Stock Analysis: Profitability and Cost Strategies
Analyzing a company’s profit margins provides valuable insights into its business model and competitive environment.
Delving into Tesla’s financials, we find that in 2023, the Gross Profit Margin stood at 18%. While this figure may seem commendable, it represents a slight decline compared to the five-year average of 21%.
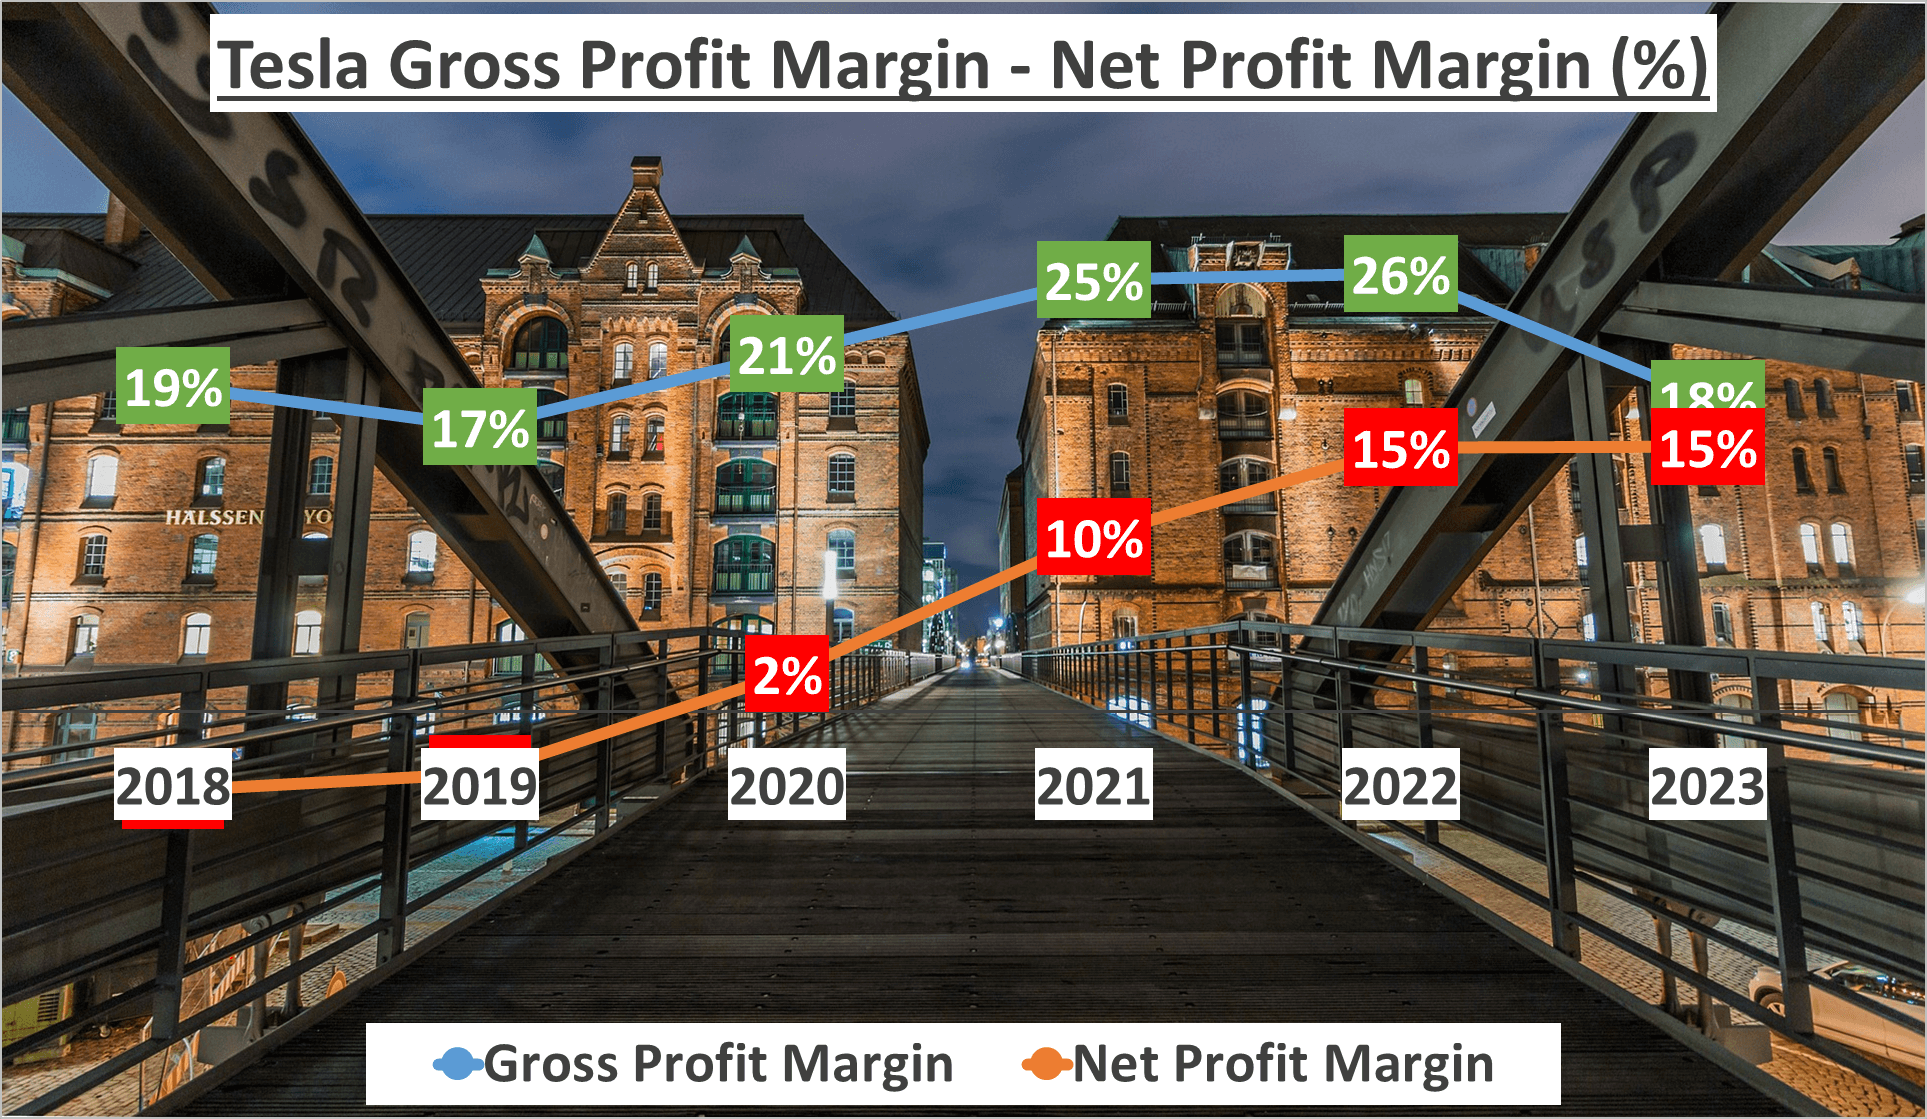
What does this suggest? It hints at the possibility of intensified competition in the electric vehicle industry or the onset of market saturation. In such scenarios, companies may face pressure to lower prices or increase spending to retain market share, thereby impacting profit margins negatively.
However, let’s not jump to conclusions hastily. It’s crucial to also consider the Net Profit Margin, which reflects the proportion of revenue converted into profit. In 2023, Tesla’s Net Profit Margin reached 15%, marking a significant increase from the five-year average of 6%. This divergence is intriguing. Despite the dip in Gross Profit Margin, the surge in Net Profit Margin indicates Tesla’s adept management of costs.
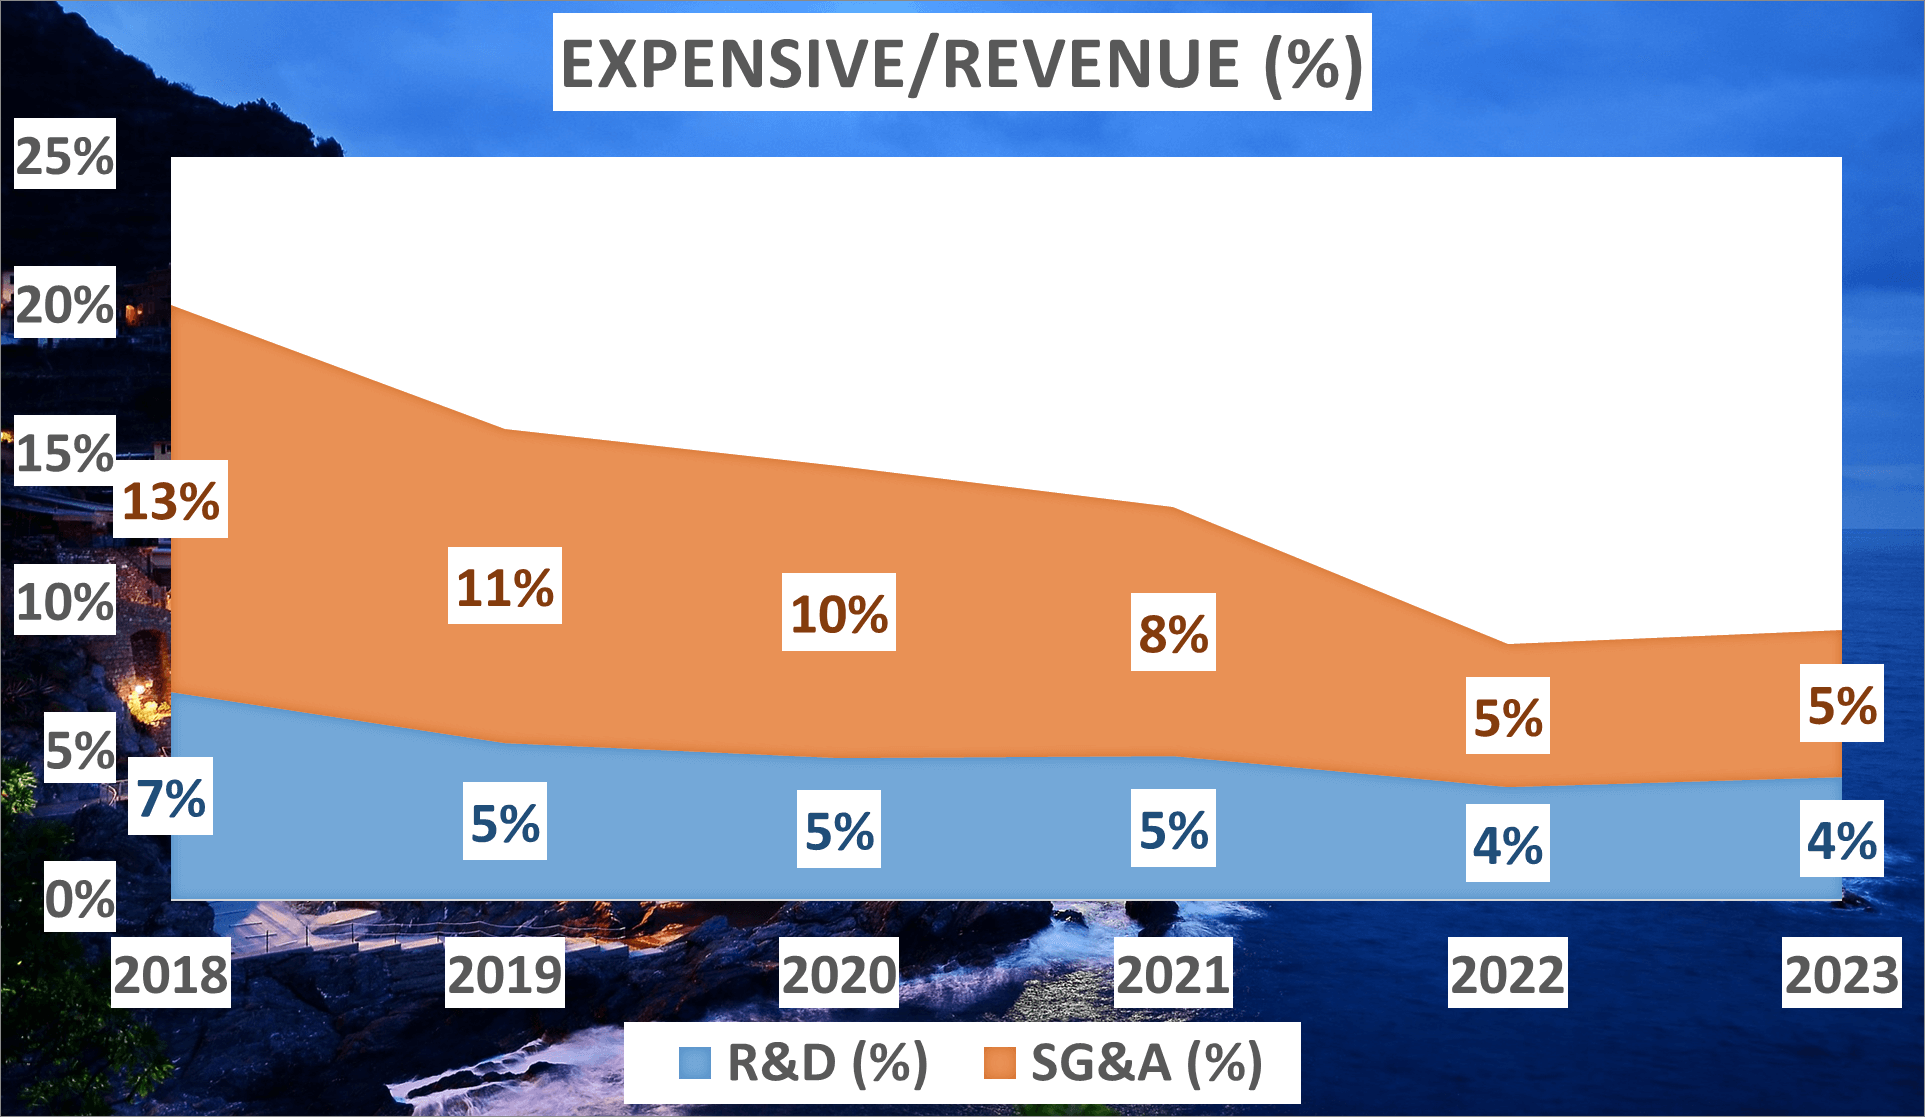
How is this achieved? Tesla likely employs efficient cost-cutting strategies, such as trimming research and development expenses or streamlining general and administrative costs. This strategic approach to cost management enables Tesla to bolster its Net Profit Margin, even amidst heightened competition or market saturation.
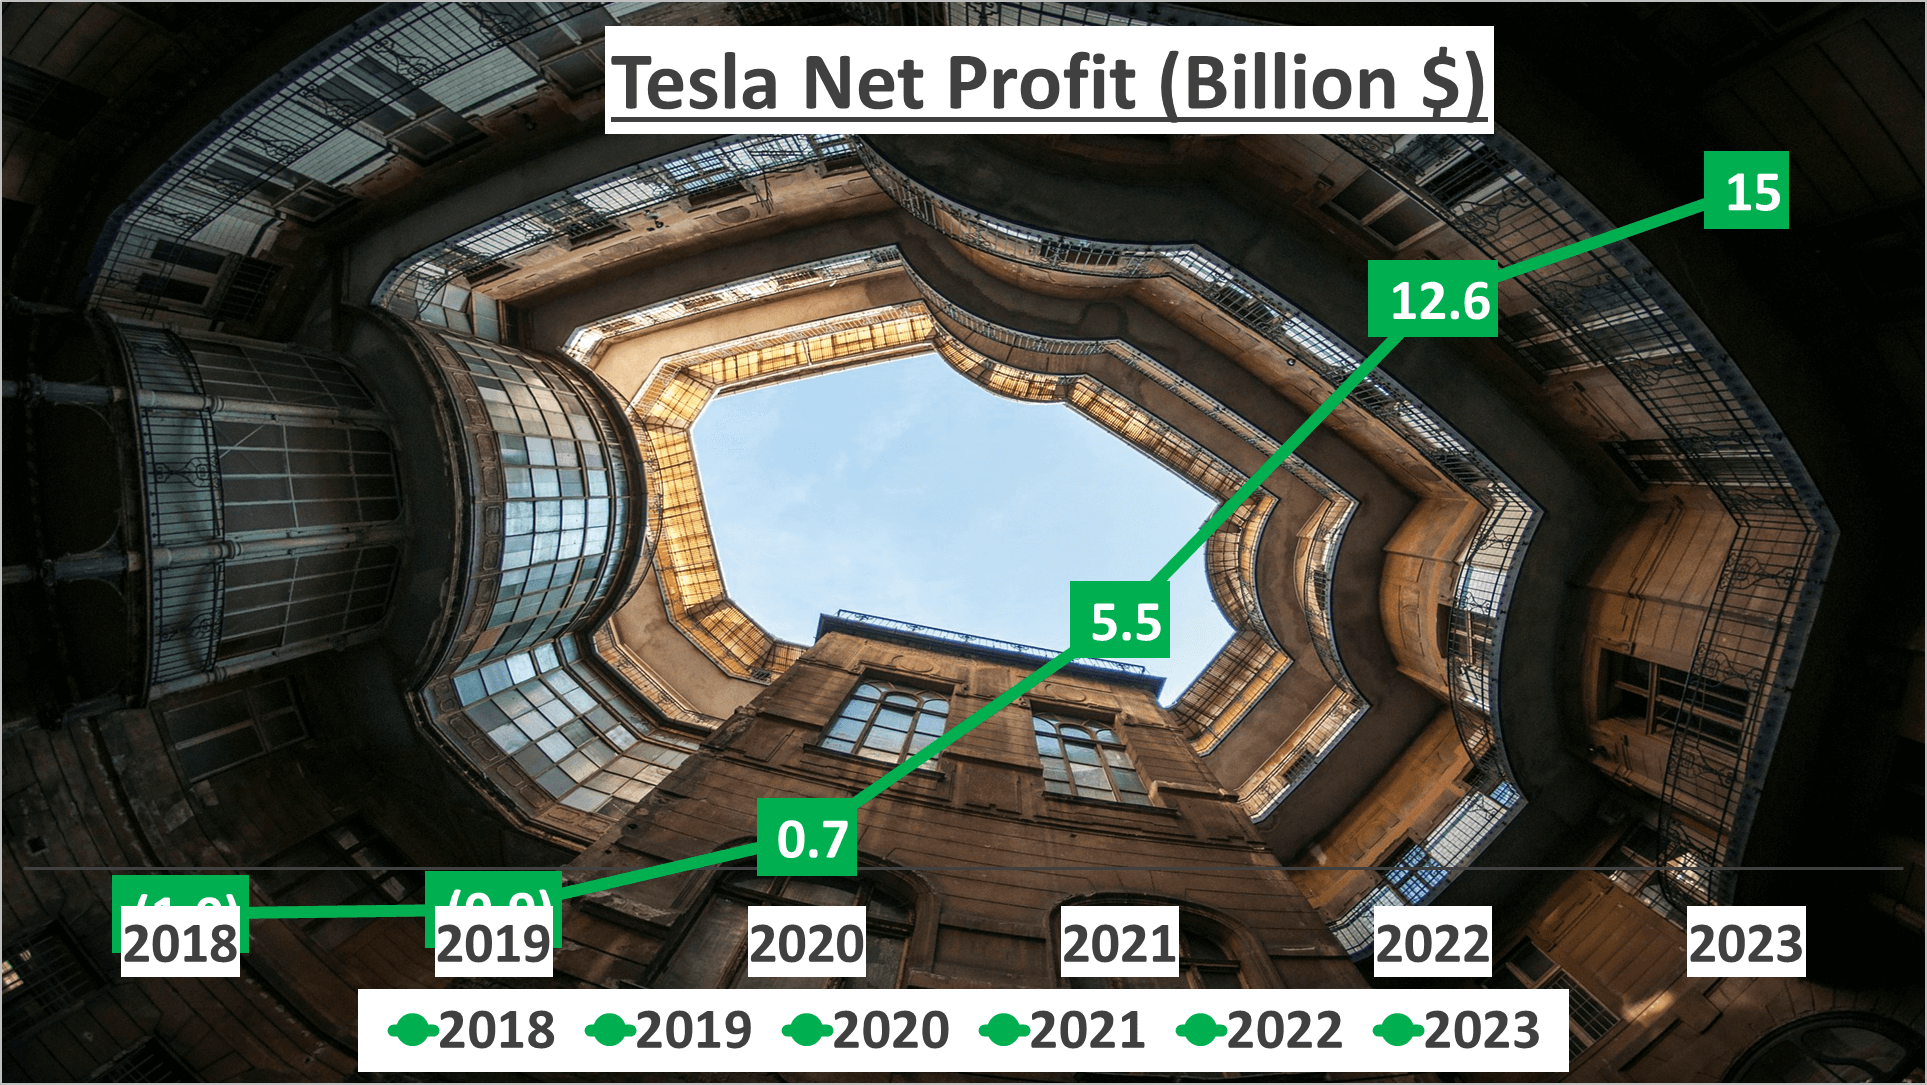
In summary, while Tesla may have experienced a marginal decline in Gross Profit Margin, the notable rise in Net Profit Margin underscores the company’s resilience and prosperity in a competitive landscape. It showcases Tesla’s ability to strategically navigate costs and enhance profitability. Despite market challenges, Tesla’s profit margins and astute cost management exemplify its robust financial position.
TESLA Stock Analysis: Financial Strength and Cash Flow
A company’s financial well-being extends beyond mere profits; it hinges on how efficiently it handles its assets and cash flow.
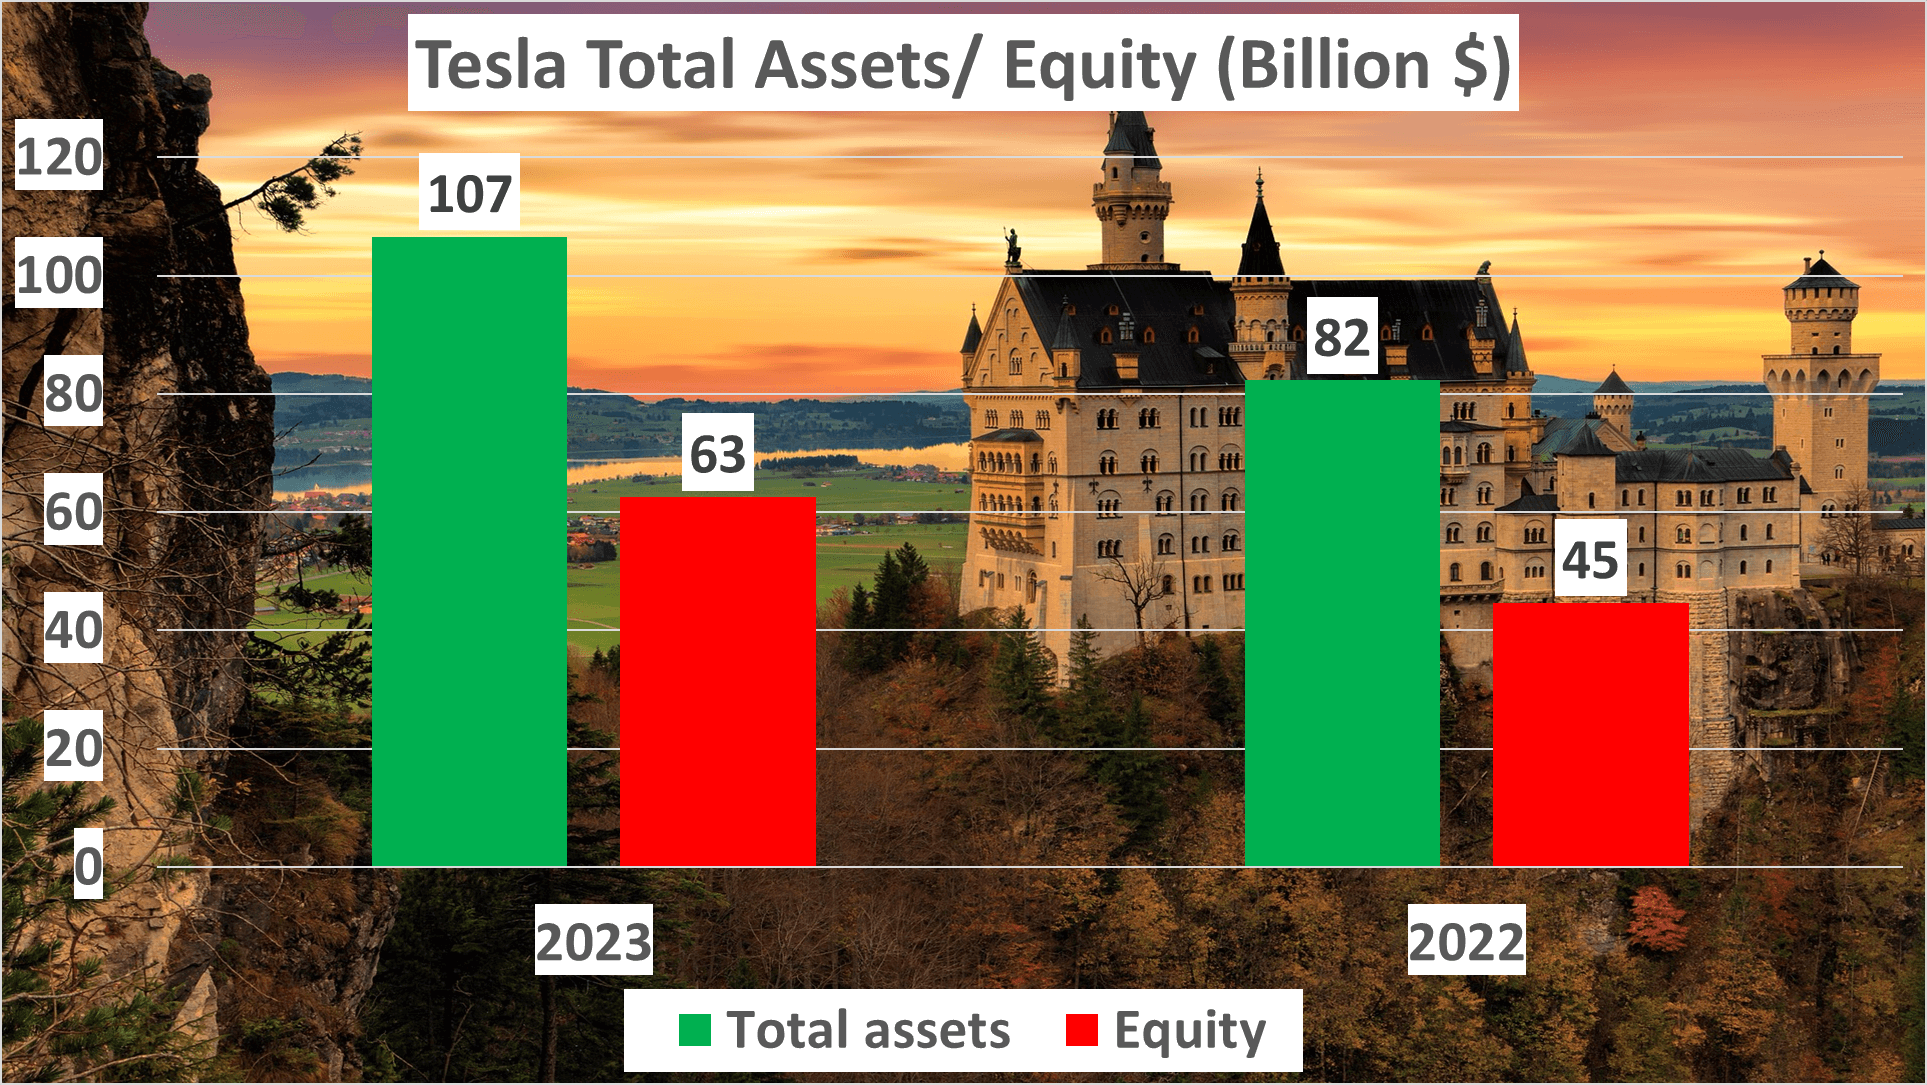
Let’s delve into Tesla’s financial standing in 2023. Tesla’s total assets reached an impressive $107B, a significant surge from $82B in the preceding year. Its net assets remained robust at $63B, up from $45B in 2022.
Now, let’s scrutinize some key financial indicators. Tesla’s Current Ratio, which gauges its ability to settle short-term obligations with short-term assets, stood at 1.73 in 2023, climbing from 1.53 in 2022. This signifies Tesla’s strong short-term financial stability.
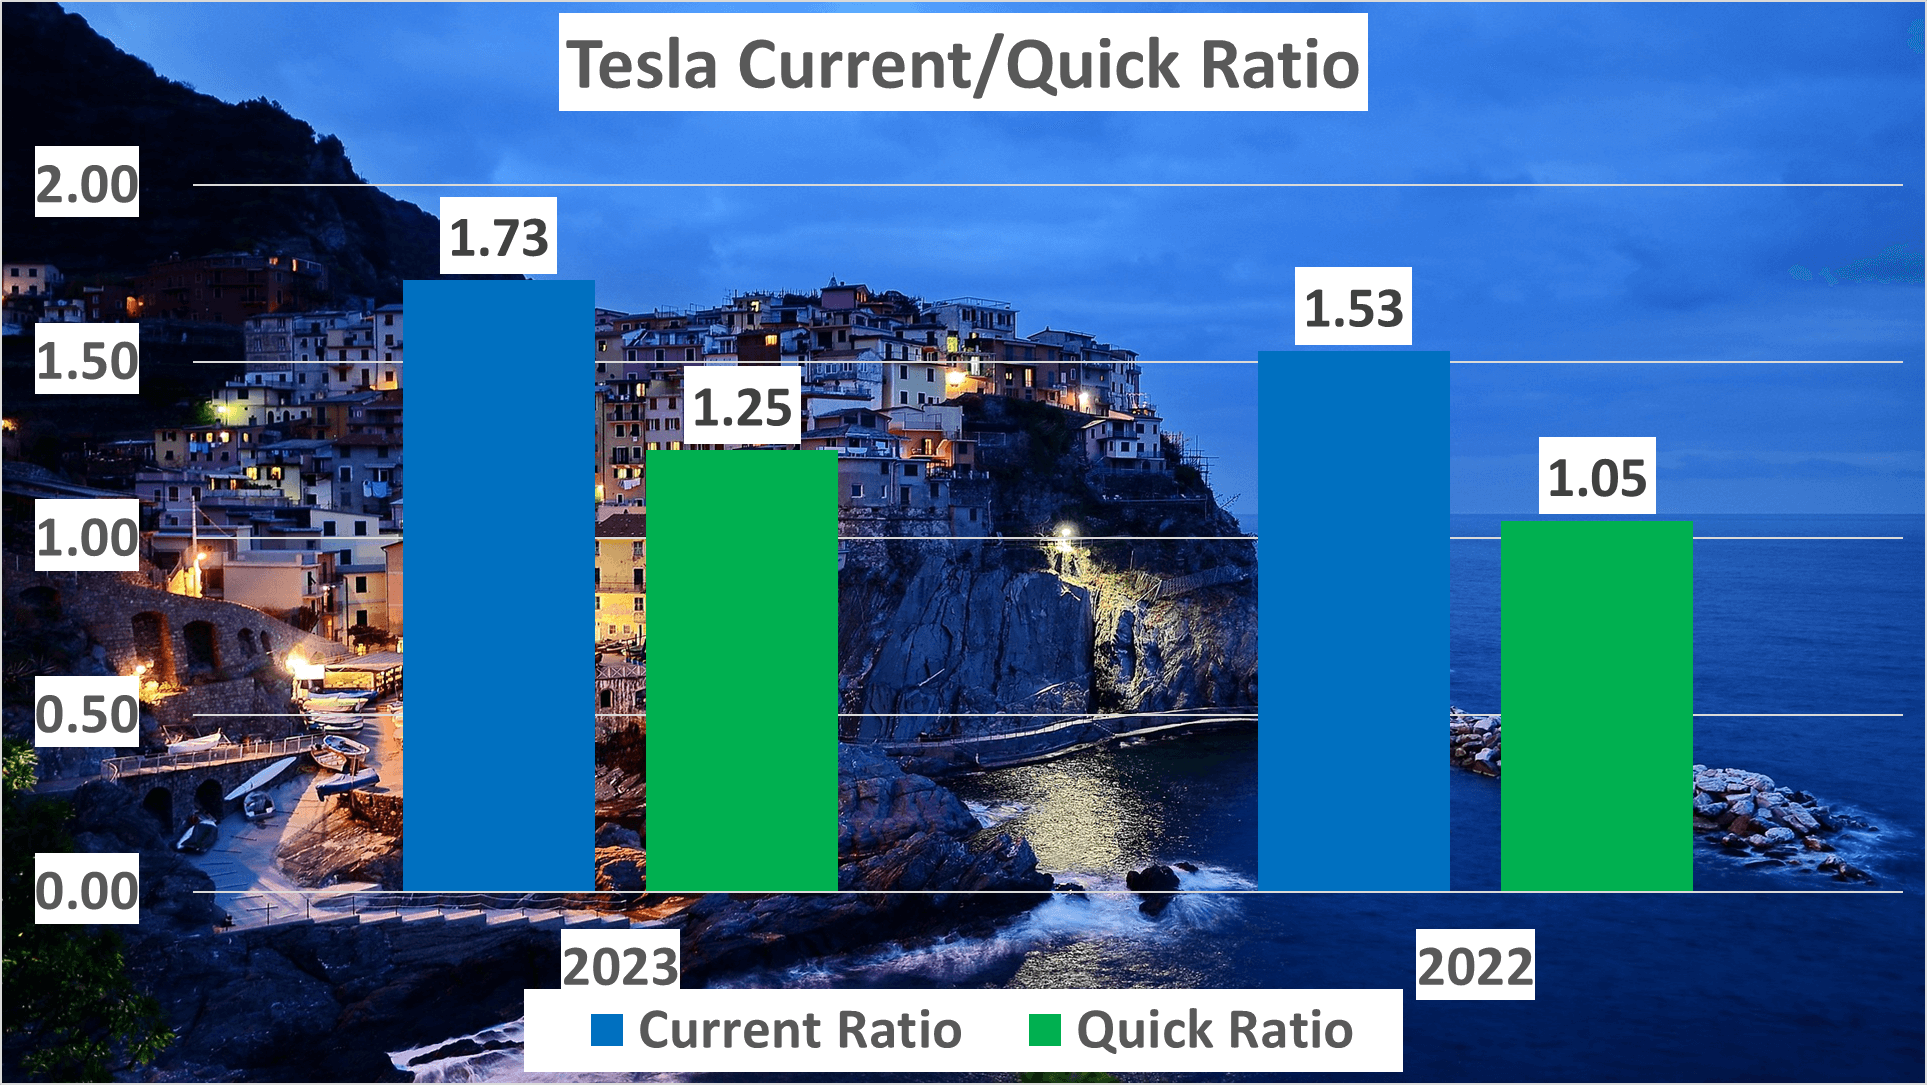
Similarly, the Quick Ratio, a stricter measure of liquidity excluding inventory, increased to 1.25 in 2023 from 1.05 in the prior year. This suggests Tesla’s capability to comfortably fulfill short-term liabilities, even during exigencies.
But what about cash flow? Cash flow is the lifeblood of any enterprise. In 2023, Tesla’s Operating Cash Flow, derived from core business operations, stood at a robust $13.3B, indicating strong operational efficiency and profitability.
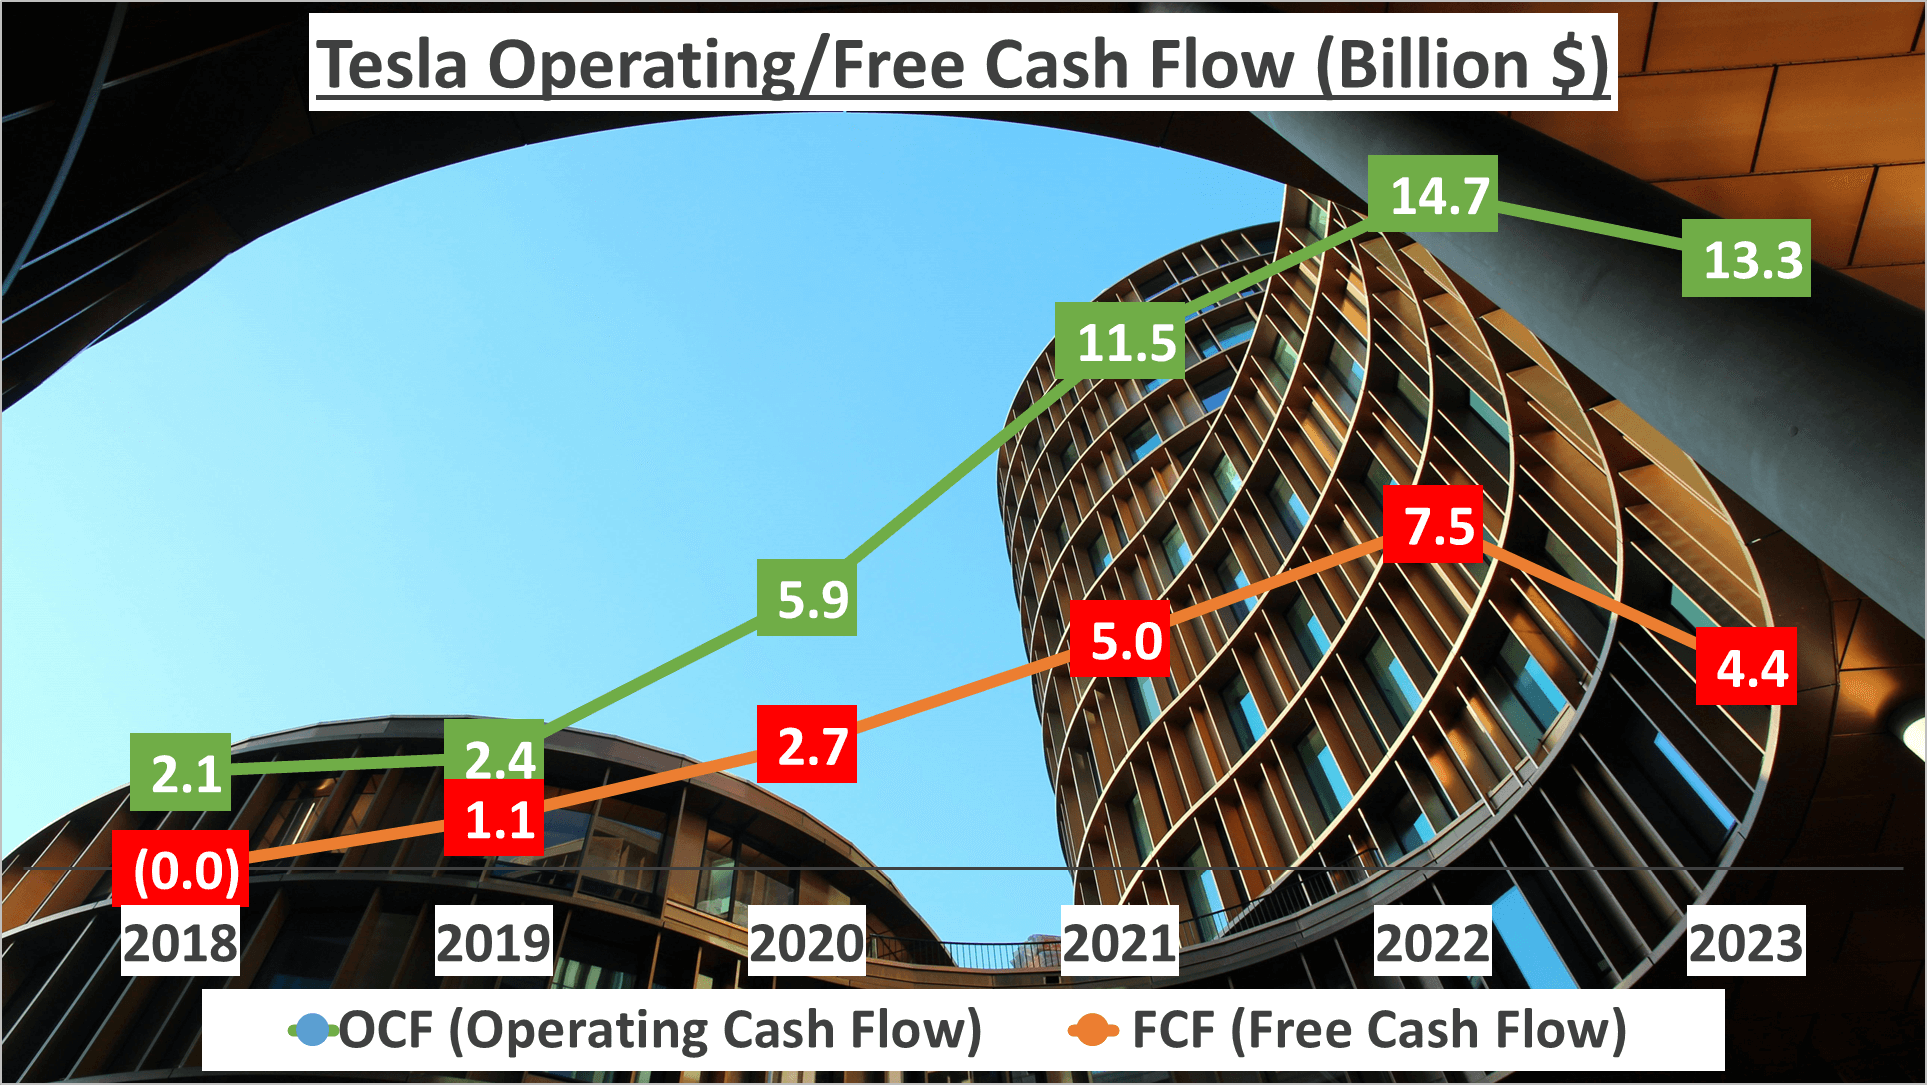
Furthermore, Tesla’s Free Cash Flow, representing cash available after deducting capital expenditures, totaled a healthy $4.4B. This signals Tesla’s capacity to pursue value-enhancing opportunities.
So, what’s the takeaway? Tesla’s robust financial health and vigorous cash flow underscore its resilience and investment potential. It demonstrates that Tesla not only turns profits but also adeptly manages its assets and cash, positioning it as a potentially lucrative investment opportunity.
Tesla’s sturdy financial foundation and formidable cash flow highlight its resilience and promise for investors.
TESLA Stock Analysis: DuPont Analysis and Conclusion
Delving deeper into Tesla’s financials through DuPont analysis yields deeper insights into its financial performance. The DuPont formula dissects Return on Equity (ROE) into three components – Net Profit Margin, Asset Turnover, and Equity Multiplier – offering a comprehensive view of a company’s financial health.
In 2023, Tesla’s ROE stood at 24%. This metric gauges how efficiently management utilizes a company’s assets to generate profits, calculated by dividing net income by shareholders’ equity.
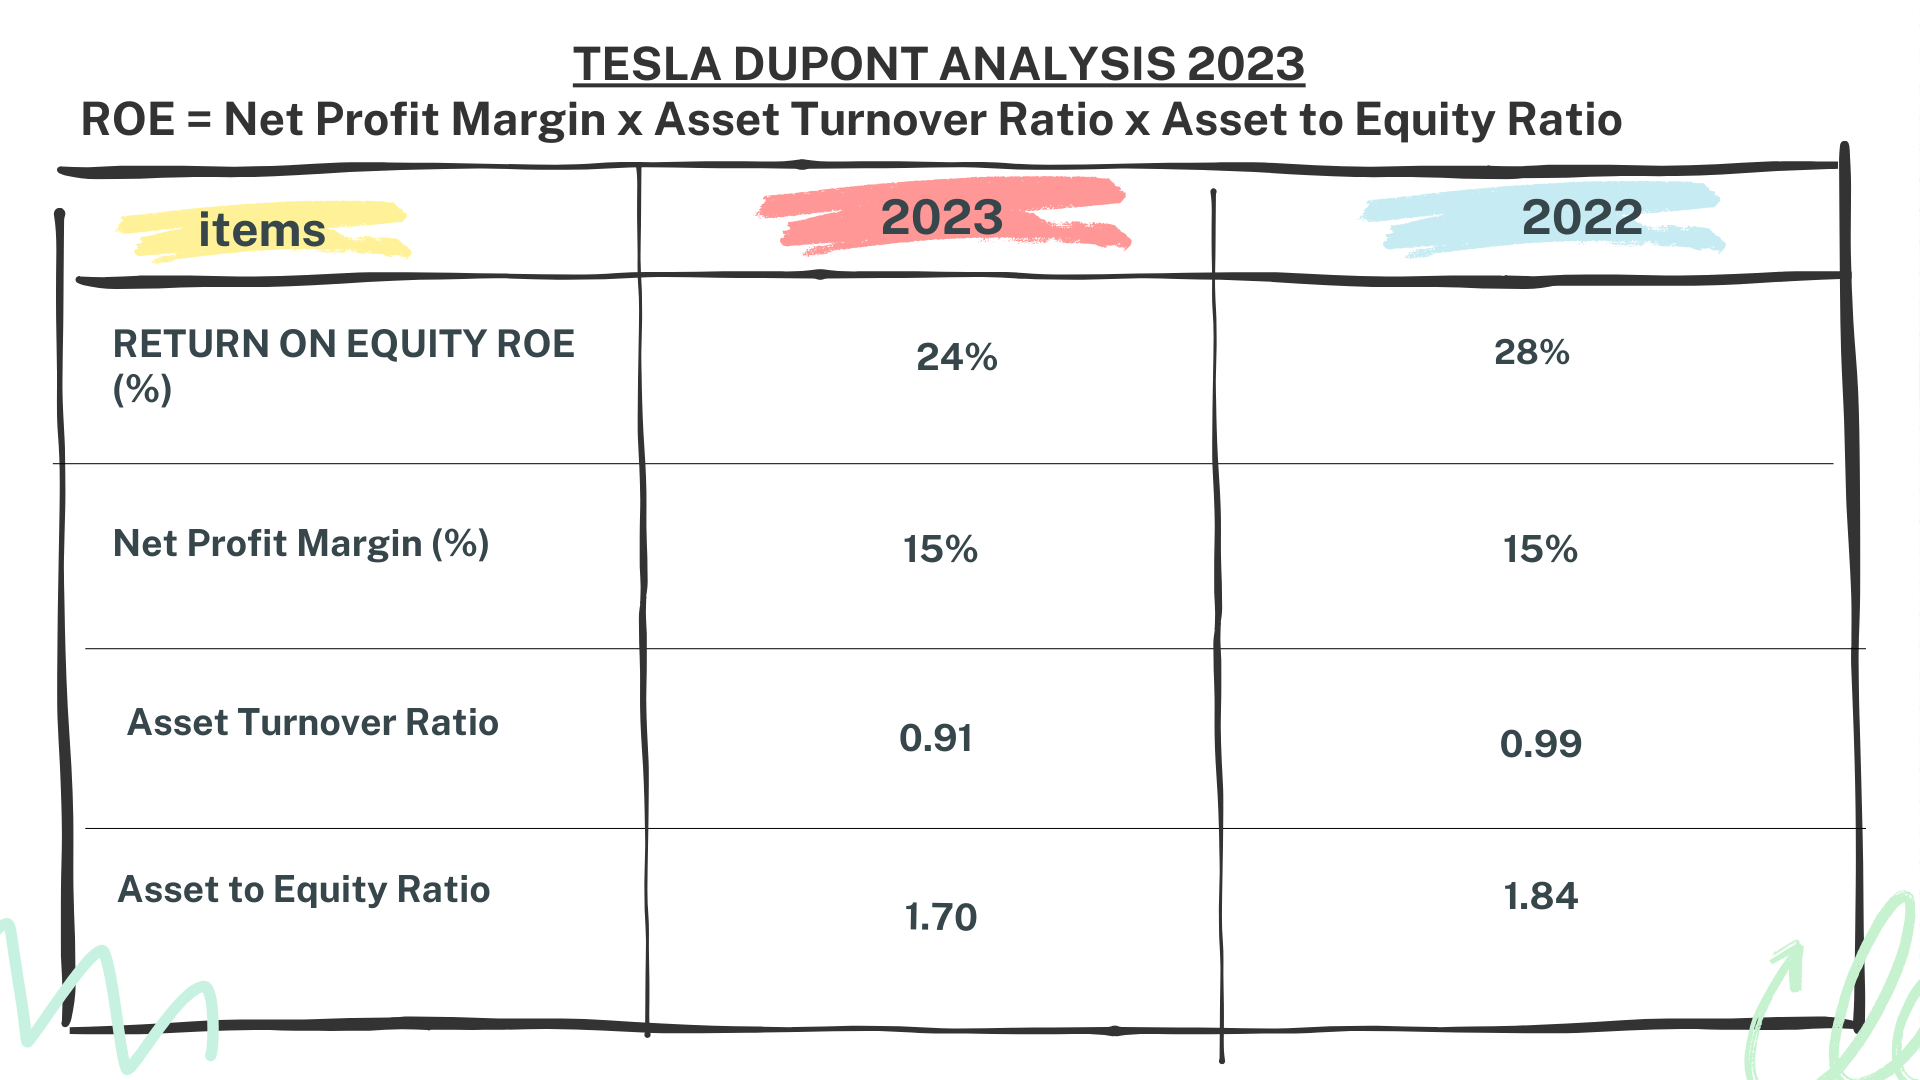
The first component, Net Profit Margin, was 15% for Tesla in 2023, indicating the company’s profitability after deducting all expenses from revenue.
The second component, Asset Turnover, was 0.91, reflecting Tesla’s efficiency in utilizing its assets to drive sales. A higher Asset Turnover ratio signals effective asset management.
The final component, the Equity Multiplier, was 1.7, measuring Tesla’s financial leverage. A higher ratio implies that a company relies more on debt financing than equity.
Comparatively, in 2022, Tesla had an ROE of 28%, a Net Profit Margin of 15%, an Asset Turnover of 0.99, and an Equity Multiplier of 1.84. While Tesla’s ROE and Asset Turnover witnessed slight declines, the Net Profit Margin remained steady, and the Equity Multiplier decreased, indicating reduced financial risk.
Tesla’s financial analysis portrays a robust, resilient, and high-potential entity. Its remarkable stock growth over the years underscores its solid business model and financial prowess.
Author: investforcus.com
Follow us on Youtube: The Investors Community



I do not even know the way I finished up right here, however I believed this submit was once good. I do not realize who you might be however definitely you’re going to a famous blogger if you are not already 😉 Cheers!
Thanks for your help and for writing this post. It’s been great.