Introduction and Overview – ExxonMobil vs Chevron Stock Analysis: Ever wondered how ExxonMobil and Chevron stack up against each other in financial performance? You’re not alone.
These two titans of the oil and gas industry have dominated America’s energy sector for decades, influencing both our economy and our daily lives.
For potential investors or those simply curious, understanding the financial intricacies of these companies can yield valuable insights.
That’s where this analysis comes into play.
We’ll dissect the financial performance of ExxonMobil and Chevron, comparing their revenues, profits, assets, and more, all to provide you with a clearer understanding of these oil and gas giants.
We’ll delve into their total revenues, revenue structures, operational efficiency, and cash flow, presenting the information in an accessible manner suitable for all backgrounds.
So, let’s dive into the numbers and uncover where these two oil giants stand.
Total Revenues and Revenue Structure – ExxonMobil vs Chevron Stock Analysis
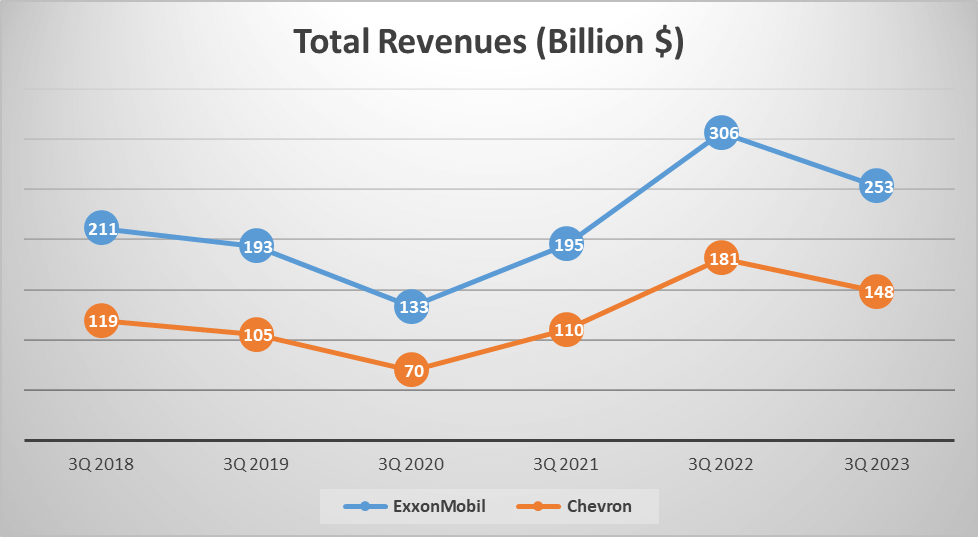
First, let’s examine the total revenues of both companies. As of the third quarter of 2023, ExxonMobil’s total revenue stands at a substantial $253 billion, while Chevron trails behind at $148 billion. If we look back to the same quarter five years ago, in 2018, ExxonMobil had revenues of $211 billion, resulting in a five-year compound annual growth rate (CAGR) of 3.7%. On the other hand, Chevron had revenues of $119 billion, with a slightly higher five-year CAGR of 4.5%.
Now, let’s delve into the revenue structure of both companies. ExxonMobil’s revenue comes from various sources, with the predominant 80% originating from energy products. This is followed by 8% from upstream operations, 7% from chemical products, and the remaining 6% from specialty products. This diversified revenue stream enables ExxonMobil to maintain stability in its financial performance.
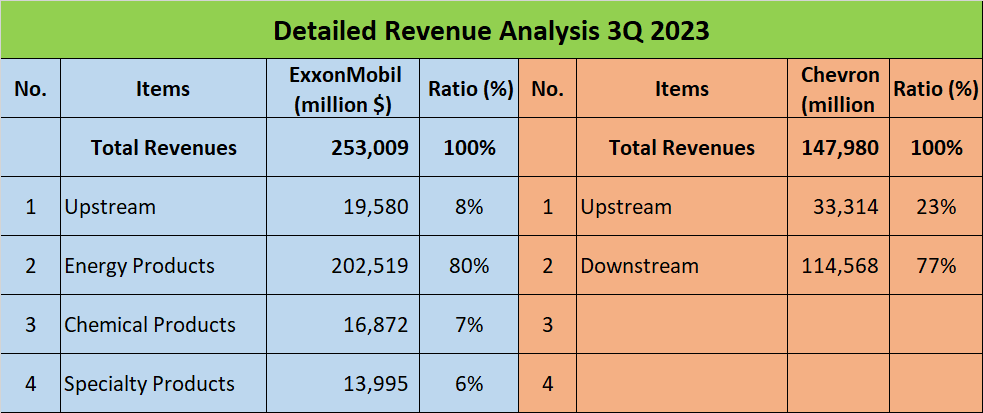
In contrast, Chevron’s revenue structure is somewhat simpler. 23% comes from upstream activities, involving exploration, drilling, and extraction of crude oil, natural gas, and secondary products. The majority, at a significant 77%, comes from downstream activities, encompassing the processing and refining of oil and gas resources into various chemical and energy products such as gasoline, diesel, mazut oil, plastics, polyethylene, and various chemical additives.
As we compare these two industry giants, it’s evident that ExxonMobil boasts a more diversified revenue structure compared to Chevron. This diversity could potentially offer ExxonMobil a greater buffer against fluctuations in any single sector. However, Chevron’s heavy reliance on downstream activities may prove advantageous during periods of high demand for refined products.
Profit and Profit Margins – ExxonMobil vs Chevron Stock Analysis
Let’s delve into the profits of these two industry giants.
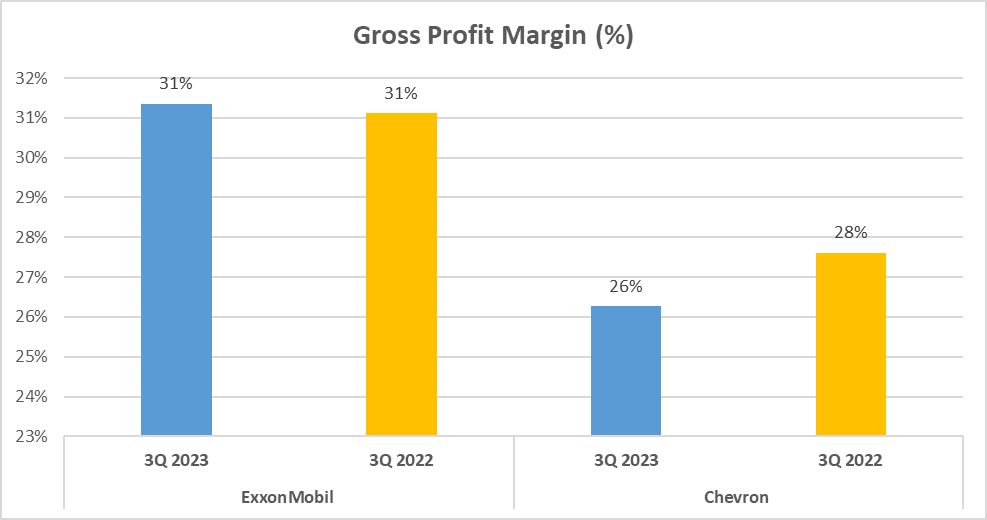
ExxonMobil and Chevron, leaders in the oil and gas sector, boast intriguing gross profit margins. ExxonMobil, with its diversified revenue structure, enjoys a gross profit margin of 31%. This signifies that for every dollar ExxonMobil earns in sales, $0.31 is gross profit. In contrast, Chevron, with its more streamlined revenue structure, maintains a slightly lower gross profit margin of 26%.
Moving forward, let’s explore the net profits of these corporations. ExxonMobil reports a net profit of $28 billion, growing at a compound annual growth rate (CAGR) of 14% over the past five years. This indicates a consistent upward trend in ExxonMobil’s profitability.
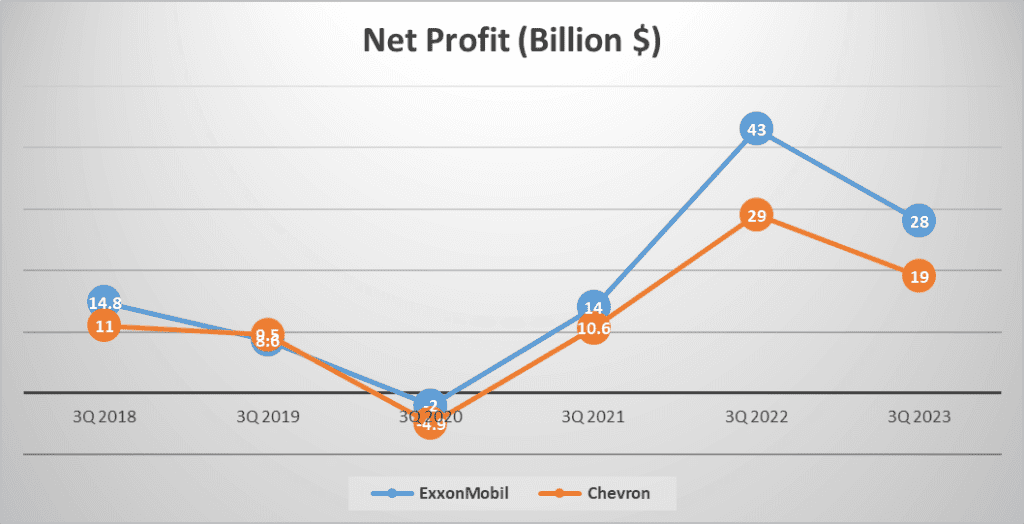
On the other hand, Chevron’s net profit stands at $19 billion, with a five-year CAGR of 12%. Despite Chevron’s lower net profit compared to ExxonMobil, its growth rate is only slightly behind.
However, net profit alone doesn’t provide a comprehensive view. To gain a clearer understanding of profitability, we must consider net profit margins. The net profit margin is a crucial metric, indicating how much of each revenue dollar translates into profit.
ExxonMobil’s net profit margin is 11%, signifying that $0.11 of every revenue dollar is net profit. In contrast, Chevron boasts a higher net profit margin of 13%, indicating that $0.13 of every revenue dollar is net profit.
This disparity between gross and net profit margins underscores the impact of operational efficiency, cost control, and other factors on the bottom line.
Total Assets, Equity – ExxonMobil vs Chevron Stock Analysis
Moving forward, let’s examine the total assets, equity, and financial ratios of both corporations.
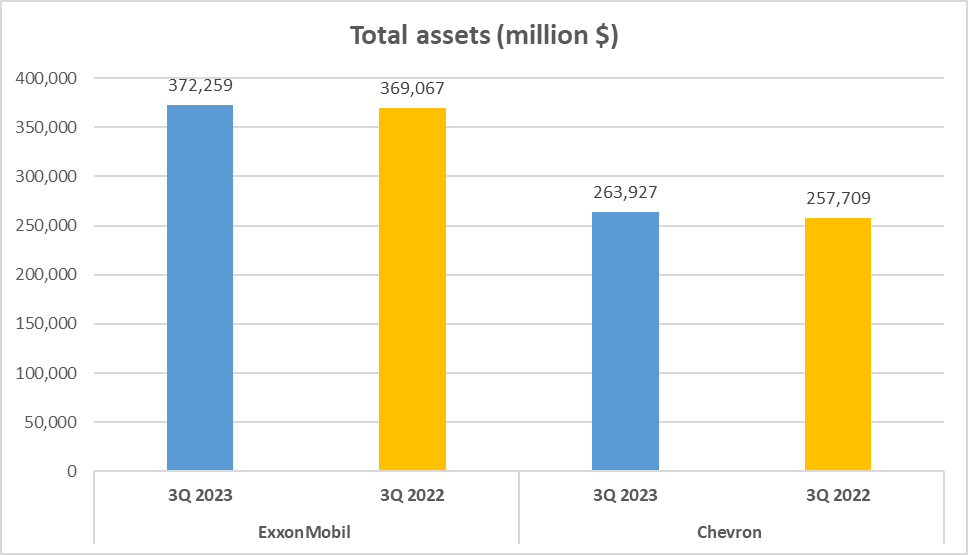
Let’s begin with total assets. ExxonMobil’s total assets amount to a staggering $372 billion, reflecting the scale of their operations. On the contrary, Chevron possesses total assets totaling $264 billion. Although not on par with ExxonMobil’s, Chevron’s figure remains impressive.
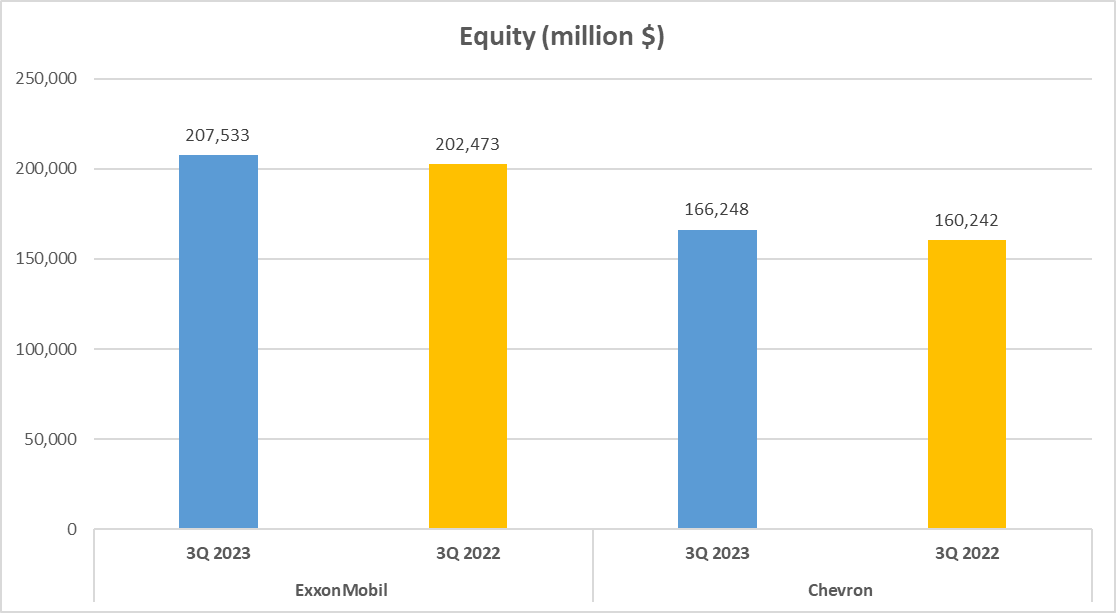
Transitioning to equity, ExxonMobil holds equity worth $208 billion, while Chevron’s equity stands at $166 billion. Equity holds paramount importance as it denotes the residual interest in the entity’s assets after subtracting liabilities. In simpler terms, it signifies what shareholders would receive if the company were to liquidate.
Now, let’s delve into the equity to total assets ratio. This ratio offers insights into a company’s financial structure and health. ExxonMobil’s equity to total assets ratio is 56%, indicating that more than half of its total assets are funded by shareholders. Conversely, Chevron boasts a higher ratio of 63%, signifying that nearly two-thirds of its total assets are financed by shareholders.
In conclusion, while ExxonMobil may have a higher gross profit margin, Chevron outperforms with a superior net profit margin. This emphasizes the importance of considering various financial metrics to analyze a company’s profitability thoroughly. Understanding the intricacies of profit margins provides valuable insights into a company’s operational efficiency and cost management strategies.
Financial Ratios – ExxonMobil vs Chevron Stock Analysis
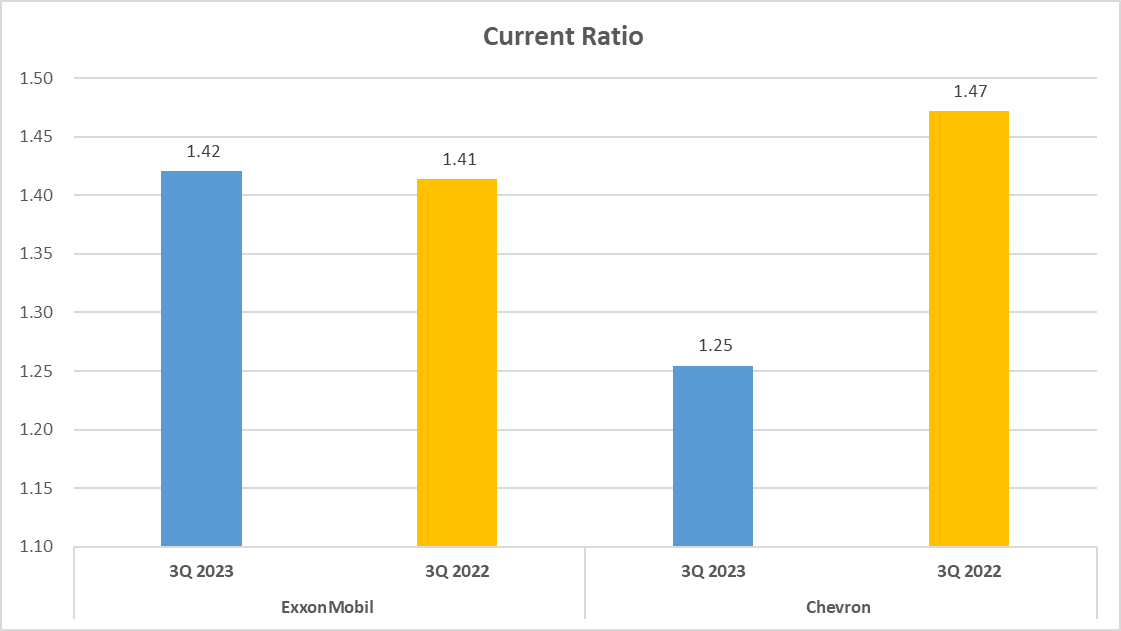
Now, let’s delve into some crucial financial ratios, commencing with the current ratio. This ratio gauges a company’s capacity to settle short-term debts. ExxonMobil’s current ratio stands at 1.42, whereas Chevron’s slightly trails at 1.25.
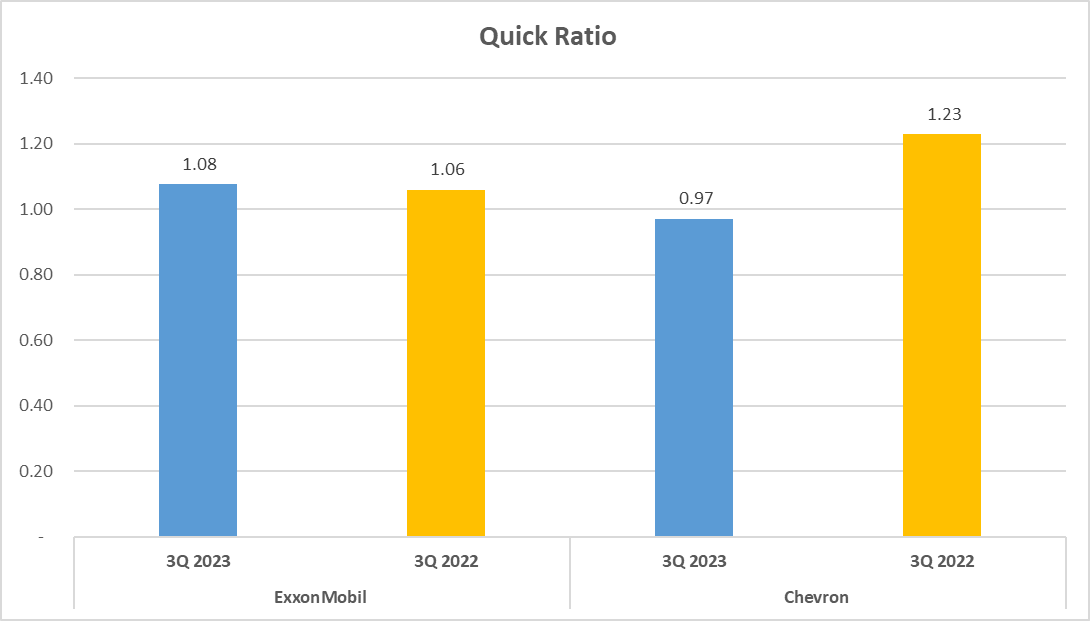
Moving on to the quick ratio, a more rigorous indicator of a company’s ability to cover immediate liabilities, ExxonMobil leads with 1.08, surpassing Chevron’s 0.97.
In summary, although Chevron boasts a more robust equity to total assets ratio, denoting a higher share of assets financed by shareholders, ExxonMobil demonstrates superior liquidity with elevated current and quick ratios. This implies ExxonMobil holds stronger short-term financial resilience to fulfill its obligations.
While Chevron displays a more robust equity to total assets ratio, ExxonMobil showcases superior liquidity.
Operational Efficiency – ExxonMobil vs Chevron Stock Analysis
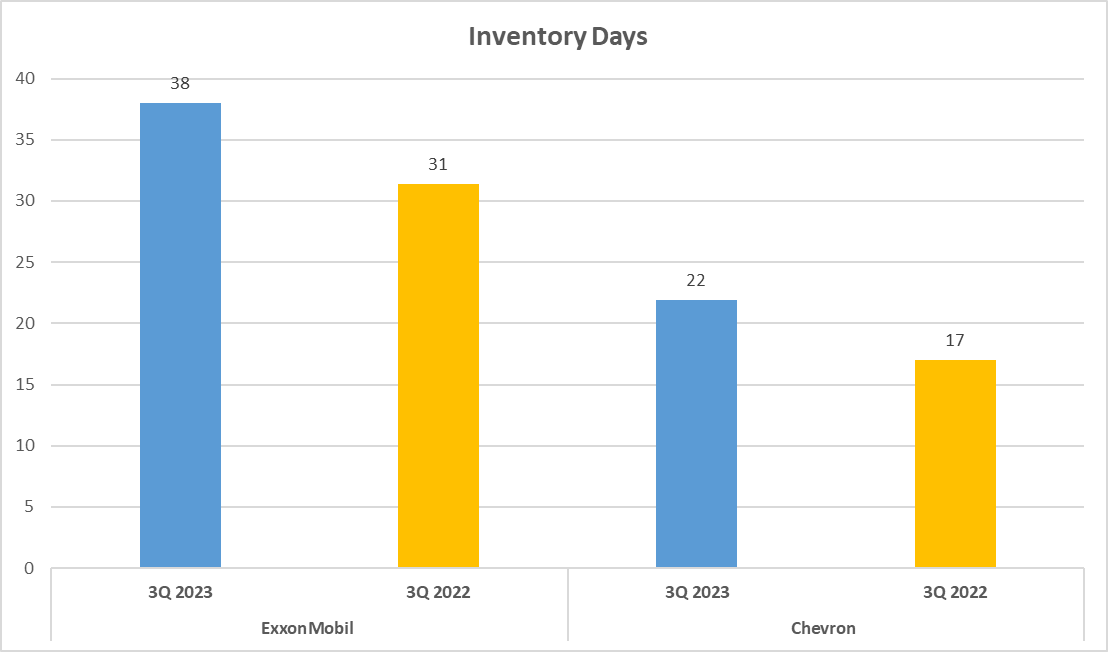
Next, we scrutinize the operational efficiency and cash flow of these two corporations. Let’s commence with operational efficiency, a metric assessing how efficiently a company utilizes its resources to generate revenue. One way to evaluate this is by examining inventory days and accounts receivable days. ExxonMobil’s inventory turnover stands at 38 days, signifying it takes approximately 38 days to sell its inventory. Conversely, Chevron operates a bit faster, selling its inventory within 22 days.
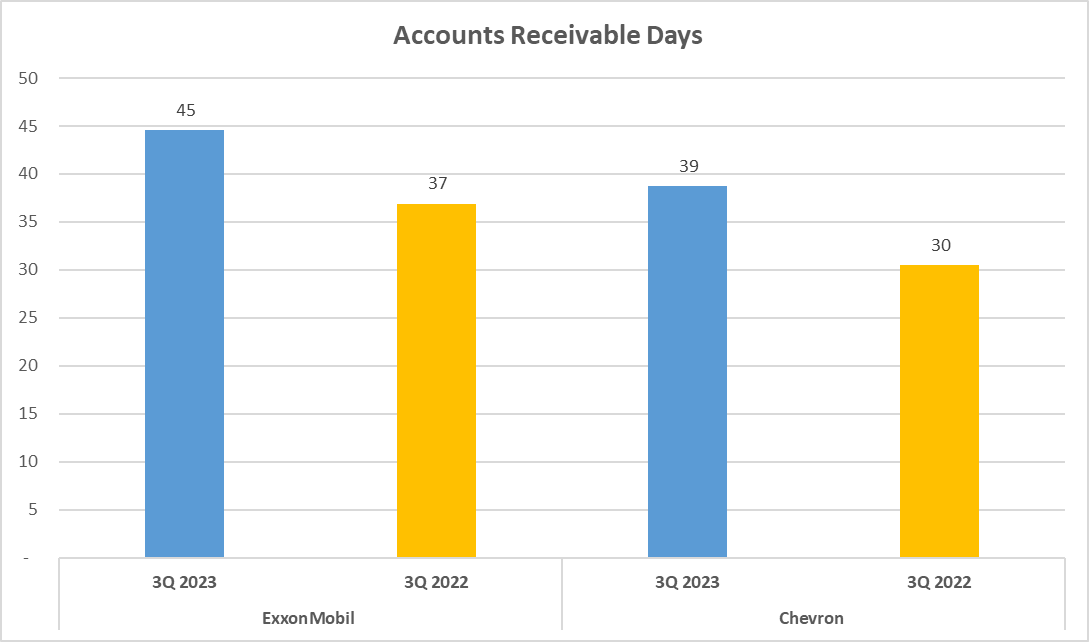
Regarding accounts receivable days, ExxonMobil requires 45 days to collect payment from its customers, whereas Chevron’s collection period is 39 days. This indicates ExxonMobil’s slower pace in collecting payments, potentially impacting its cash flow.
Moving on, let’s address total assets turnover, a measure illustrating how efficiently a company leverages its assets to generate sales. ExxonMobil’s total assets turnover is 0.91, while Chevron’s is 0.76. This suggests ExxonMobil is more effective in utilizing its assets to drive sales.
Cash Flow – ExxonMobil vs Chevron Stock Analysis
Transitioning to cash flow, let’s commence with operating cash flow, representing the cash generated from regular operating activities. ExxonMobil’s operating cash flow amounts to $42B, surpassing Chevron’s $23B. This signifies ExxonMobil generates nearly double the cash from operations.
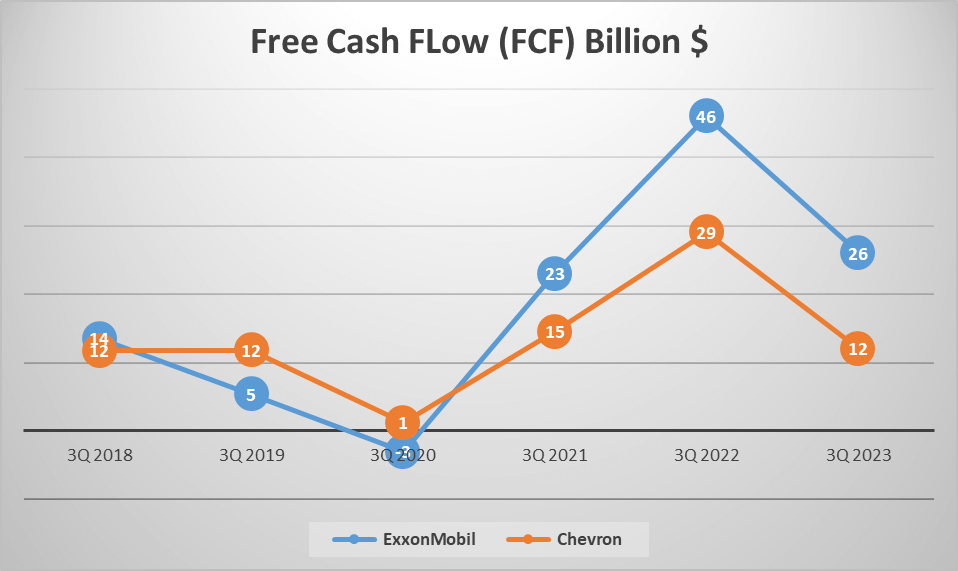
Next, we delve into free cash flow, reflecting the cash remaining after covering operating expenses and capital expenditures. ExxonMobil’s free cash flow reaches $26B, while Chevron’s stands at $12B. Once again, ExxonMobil takes the lead.
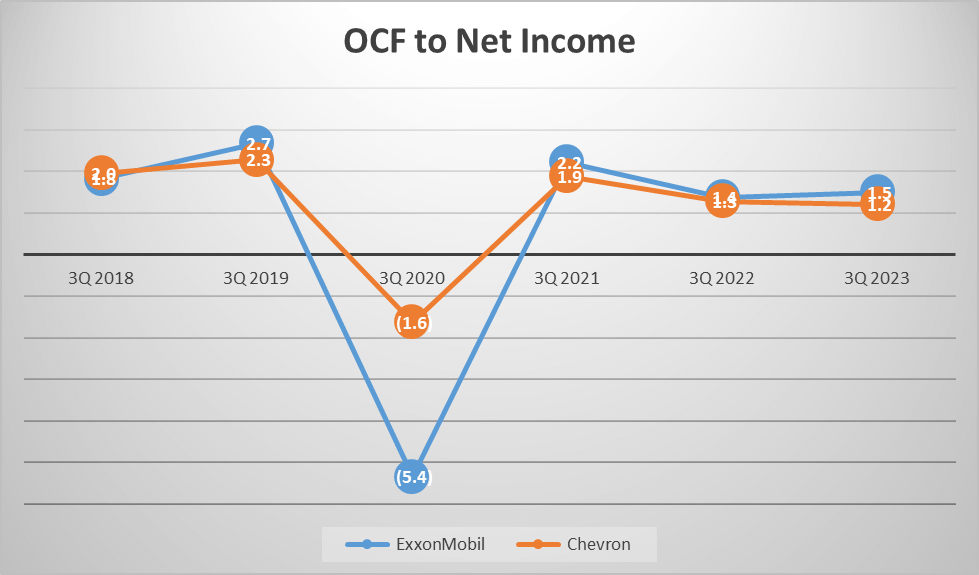
Lastly, we consider the operating cash flow to net income ratios. ExxonMobil’s ratio is 1.5, compared to Chevron’s 1.2, indicating ExxonMobil maintains a higher proportion of cash flow to net income.
In summary, while both companies exhibit strengths and weaknesses, ExxonMobil demonstrates superior operational efficiency, whereas Chevron boasts stronger cash flow.
Dupont Analysis and Conclusion – ExxonMobil vs Chevron Stock Analysis
Finally, let’s conduct a Dupont Analysis for ExxonMobil and Chevron. ExxonMobil’s return on equity (ROE) stands at 18% in Q3 2023, driven by a net profit margin of 11%, an asset turnover ratio of 0.91, and an asset-to-equity ratio of 1.79.
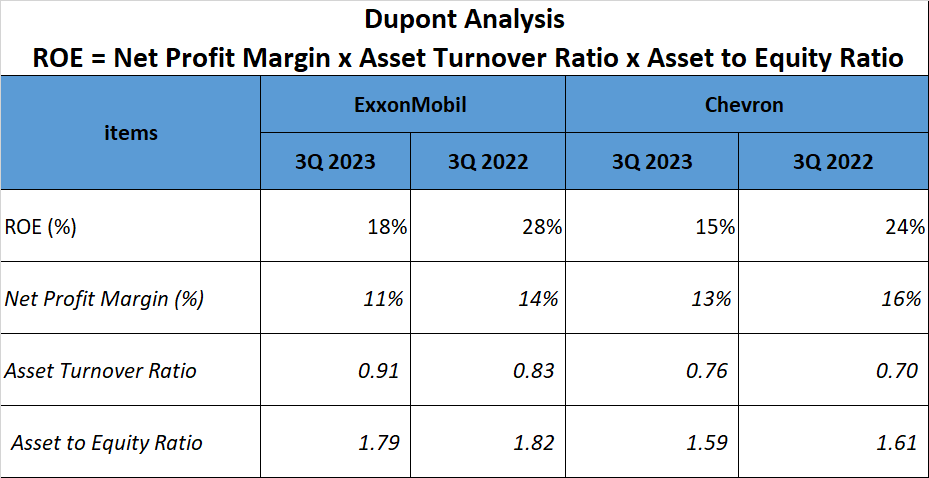
Chevron, conversely, boasts a 15% return on equity, with a more impressive net profit margin of 13%. Nonetheless, its asset turnover ratio is slightly lower at 0.76, and its asset-to-equity ratio is 1.59.
Upon analyzing these constituent factors, ExxonMobil appears to have a higher ROE, signifying better efficiency and profitability. However, Chevron’s superior net profit margin and robust cash flow should not be underestimated. As always, investment decisions should be based on thorough analysis and consideration. Thank you for watching. Please comment with the names of two companies you would like us to analyze next.
Watching more on Youtube:
Author: investforcus.com
Follow us on Youtube: The Investors Community

I enjoyed reading your piece and it provided me with a lot of value.