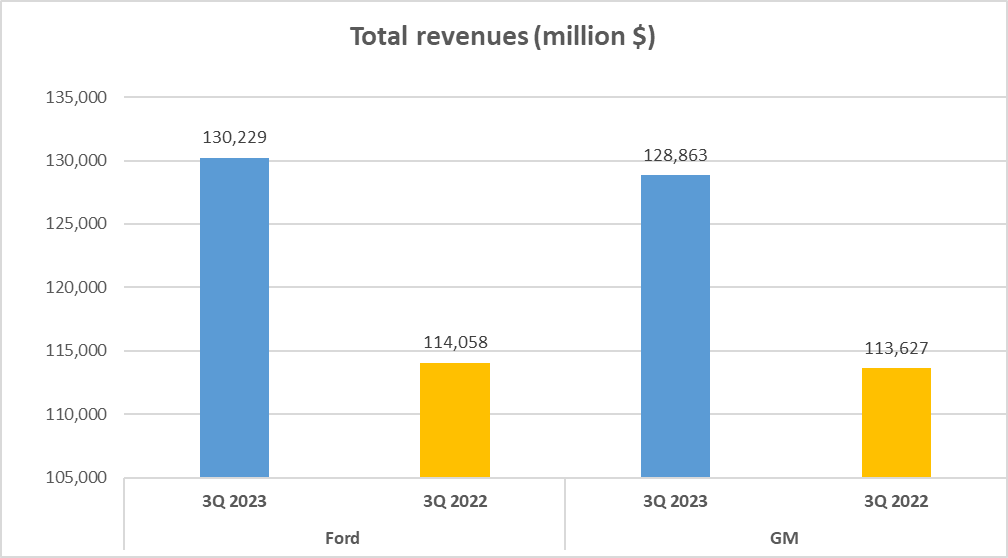
Ford vs GM Stock Analysis, two powerhouses in the automotive industry, have been neck and neck in their financial performance. With Ford’s total revenue for the last three quarters of 2023 standing at 130 billion dollars and GM hot on its heels with 129 billion dollars, it’s clear that the competition is fierce.
But let’s delve into the numbers a little more. Ford’s revenue structure is quite diverse, with 65% coming from Ford Blue, their traditional internal combustion engine vehicles. However, Ford is also making strides towards the future with Ford Model e, their electric vehicle division, contributing 3% to the total revenue. Ford Pro, their vans and trucks division, accounts for 27%, while Ford Credit, their financing arm, brings in the remaining 5%. Despite the electric vehicle division currently operating at a loss, Ford’s move towards sustainable energy is a clear indication of the company’s forward-thinking approach.
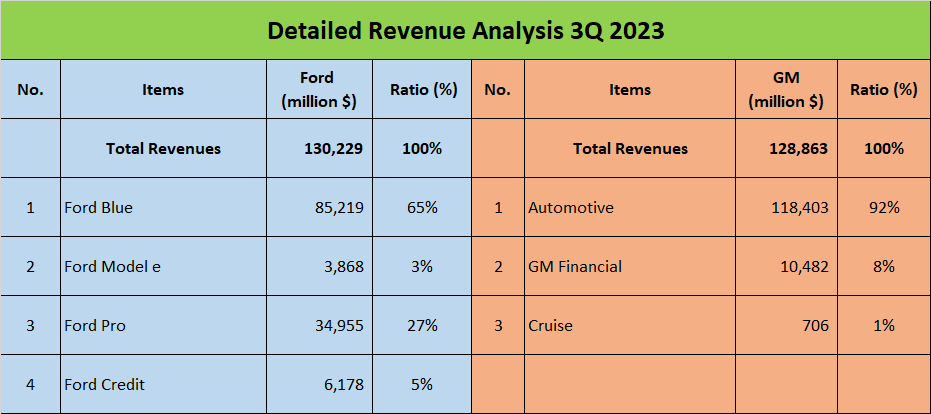
On the other hand, GM’s revenue structure is more streamlined, with a whopping 92% coming from its automotive division. The remaining 8% is generated by GM Financial, their financing division. This strategic approach of having a financial arm not only boosts their revenue but also promotes their vehicle sales, a clever tactic employed by most global automotive companies.
So, what can we glean from these numbers? Well, it’s clear that both companies have their strengths and unique approaches to generating revenue. Ford’s diversified revenue structure allows it to explore new markets and technologies, while GM’s focused approach enables it to maximize its core competency.
As we delve deeper into the financial health of these two giants, we see that there’s more to the story than just the revenue.
Profitability Analysis – Ford vs GM Stock Analysis
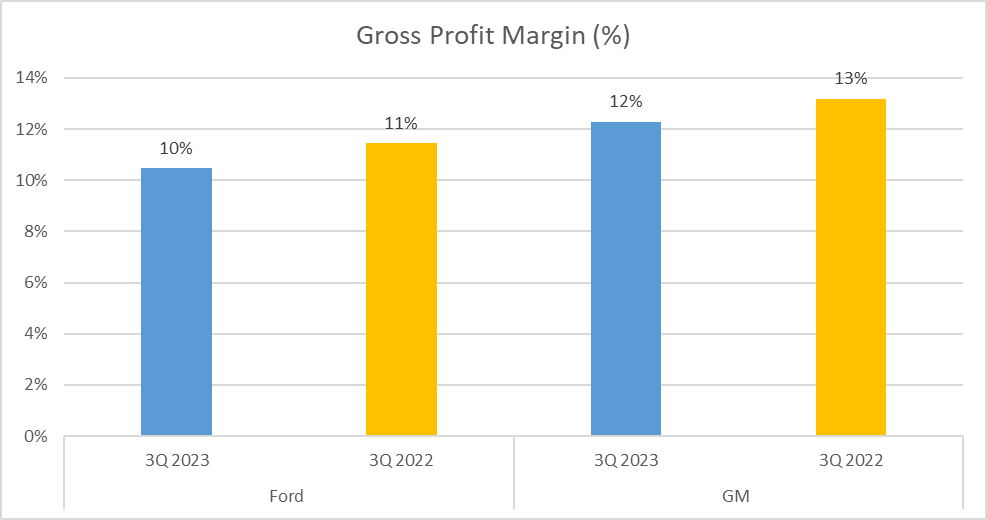
Profit, the ultimate indicator of a company’s financial health. Ford’s gross profit margin stands at 10%, while GM heads slightly ahead with 12%. This measurement reveals the portion of revenue left after accounting for the cost of goods sold. A higher gross profit margin indicates a more efficient production process.
But let’s not stop there. Net profit offers another layer to our analysis. This figure takes into account all business expenses, not just the cost of creating the product. Ford’s net profit for the year 2023 was 5 billion dollars, while GM outperformed with 8 billion dollars.
Yet, the raw profit numbers only tell part of the story. Enter the net profit margin; a key performance indicator that provides insight into a company’s efficiency in turning revenue into profit. Ford’s net profit margin stood at 4%, with GM once again pulling ahead with a 6% margin.
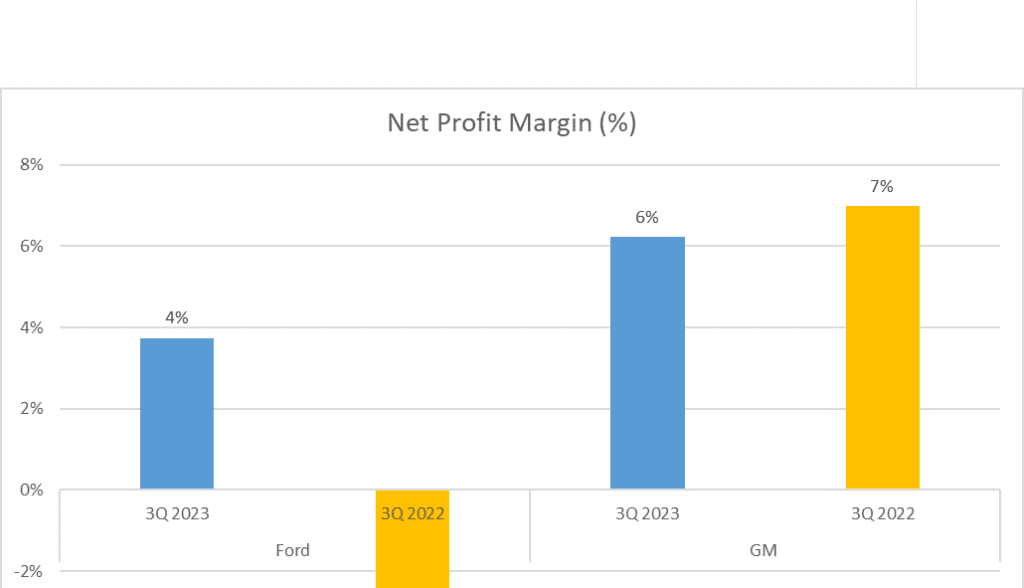
Why does this matter? Well, a higher net profit margin indicates a company’s ability to control its costs relative to its competitors. This efficiency can provide a competitive advantage in the marketplace, possibly leading to higher market share.
Now, it’s crucial to remember that profit isn’t the be-all and end-all of financial health. It’s a significant factor, no doubt, but there’s more to the story. It’s equally essential to understand how effectively a company uses its resources. This is where Return on Equity and Return on Assets come into play.
Return on Equity measures the profitability of a company in relation to shareholder’s equity, essentially showing how well a company uses investments to generate earnings growth. On the other hand, Return on Assets gives us insight into how profitable a company is relative to its total assets, indicating how efficient management is at using its assets to generate earnings.
The journey doesn’t stop at profit. Let’s take a look at how well these companies use their resources.
Efficiency and Liquidity – Ford vs GM Stock Analysis
Return on Equity, Return on Assets, Current Ratio – these are not just jargon. They are essential indicators of how efficiently a company uses its resources.
In the automotive industry’s fast-paced environment, efficiency and liquidity are key. Let’s break down these crucial metrics for Ford vs GM Stock Analysis.
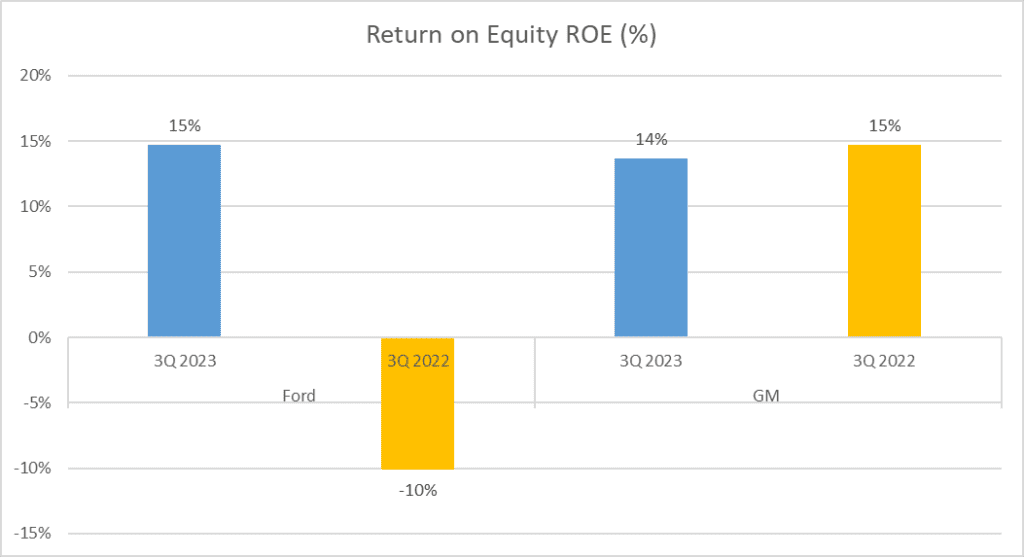
Starting with Return on Equity, or ROE, Ford scores a 15%, while GM trails slightly behind at 14%. ROE measures a company’s profitability by revealing how much profit a company generates with the shareholders’ equity. Higher ROE indicates efficient use of investor funds.
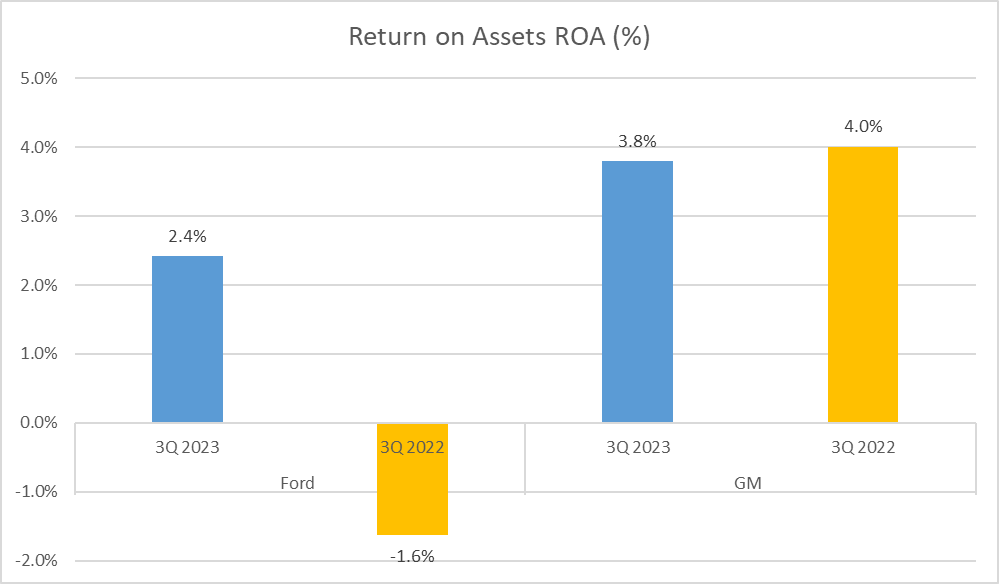
Now, let’s shift gears to Return on Assets, or ROA. This ratio shows how profitable a company is relative to its total assets, highlighting how efficiently management is using its assets to generate earnings. In this arena, GM outperforms Ford with a ROA of 3.8% compared to Ford’s 2.4%.
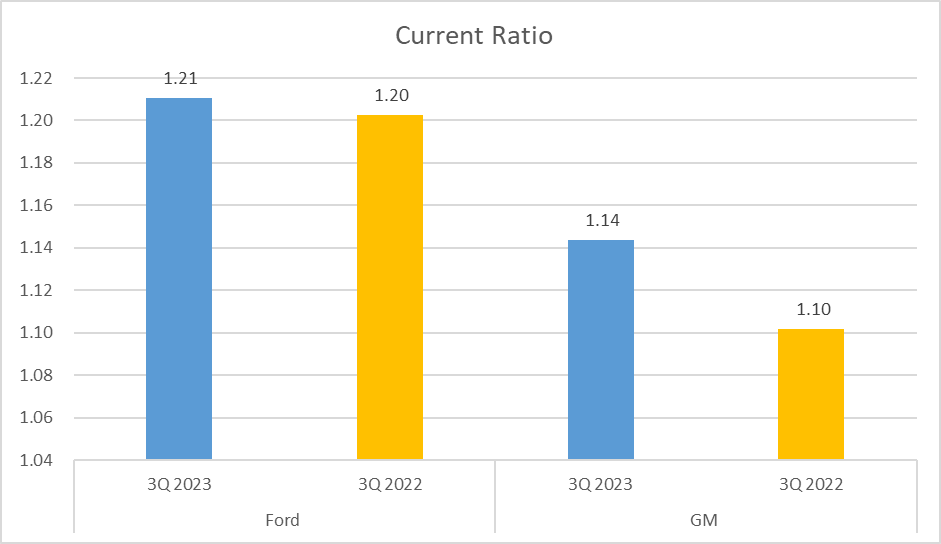
Next up is the Current Ratio – a liquidity ratio that measures a company’s ability to pay short-term and long-term obligations. A higher current ratio indicates a more promising default risk. Ford leads in this aspect with a current ratio of 1.21, while GM follows closely with 1.14.
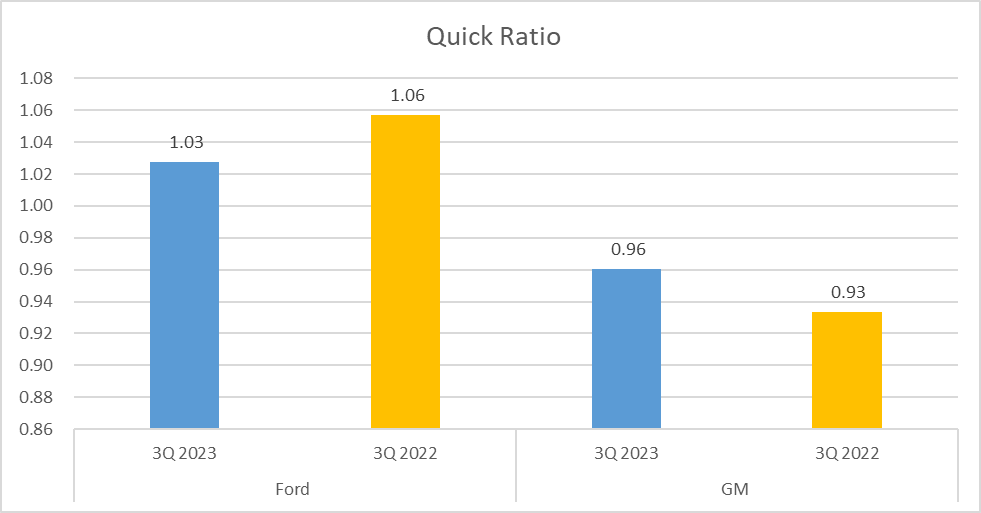
But let’s not stop there. The Quick Ratio, which excludes inventories from current assets, provides a more stringent measure of liquidity. Ford vs GM Stock Analysis score 1.03 and 0.96 respectively, showing that both companies maintain a sufficient level of liquidity to meet their immediate obligations.
It’s important to remember, though, that while efficiency and liquidity are critical, they are not the be-all and end-all. Different companies have different business models and strategies that may require varying levels of efficiency and liquidity.
Efficiency and liquidity are important, but let’s not forget about the role of cash. Stay tuned as we dive deeper into the cash flow analysis in the next scene, where we’ll explore how cash generation impacts these automotive giants’ financial health.
Cash Flow Analysis – Ford vs GM Stock Analysis
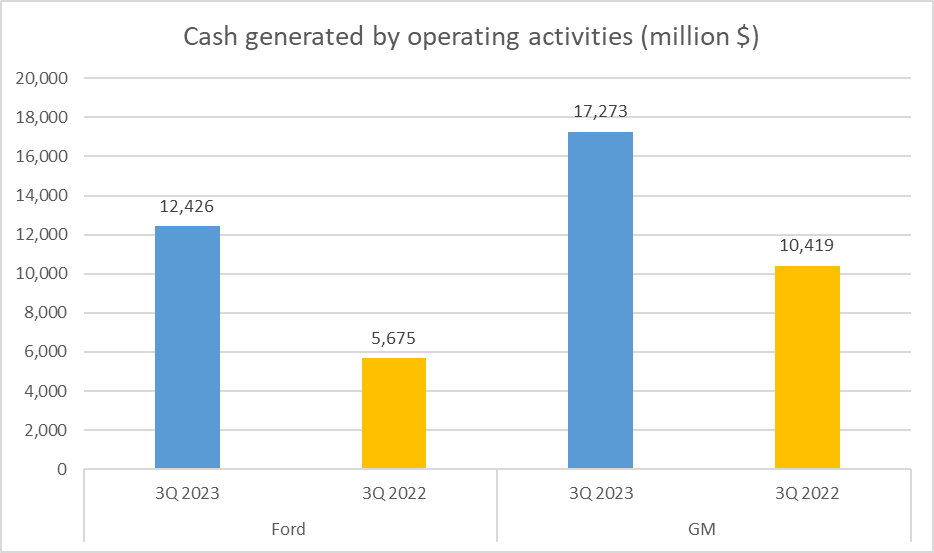
Cash is king, and in business, cash flow is everything. Ford has generated 12 billion dollars in cash from operating activities, while GM has generated seventeen billion.
It’s often said that revenue is vanity, profit is sanity, but cash is reality. The reason why cash flow is so crucial is that it allows businesses to reinvest in themselves, pay dividends to shareholders, and build a buffer against future financial challenges.
Let’s break down the cash flow a bit further. Operating Cash Flow, or OCF, is the cash generated from the day-to-day operations of a business. It shows how much cash a company is able to generate from its core business operations. In 2023, Ford’s OCF stood at 12 billion dollars, and GM’s was 17 billion dollars.
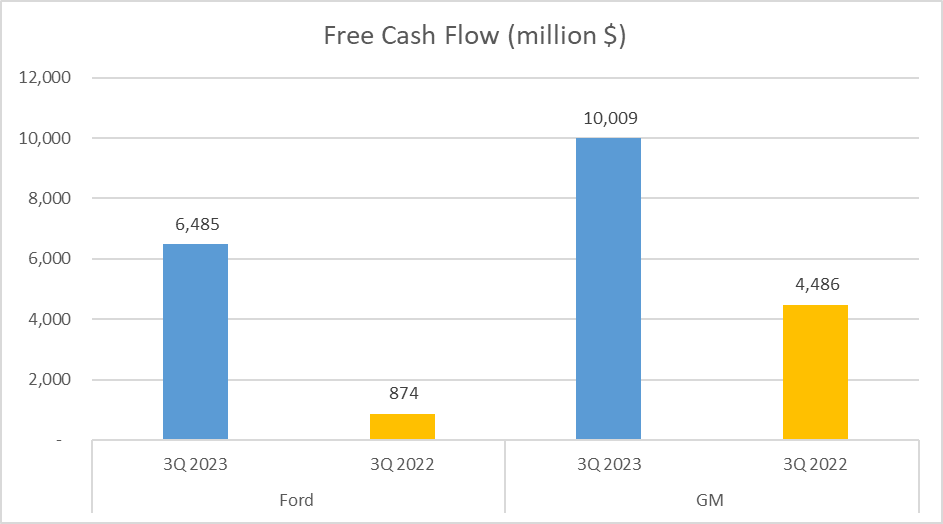
Another important element to consider in cash flow analysis is the Free Cash Flow or FCF. This is the cash a company generates after accounting for cash outflows to support operations and maintain its capital assets. In 2023, Ford’s FCF was 6 billion dollars, and GM’s was 10 billion dollars.
But, how do we connect these cash flow figures to profitability? That’s where the Operating Cash Flow to Net Income ratio comes in. This ratio indicates the number of times operating cash flow could cover net income. If this ratio is greater than one, it means the company is generating sufficient cash to cover its reported net income. For Ford, this ratio was 2.5, and for GM, it was 2.2. Both companies appear to be in a healthy position in terms of their ability to cover their net income with operating cash flows.
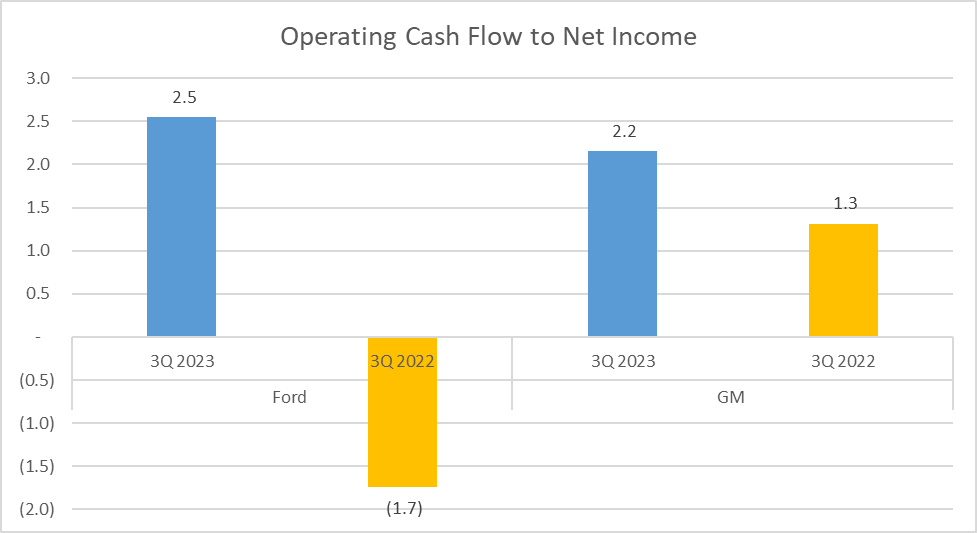
So, we can see that both Ford vs GM Stock Analysis are generating healthy cash flows from their operations, which is a positive sign for their financial health. However, GM seems to have a slight edge over Ford in terms of both Operating Cash Flow and Free Cash Flow.
Now that we’ve covered the cash flow, let’s break down the ROE a little further.
Dupont Analysis – Ford vs GM Stock Analysis
ROE, a simple figure, but there’s more to it than meets the eye. Through Dupont analysis, we can break down the factors affecting the ROE of Ford vs GM Stock Analysis
ROE, or Return on Equity, is a measure of financial performance calculated by dividing net income by shareholders’ equity. It’s essentially a measure of profitability that directly relates to shareholders’ investments. But what makes up this seemingly straightforward figure? That’s where Dupont analysis comes in.
Dupont analysis dissects the ROE into three components: the net profit margin, the asset turnover ratio, and the equity multiplier. By doing so, it provides a detailed view of the company’s operating efficiency, asset use efficiency, and financial leverage.
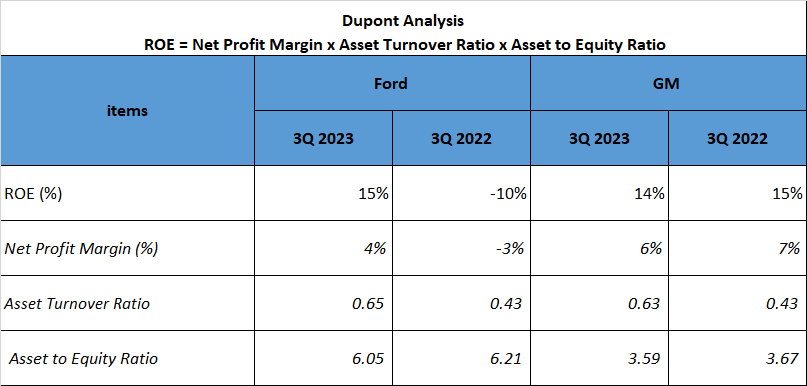
Let’s start with Ford. Its ROE for 2023 was 15%. From the Dupont analysis, we see that this is a product of a net profit margin of 4%, an asset turnover ratio of 0.65, and an equity multiplier of 6.05. This tells us that while Ford’s profit per dollar of sales isn’t particularly high, it’s making up for it with a high level of financial leverage.
Now let’s turn to GM. Its ROE was slightly lower at 14%. However, the Dupont analysis paints a different picture here. GM’s net profit margin was 6%, and it had an asset turnover ratio of 0.63 and an equity multiplier of 3.59. Compared to Ford, GM is more profitable per dollar of sales but uses less financial leverage.
What can we take away from this? Well, it highlights the different strategies of these two automotive giants. While Ford is relying more on financial leverage, GM is focusing on improving its profitability. Both strategies have their merits and risks, and it’s up to the investor to decide which they prefer.
And that wraps up our deep dive into the financial health of Ford vs GM Stock Analysis. Remember, understanding a company’s financial performance is key to making effective investment decisions.
Watching more on Youtube:
Author: InvestForcus.com
Follow us on Youtube: The Investors Community

