Curious about how General Electric vs Honeywell Stock Analysis stack up financially? Look no further. We’re diving into a comprehensive analysis of these industry giants.
General Electric, a powerhouse with interests spanning aerospace, renewable energy, and power. And then there’s Honeywell, a diversified leader in technology and manufacturing, operating in aerospace, building technologies, performance materials and technologies, and safety and productivity solutions.
These global players shape our world, and in the following sections, we’ll dissect their financial performance, scrutinizing revenues, profits, assets, and operational efficiency. We’ll even unpack their Dupont Analysis, a critical gauge of return on equity. Let’s crunch the numbers and uncover the insights these corporate titans hold.
Revenue Analysis-General Electric vs Honeywell Stock Analysis
Let’s kick off with revenue. In the last three quarters of 2023, General Electric raked in $49B, while Honeywell trailed with $27B. Over five years, General Electric’s revenue declined at a compound annual growth rate (CAGR) of -6%, compared to Honeywell’s -3%. This downward trend signals challenges for both, with General Electric facing a sharper decline.
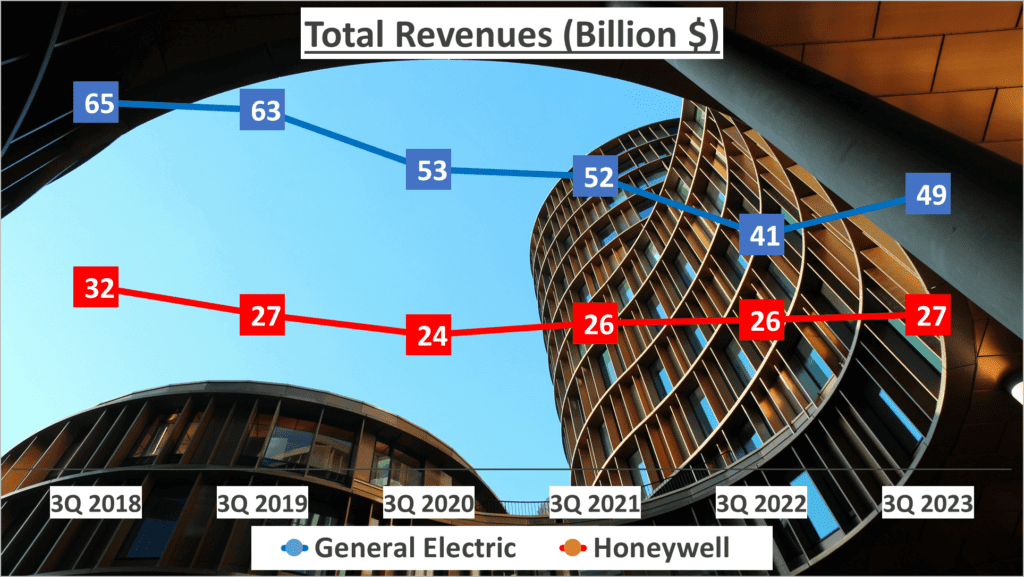
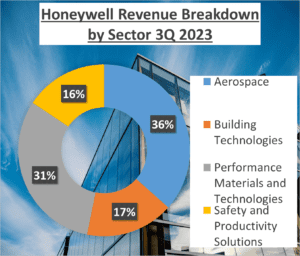
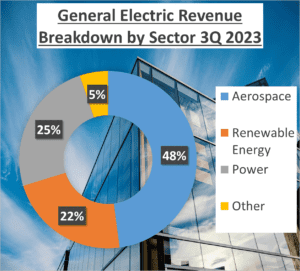
A deeper dive into revenue sources reveals General Electric relies heavily on aerospace (48%), renewable energy (22%), and power (25%). In contrast, Honeywell’s revenue streams are more diversified: aerospace (36%), building technologies (17%), performance materials and technologies (31%), and safety and productivity solutions (16%).
This discrepancy suggests Honeywell’s diversified portfolio may offer resilience against sector-specific fluctuations. But remember, revenue is just part of the picture. Profitability, efficiency, and cash flow complete the financial mosaic.
In summary, both giants saw revenue declines over five years, with General Electric’s downturn more pronounced. Yet, their revenue streams vary, with General Electric banking heavily on aerospace and energy, while Honeywell enjoys a more balanced portfolio.
Profit Analysis-General Electric vs Honeywell Stock Analysis
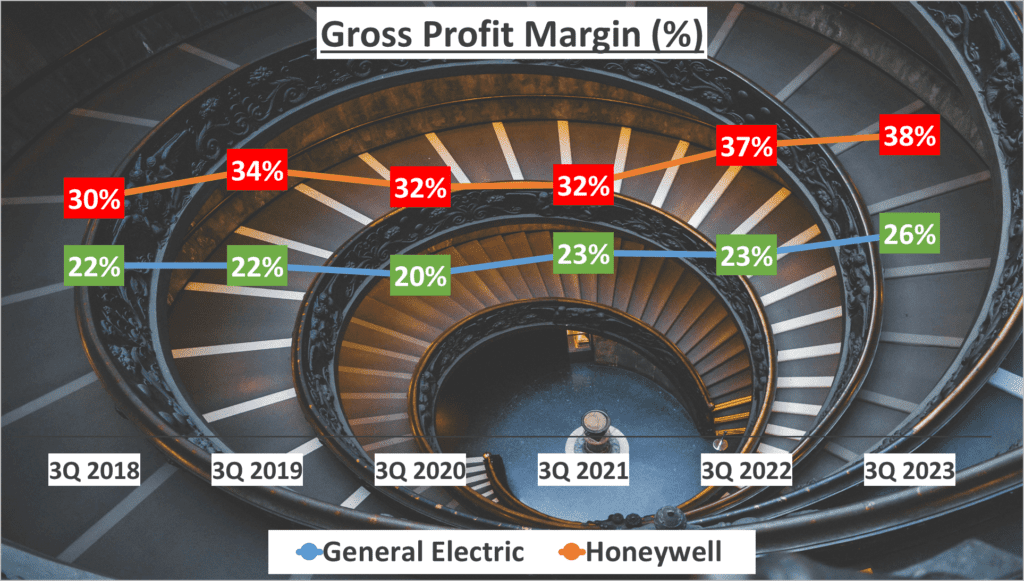
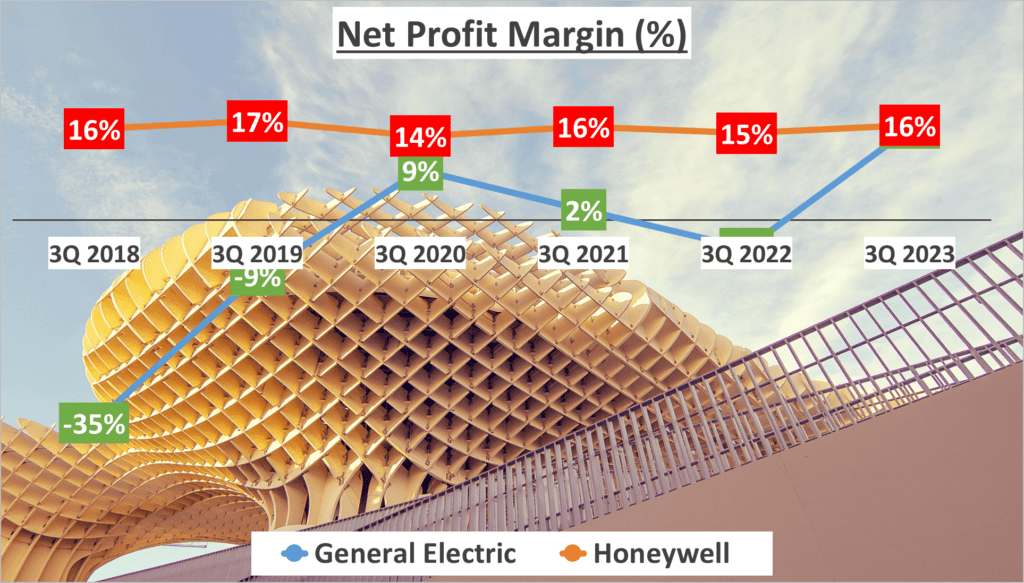
Let’s talk profits. Gross profit margins for General Electric vs Honeywell Stock Analysis in late 2023 stood at 26% and 38%, respectively. General Electric’s net profit margin improved significantly to 16%, while Honeywell maintained its steady 16% over five years.
General Electric’s net profit soared to $7.6B in 2023, a dramatic turnaround from its -$22.4B in 2018. Honeywell’s net profit remained stable around $4.2B, showcasing contrasting trajectories—General Electric’s resurgence and Honeywell’s consistency.
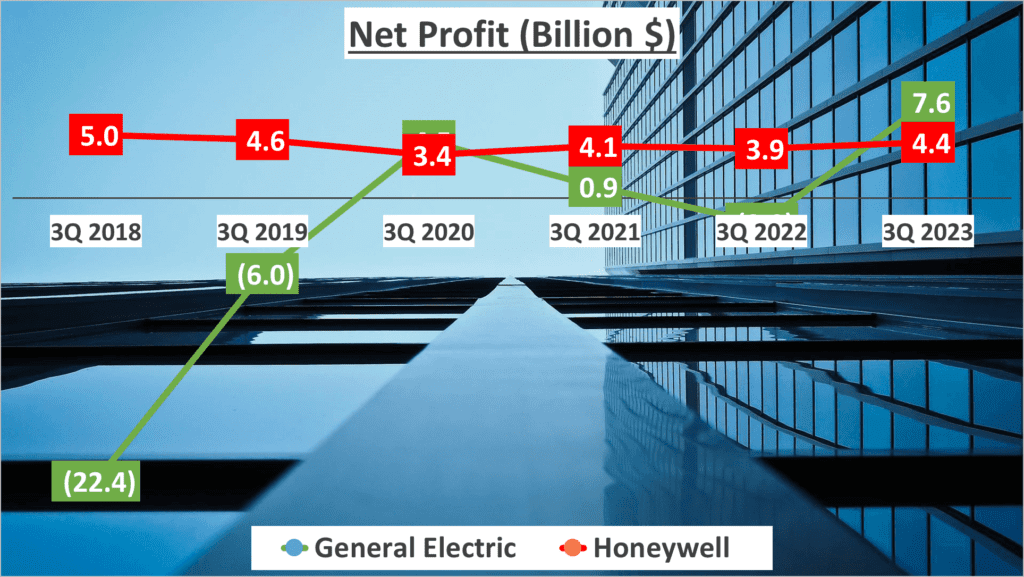
While both boast strong profit margins, General Electric’s volatile journey sets it apart from Honeywell’s steady course.
Asset Analysis-General Electric vs Honeywell Stock Analysis
Now onto assets. General Electric reported total assets of $157B, while Honeywell reported $61B. But net assets reveal a different story: General Electric’s $30B vs. Honeywell’s $18B.
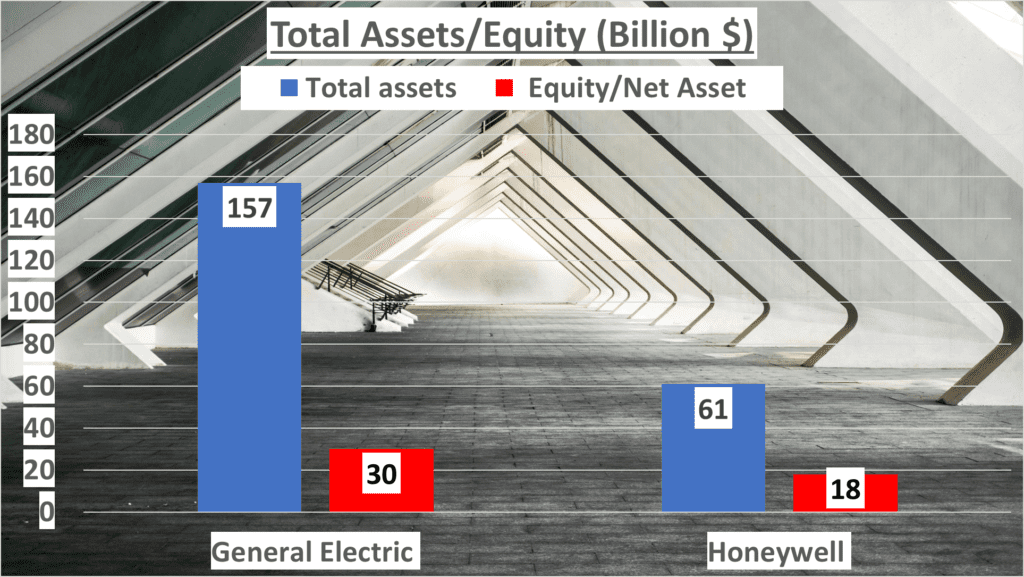
This contrast underscores each company’s asset management. The Equity to Total Assets ratio further highlights differences—19% for General Electric and 29% for Honeywell—suggesting Honeywell relies less on debt for financing.
These figures unveil how each juggernaut manages its assets and equity.
Operational Efficiency and Cash Flow-General Electric vs Honeywell Stock Analysis
Operational efficiency and cash flow are crucial. General Electric’s Current Ratio is 1.17, Quick Ratio 0.82, compared to Honeywell’s 1.35 and 1.01, respectively.
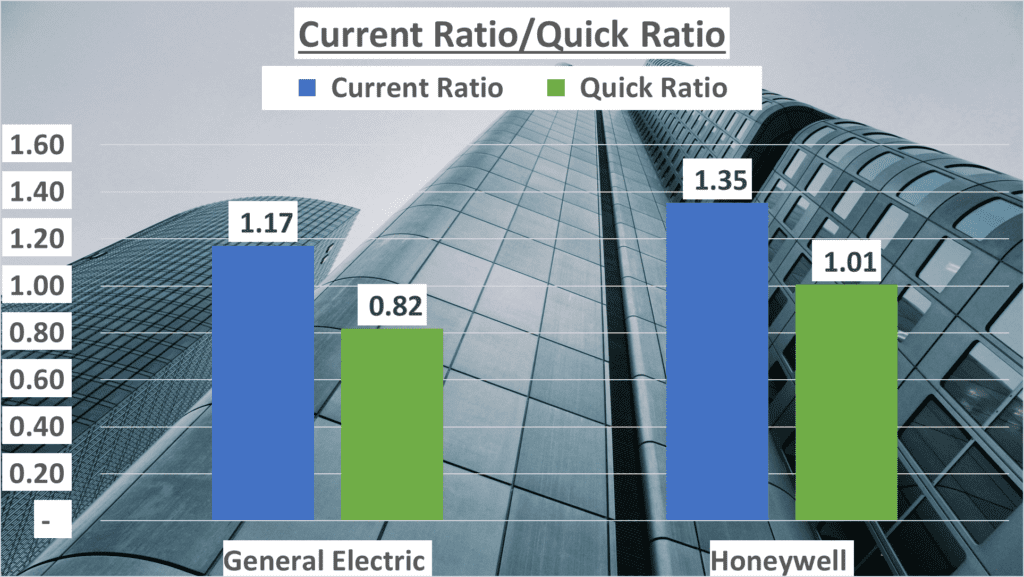
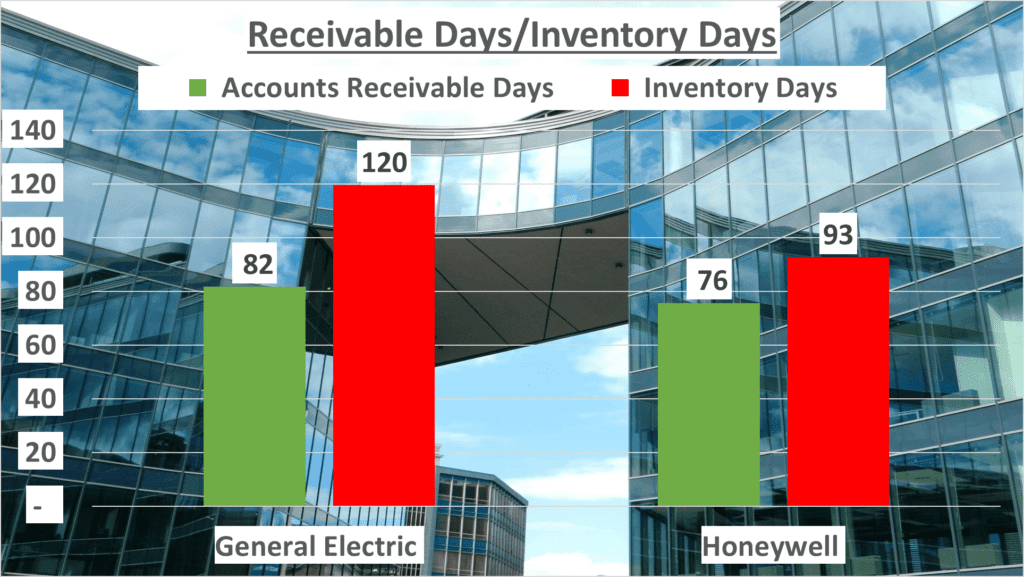
Inventory turnover for General Electric is 120 days, while Honeywell turns it around in 93. Honeywell also collects payments faster—76 days versus General Electric’s 82.
Over five years, Honeywell’s operating cash flow declined gradually, while General Electric’s increased. Free cash flow tells a similar story—Honeywell’s decreasing, General Electric’s rising.
Operating Cash Flow to Net Income ratio is 0.3 for General Electric and 0.5 for Honeywell, indicating how efficiently they convert income into cash.
These metrics shed light on operational efficiency and cash flow management.
Dupont Analysis and Conclusion-General Electric vs Honeywell Stock Analysis
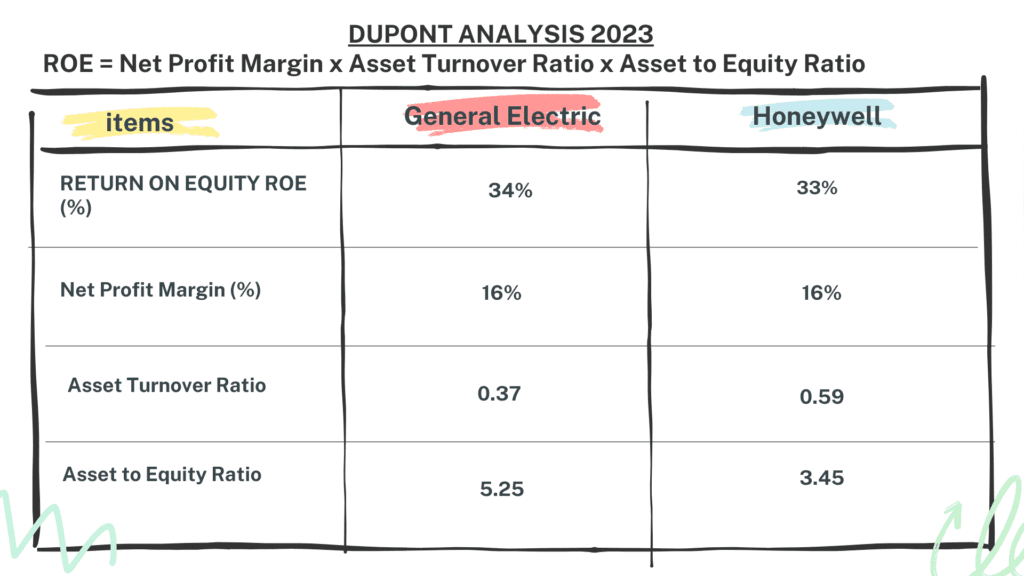
Finally, the Dupont Analysis. General Electric’s ROE is 34%, driven by a 16% net profit margin, 0.37 asset turnover, and 5.25 asset to equity ratio. Honeywell’s ROE is slightly lower at 33%, with a similar net profit margin, higher asset turnover (0.59), and lower asset to equity ratio (3.45).
These insights into their financial health and performance illuminate the distinct strategies of General Electric vs Honeywell Stock Analysis. Stay tuned for more financial comparisons, because knowledge is power in the world of investment.
Watching more on youtube:
Author: Investforcus.com
Follow us on Youtube: The Investors Community

