Have you ever wondered which is a better investment, Home Depot vs. Lowe’s Stock Analysis? These two retail giants have been battling it out for the top spot in the home improvement sector for years.
Home Depot vs. Lowe’s Stock Analysis, both leaders in the world of retail construction and home décor, have made significant strides in their respective financial journeys.
This article aims to delve into an in-depth analysis of these two companies, comparing and contrasting their financial performance over the last five years.
We’ll be looking at their total revenues, profit margins, and operational efficiency, among other things.
With the help of figures and statistics, we’ll draw a clear picture of their financial health and growth.
After all, understanding a company’s financial situation can make the investment process much more effective. So, buckle up!
Stay tuned to find out which company might be the better investment for you.
Revenue Analysis – Home Depot vs. Lowe’s Stock Analysis
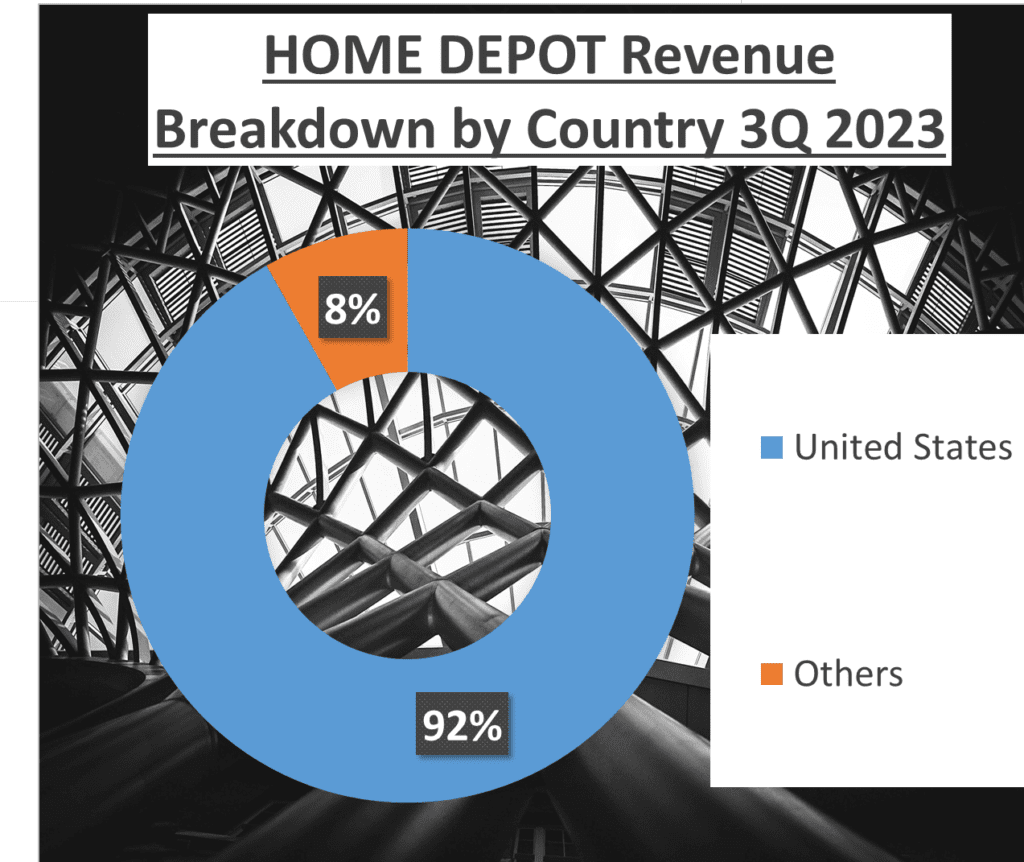
Let’s dive into the numbers, starting with the revenues for both companies. Home Depot’s total revenue for the last three quarters of 2023 came in at a whopping 118 billion dollars. On the other hand, Lowe’s, not too far behind, posted 68 billion dollars in revenue for the same period.
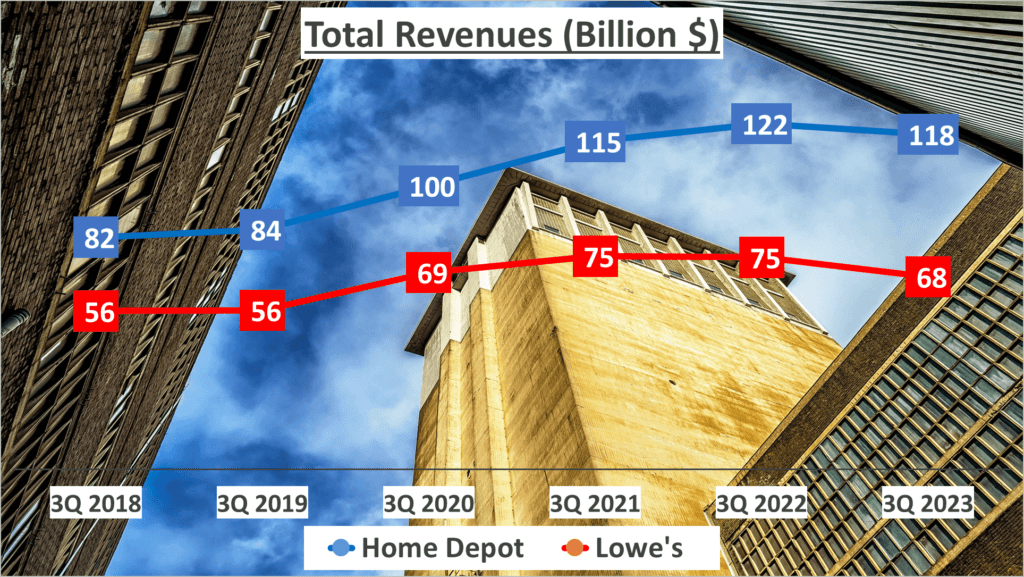
When we take a step back and look at the bigger picture, we see some interesting trends. Over the past five years, Home Depot has seen its revenue grow at a Compound Annual Growth Rate, or CAGR, of 8%. This indicates a consistent and healthy rate of growth.
Meanwhile, Lowe’s has experienced a slightly slower growth rate, with a CAGR of 4% over the same period. However, it’s important to note that growth is not just about the speed, but also the sustainability and potential for future expansion.
Breaking down the revenue sources, we find that Home Depot’s revenue structure consists of 38% from Building Materials, 32% from Decor, and 30% from Hardlines.
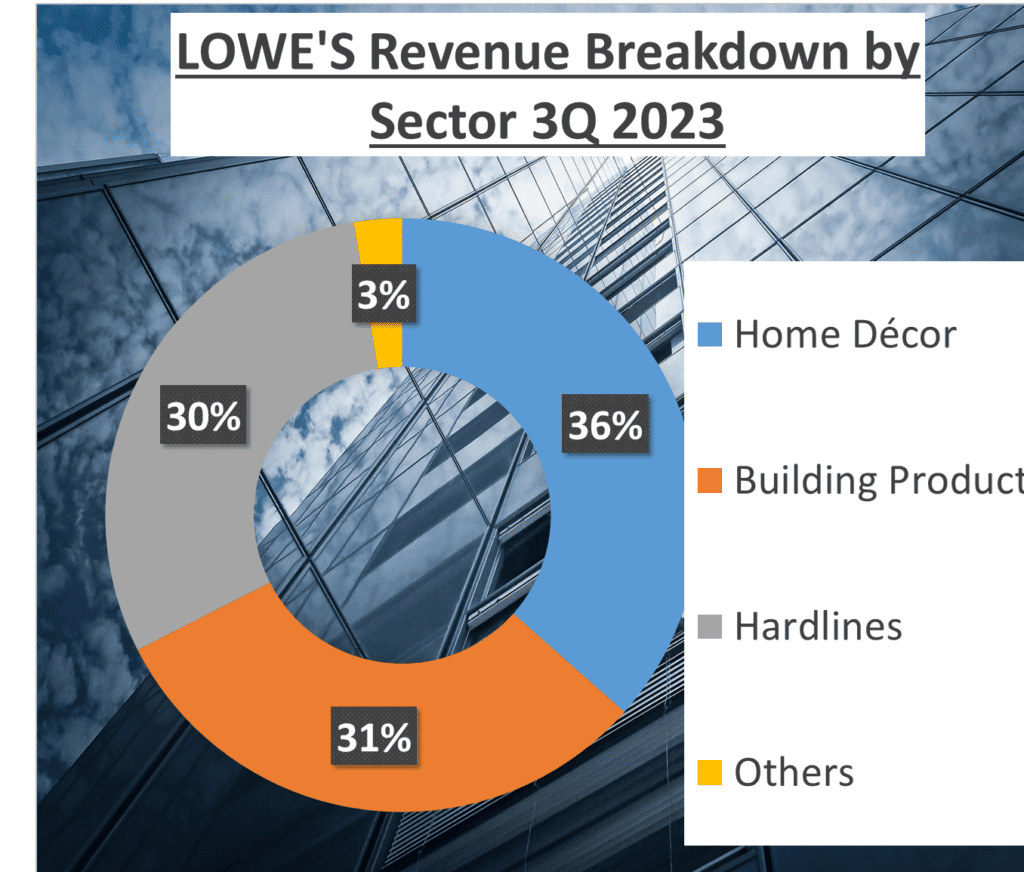
On the other hand, Lowe’s revenue structure is slightly different. It consists of 36% from Home Decor, 31% from Building Products, 30% from Hardlines, and a small 3% from other sources.
These breakdowns reveal where each company’s strengths lie and where they are focusing their business strategies.
To summarize, while Home Depot has higher total revenues, Lowe’s has shown a higher growth rate over the past five years. This shows that both companies have their strengths and are leveraging them in different ways to drive their businesses forward. It’s a fascinating comparison, and it will be interesting to see how these trends evolve in the future.
While Home Depot has higher revenues, Lowe’s has shown a higher growth rate over the past five years.
Profit Margins – Home Depot vs. Lowe’s Stock Analysis
But revenue is just one part of the story. Let’s take a look at profit margins.
Examining profit margins gives us a clearer picture of how much each company is actually earning after accounting for all costs. Gross profit margin, which is the proportion of money left over from revenues after accounting for the cost of goods sold, is a key indicator of a company’s financial health.
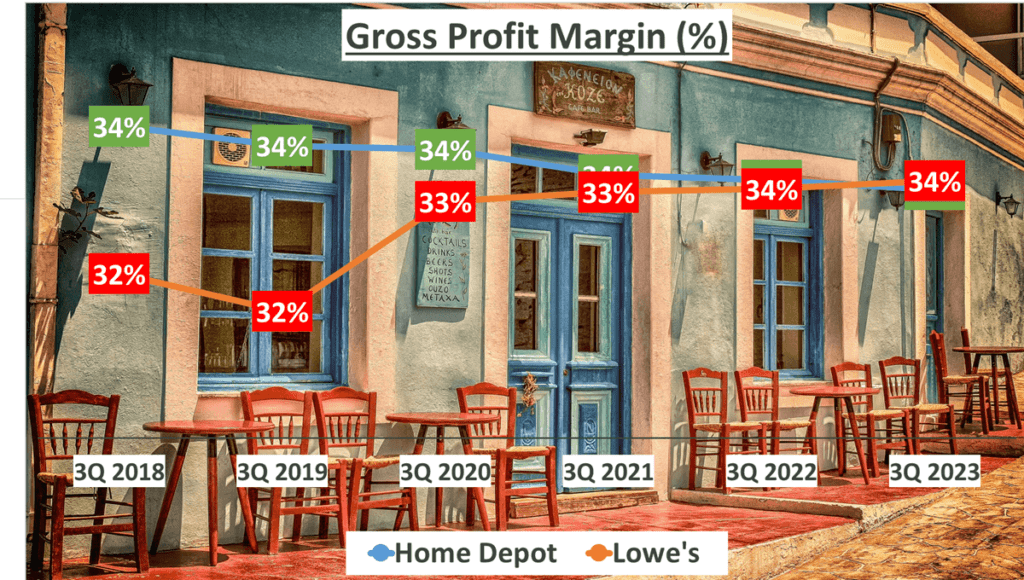
In the final three quarters of 2023, Home Depot boasted a gross profit margin of 33%. This is slightly lower than their five-year average of 34%, suggesting a slight downtrend. On the other hand, Lowe’s gross profit margin for the same period was 34%, a notch above their five-year average of 33%, indicating an upward trend.
But gross profit margin only tells us part of the story. The net profit margin, which is the percentage of revenue that a company keeps as profit after accounting for all its expenses, taxes, and costs, can provide a more accurate picture of a company’s profitability.
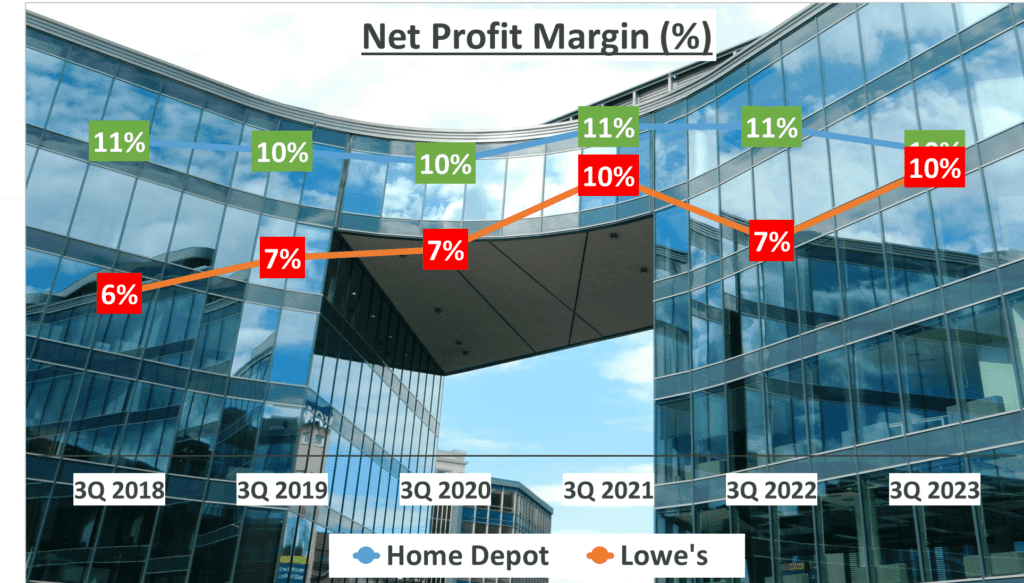
For Home Depot, the net profit margin was 10%, a little lower than their five-year average of 11%. This suggests that Home Depot’s profitability has been on a slight decline. Conversely, Lowe’s net profit margin was 10%, higher than their five-year average of 8%, indicating that Lowe’s profitability has been on the rise.
In terms of net profits, Home Depot raked in 12.3 billion dollars, while Lowe’s earned 6.7 billion dollars. Over the past five years, Home Depot’s net profit has grown at a compound annual growth rate of 7%, while Lowe’s net profit has grown at a more impressive rate of 17%.
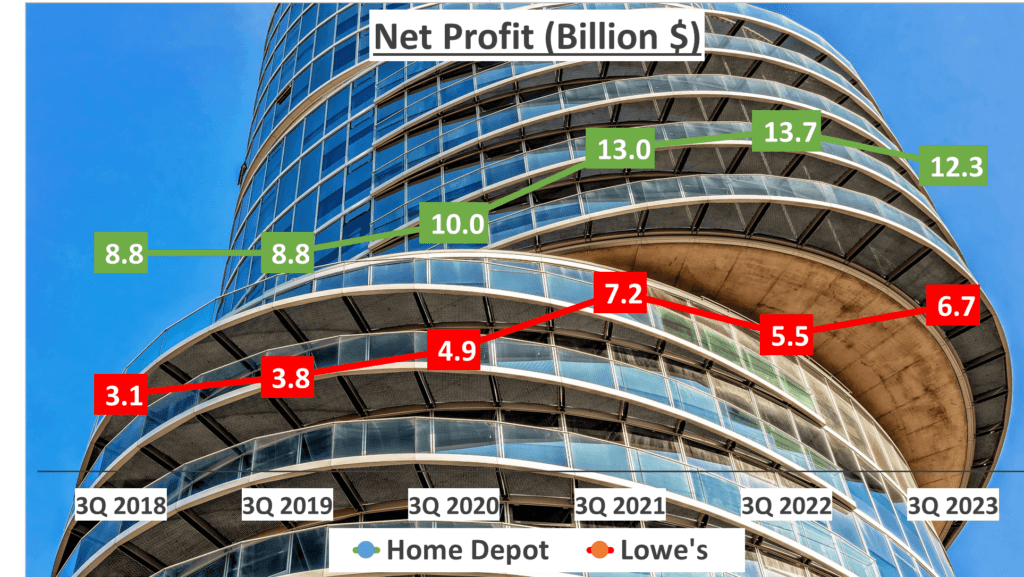
In conclusion, while Home Depot’s profit margins have been decreasing, Lowe’s margins have been improving. This trend could potentially be a sign of shifting fortunes between these two retail giants. However, it’s important to remember that a company’s past performance is not necessarily indicative of its future results. As investors, we must always consider a wide range of factors before making our decisions.
Efficiency and Cash Flow – Home Depot vs. Lowe’s Stock Analysis
Now, let’s talk about efficiency and cash flow. An essential facet of any successful business is its operational efficiency. When we look at Home Depot vs. Lowe’s Stock Analysis, we see two giants of the retail industry, and yet, their efficiency levels are not identical.
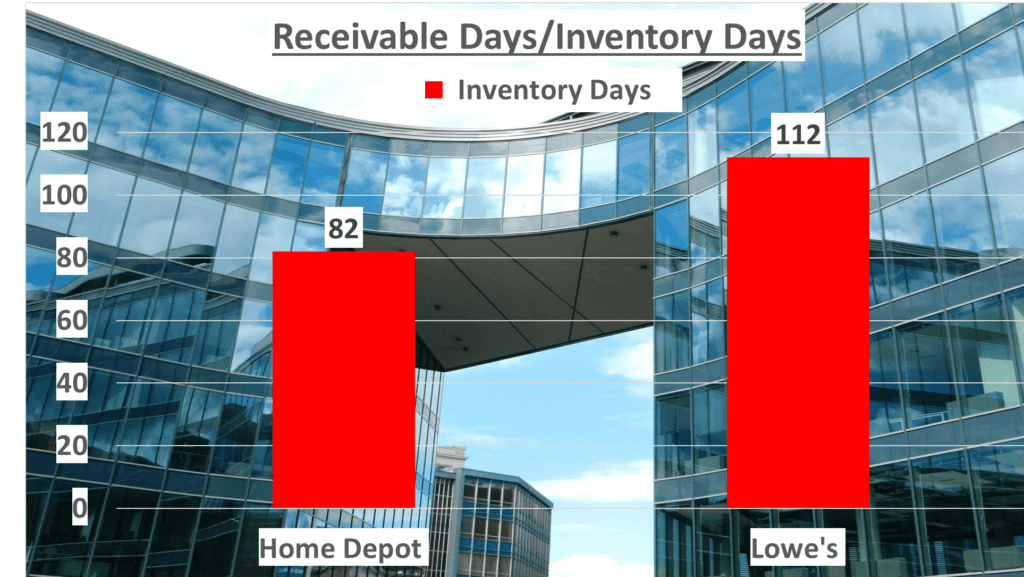
Let’s take inventory days as an example. This measures the average number of days that a company holds onto its inventory before selling it. For Home Depot, this number sits at 82 days. On the other hand, Lowe’s holds onto its inventory for an average of 112 days. This difference may seem minor at first glance, but it’s quite significant in the grand scheme of things. It shows that Home Depot is more efficient in turning over its inventory, which can reduce costs and improve cash flow.
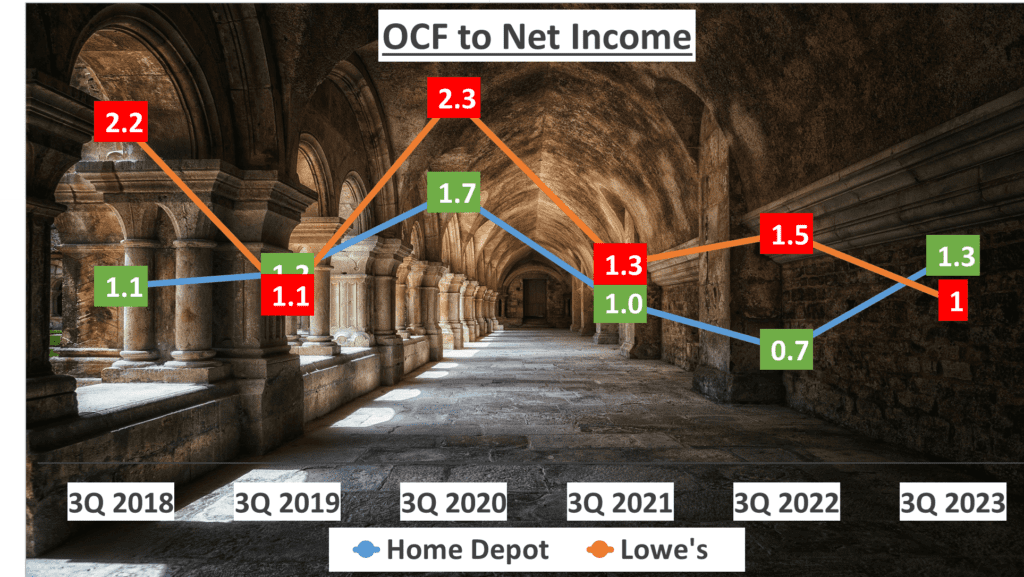
Speaking of cash flow, let’s delve into that. Operating cash flow, or OCF, is the cash generated from a company’s regular business operations. It’s a good indicator of a company’s ability to generate enough cash to maintain and grow its operations. In the case of Home Depot, their OCF is 16.4 billion dollars. Comparatively, Lowe’s OCF is 7 billion dollars. This indicates that Home Depot is generating more than twice the cash from its operations than Lowe’s.
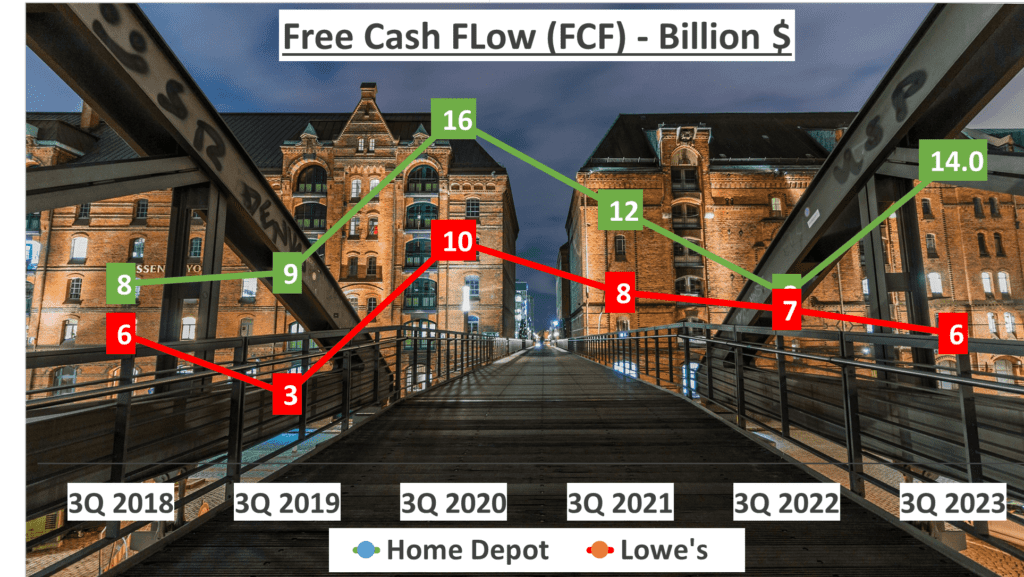
But let’s not stop there. Let’s also consider the Free Cash Flow, or FCF. This is the cash a company produces through its operations, less the cost of expenditures on assets. In other words, it’s the cash left over after a company pays for its operating expenses and capital expenditures. For Home Depot, their FCF is 14 billion dollars, while Lowe’s sits at 6 billion dollars. This suggests that Home Depot has more cash left over after paying for its operational costs and investments.
To sum it up, when it comes to operational efficiency and cash flow, Home Depot seems to have the upper hand. It turns over its inventory faster and generates more cash from its operations. Home Depot appears to be more efficient and has stronger cash flows than Lowe’s.
Dupont Analysis – Home Depot vs. Lowe’s Stock Analysis
Finally, let’s dive into the Dupont analysis. This financial tool breaks down the return on equity, or ROE, into three parts: Net Profit Margin, Asset Turnover, and Equity Multiplier. It’s a way to understand the driving factors behind a company’s profitability.
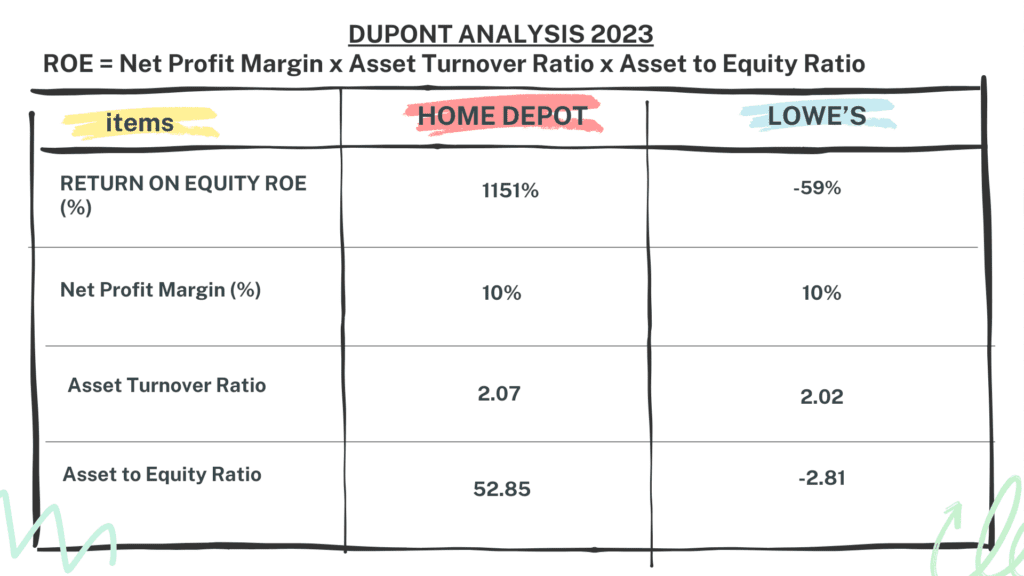
Looking at Home Depot, we see an ROE of one thousand one hundred and 51% for the third quarter of twenty twenty-three. This high figure is driven by a Net Profit Margin of 10%, an Asset Turnover of 2.07, and a significant Equity Multiplier of 52.85.
The Equity Multiplier is a reflection of financial leverage. In Home Depot’s case, it’s high due to the company’s ongoing share buybacks and cash dividend payments, which have reduced equity. These practices increase the company’s debt relative to its equity, hence the high Equity Multiplier.
Now, let’s switch gears to Lowe’s. The company has a negative equity due to its continuous cash dividend payments and share buybacks over many years. Therefore, calculating an ROE wouldn’t be meaningful. Instead, we look at the Return on Assets, or ROA, which is 20%.
This figure is derived from Lowe’s Net Profit Margin of 10% and its Asset Turnover of 2.02. In essence, Lowe’s has been able to generate a dollar of profits for every five dollars of assets it owns.
It’s interesting to note that despite the different approaches, both Home Depot vs. Lowe’s Stock Analysis have the same ROA of 20%.
In summary, the Dupont analysis provides a more nuanced view of a company’s profitability. It shows us how Home Depot’s high ROE is driven by its large Asset to Equity ratio. On the other hand, Lowe’s matches Home Depot’s ROA, despite its negative equity. This suggests that both companies have been effective in generating profits from their respective resources.
While Home Depot has a high ROE due to its large Asset to Equity ratio, Lowe’s ROA matches that of Home Depot.

Conclusion – Home Depot vs. Lowe’s Stock Analysis
So, which is a better investment, Home Depot vs. Lowe’s Stock Analysis?
We’ve taken a deep dive into both companies, examining their financial performance over the past five years. We’ve seen that Home Depot has consistently higher revenues, with a Compound Annual Growth Rate (CAGR) of 8%. Lowe’s, on the other hand, has a CAGR of 4%.
We’ve also looked at profit margins, where Home Depot’s Gross Profit Margin is on a declining trend, while Lowe’s is on the rise.
In terms of efficiency, Home Depot turns its inventory faster, indicating better operational efficiency.
However, when we analyze the Dupont model, we find that both companies have an equal Return on Assets (ROA) of 20%.
In the end, the choice between Home Depot vs. Lowe’s Stock Analysis depends on your individual investment goals and risk tolerance. Always do your own research before making any investment decisions.
Watching more on Youtube:
Author: InvestForcus.com
Follow us on Youtube: The Investors Community

