JNJ vs Pfizer Stock Analysis – Curious about how Johnson & Johnson stacks up against Pfizer in the stock market? You’re in the right spot. Today, we’ll conduct a head-to-head analysis of these two healthcare and pharmaceutical giants.
First, let’s examine their financial performance. We’ll focus on key metrics like total revenues, profit margins, and net profits.
Then, we’ll delve into their stock performance, financial health, efficiency, and return on equity.
So, prepare for some number crunching as we explore the numbers in depth. Let’s dive right in.
Total Revenues Comparison – JNJ vs Pfizer Stock Analysis
Let’s kick off by examining the total revenues for both companies. Johnson & Johnson and Pfizer, renowned healthcare and pharmaceutical giants in the United States, showcased divergent revenue trends in the last three quarters of 2023. Johnson & Johnson’s total revenues amounted to $64B, while Pfizer reported $44B.
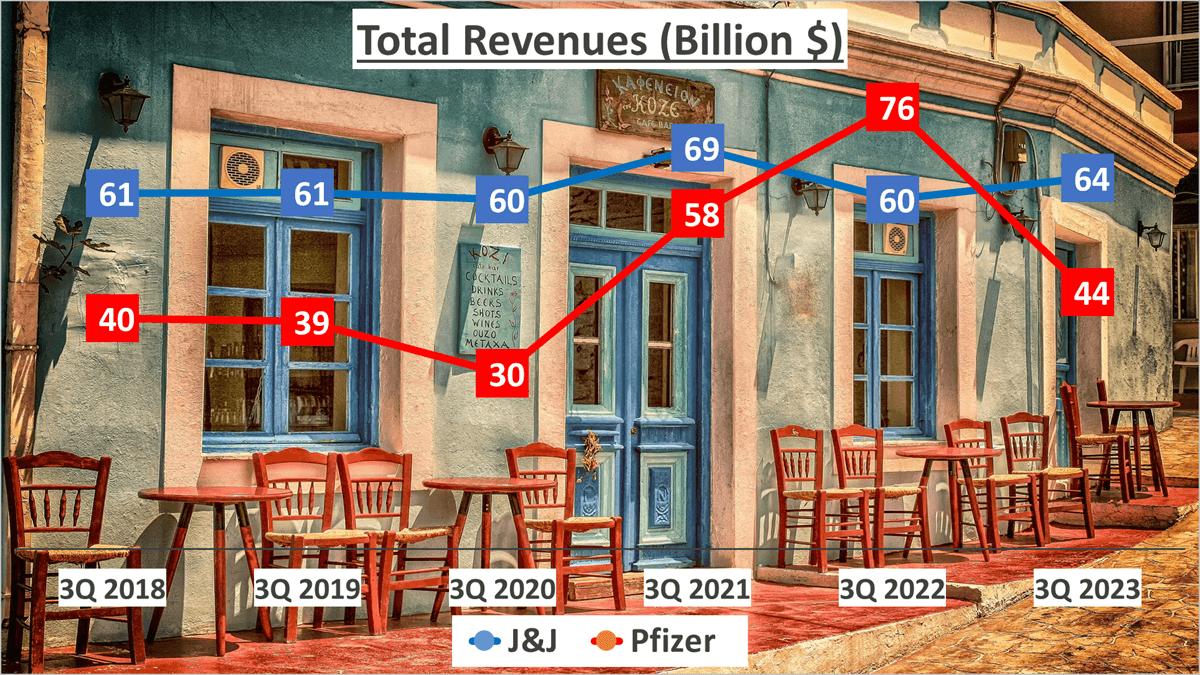
Since 2018, Johnson & Johnson has maintained relatively stable revenue figures, whereas Pfizer underwent a significant growth phase during the Covid-19 pandemic from 2021 to 2022. In fact, in 2022, Pfizer’s revenue surpassed that of Johnson & Johnson, totaling $76B compared to Johnson & Johnson’s $60B.
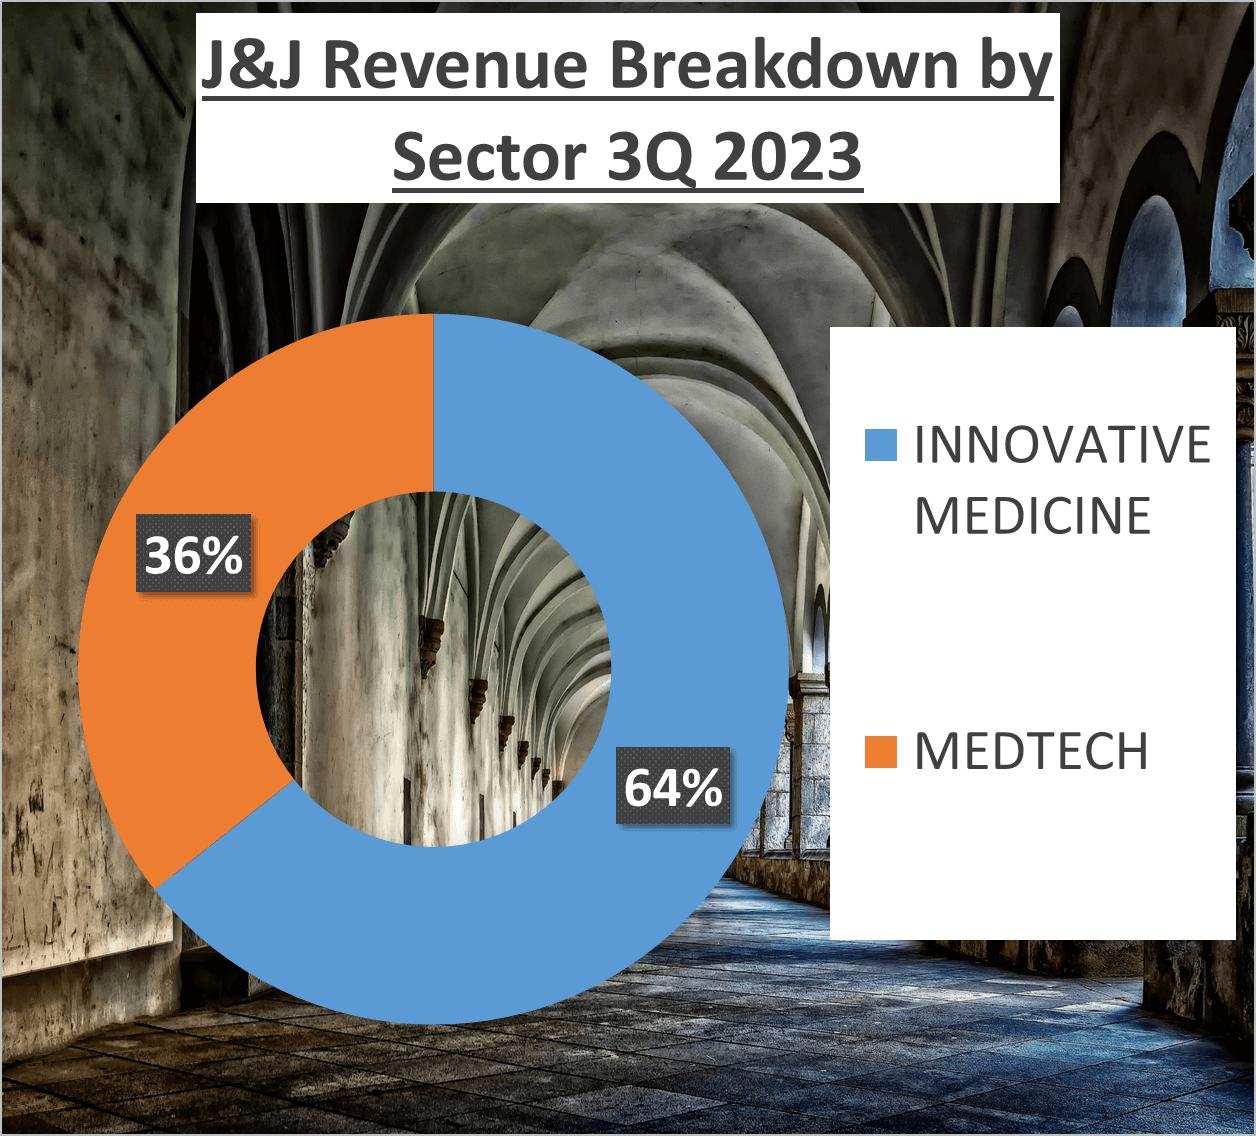
Johnson & Johnson’s revenue structure comprises 64% from Innovative Medicine and 36% from Medtech. In contrast, Pfizer’s revenue heavily relies on Biopharma, constituting 98%, with the remaining 2% derived from other sources.
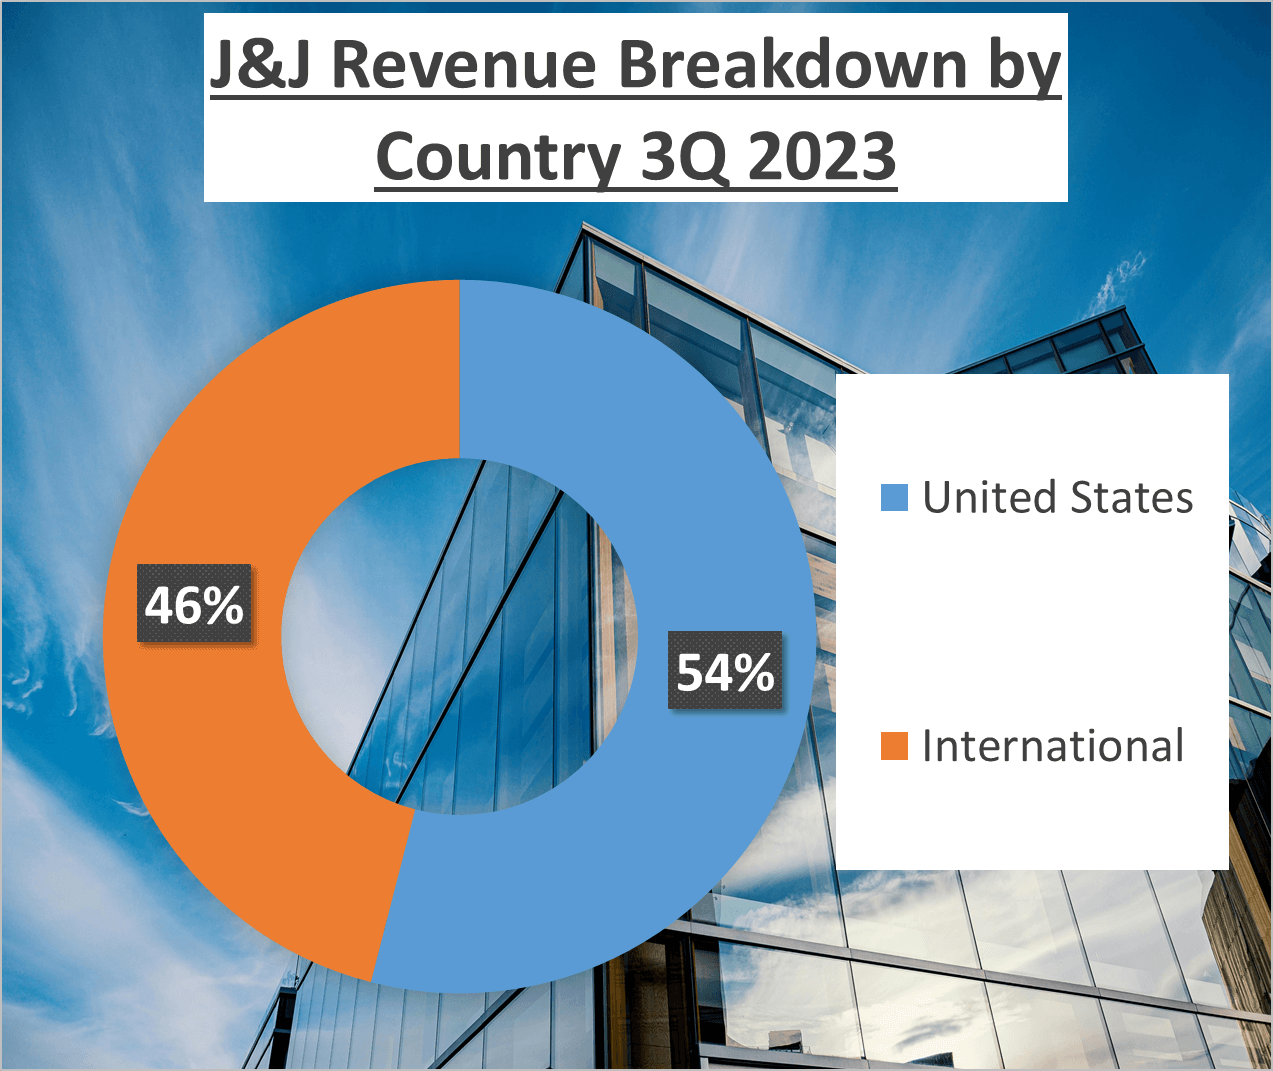
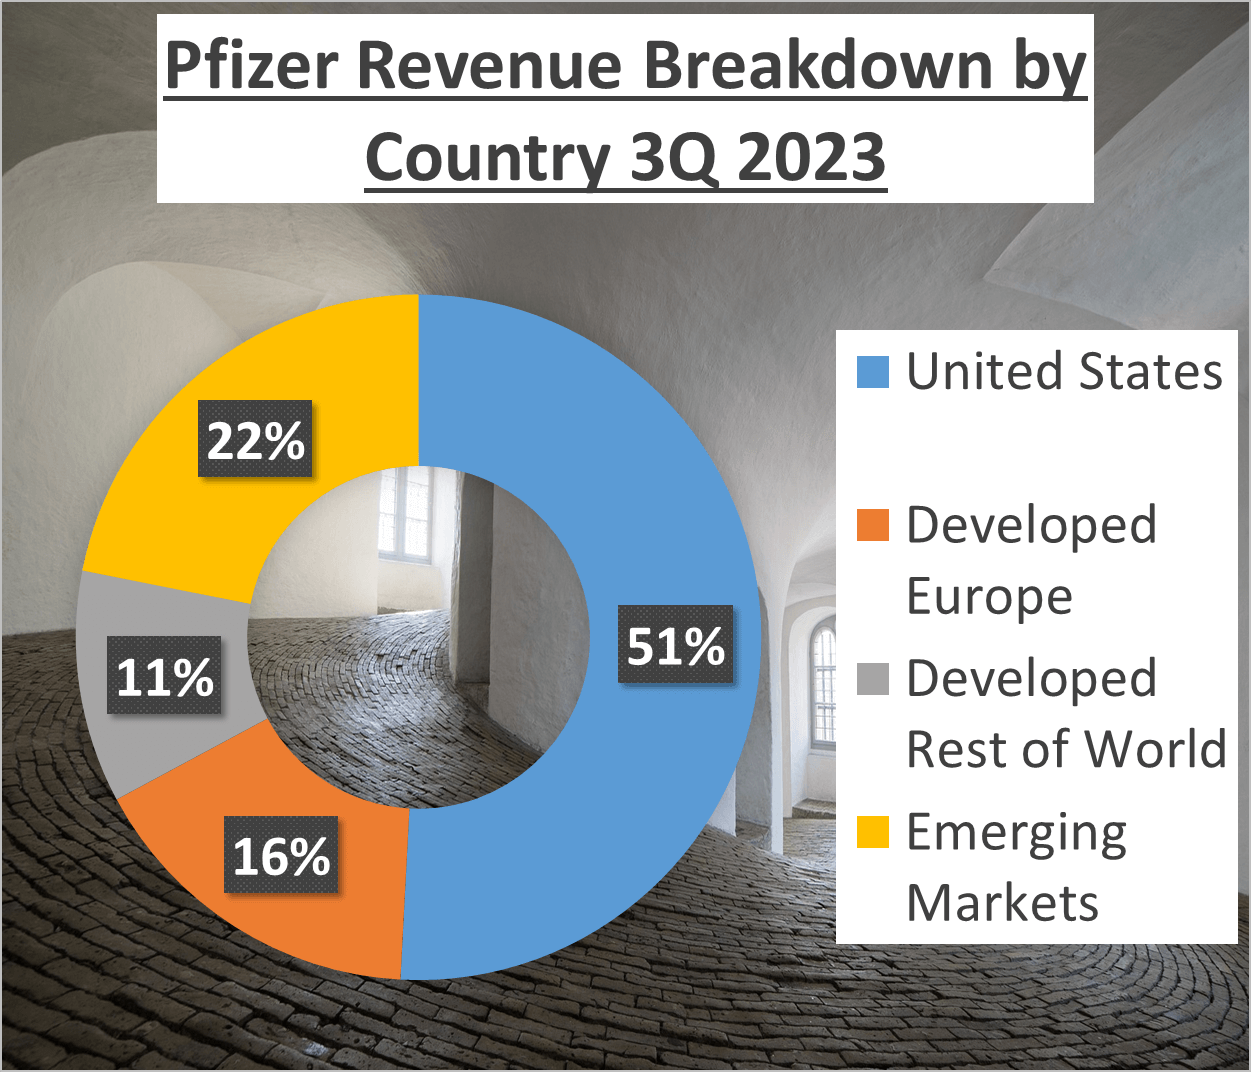
Regarding geographical distribution, Johnson & Johnson derives 54% of its revenue domestically and 46% internationally. Pfizer’s revenue breakdown is as follows: 51% from the US, 16% from Developed Europe, 11% from Developed Rest of World, and 22% from Emerging Markets.
In summary, Johnson & Johnson has maintained relatively stable total revenues, while Pfizer has experienced growth, particularly during the Covid-19 pandemic.
Profit Margins and Net Profits – JNJ vs Pfizer Stock Analysis
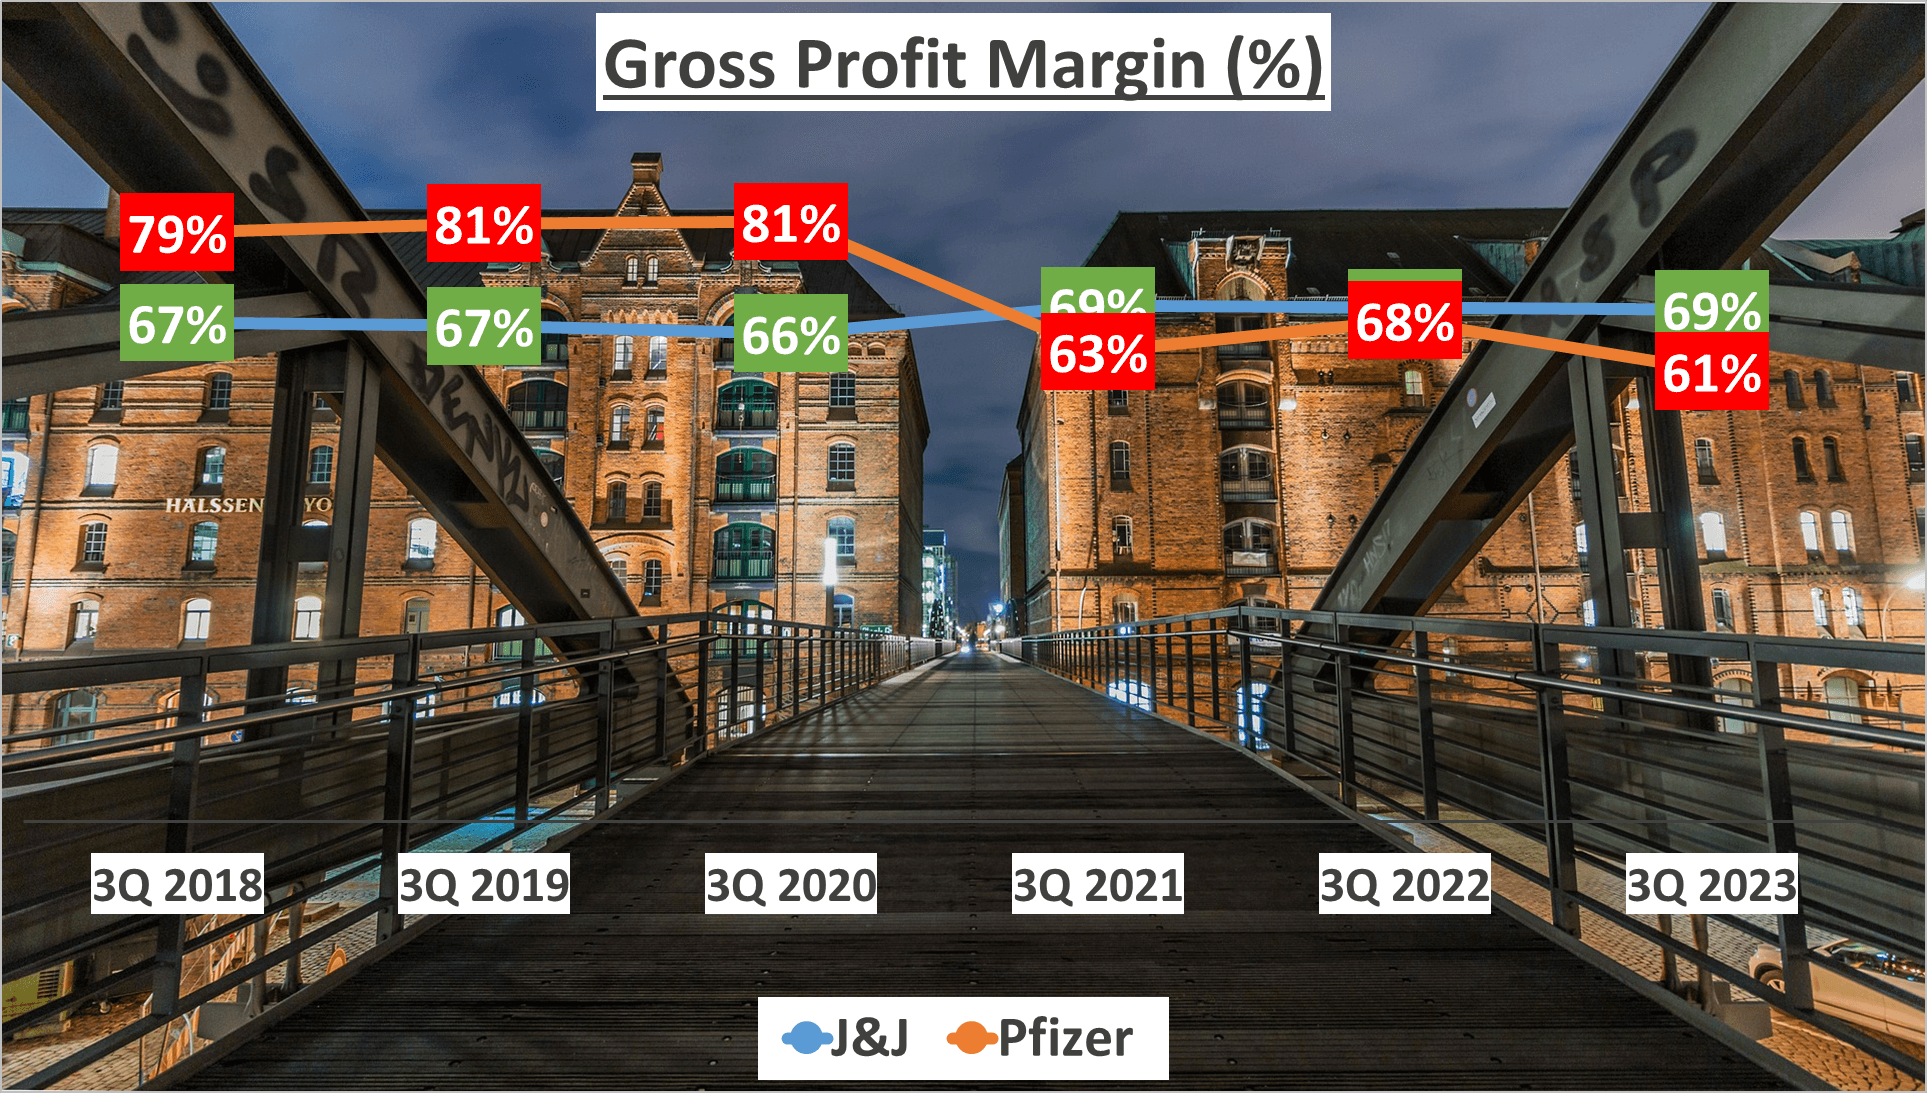
Let’s now compare their profit margins. In the last three quarters of 2023, Johnson & Johnson boasted a gross profit margin of 69%, a slight increase from their five-year average of 68%. Conversely, Pfizer’s gross profit margin stood at 61%, noticeably lower than their five-year average of 72%.
Furthermore, the net profit margins of both companies exhibited contrasting trends. Johnson & Johnson’s net profit margin soared to a remarkable 49%, nearly doubling their five-year average of 26%. This significant surge is attributed to the company’s adept management of operational costs alongside revenue growth.
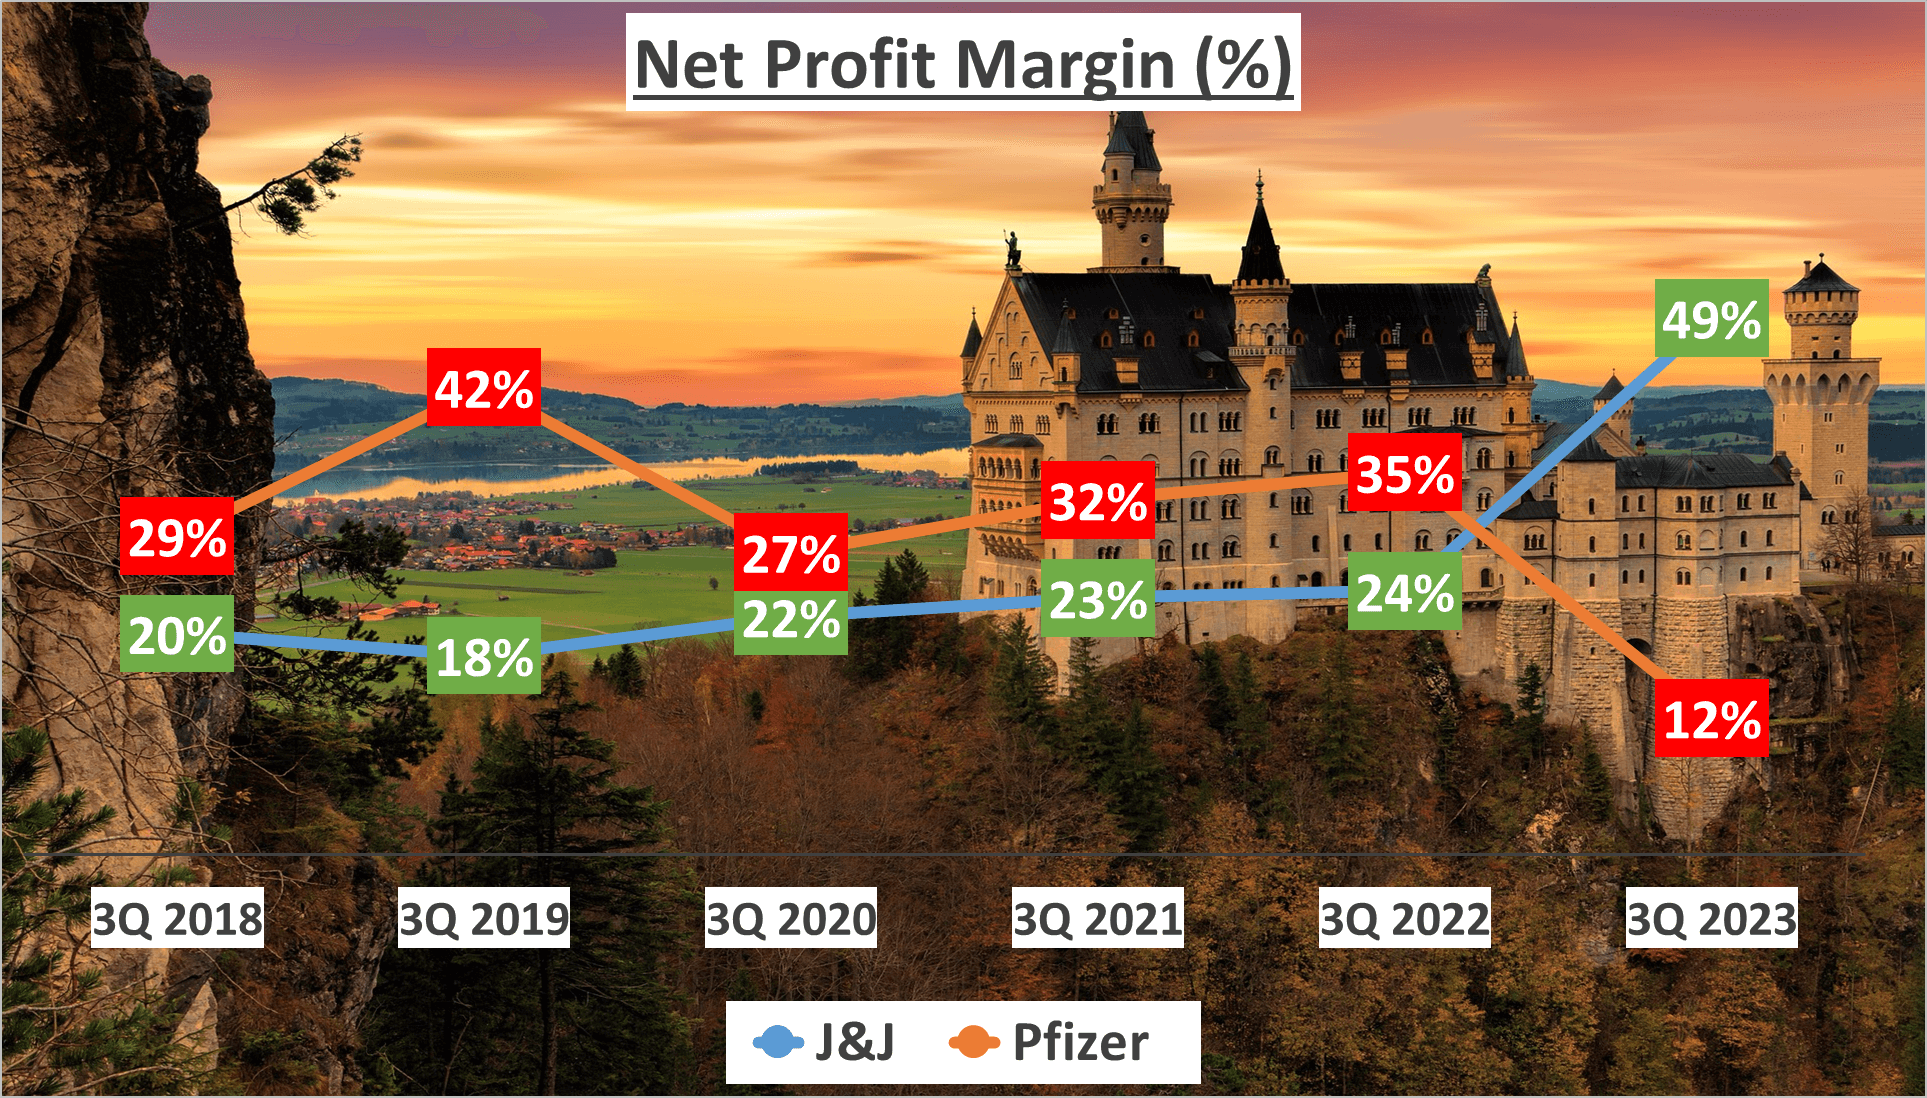
In contrast, Pfizer’s net profit margin plummeted to a mere 12% in the last three quarters of 2023, down from their five-year average of 30%. This decline can largely be ascribed to a reduction in revenue. While Pfizer’s costs remained relatively stable, the decline in revenue adversely impacted their net profit margin.
In terms of net profits, Johnson & Johnson generated a net profit of $31.1B, while Pfizer managed $5.5B in the last three quarters of 2023. Comparing this with the same period in 2018, Johnson & Johnson’s net profit grew at a compound annual growth rate of 20%, whereas Pfizer’s net profit contracted at a compound annual growth rate of negative 14%.
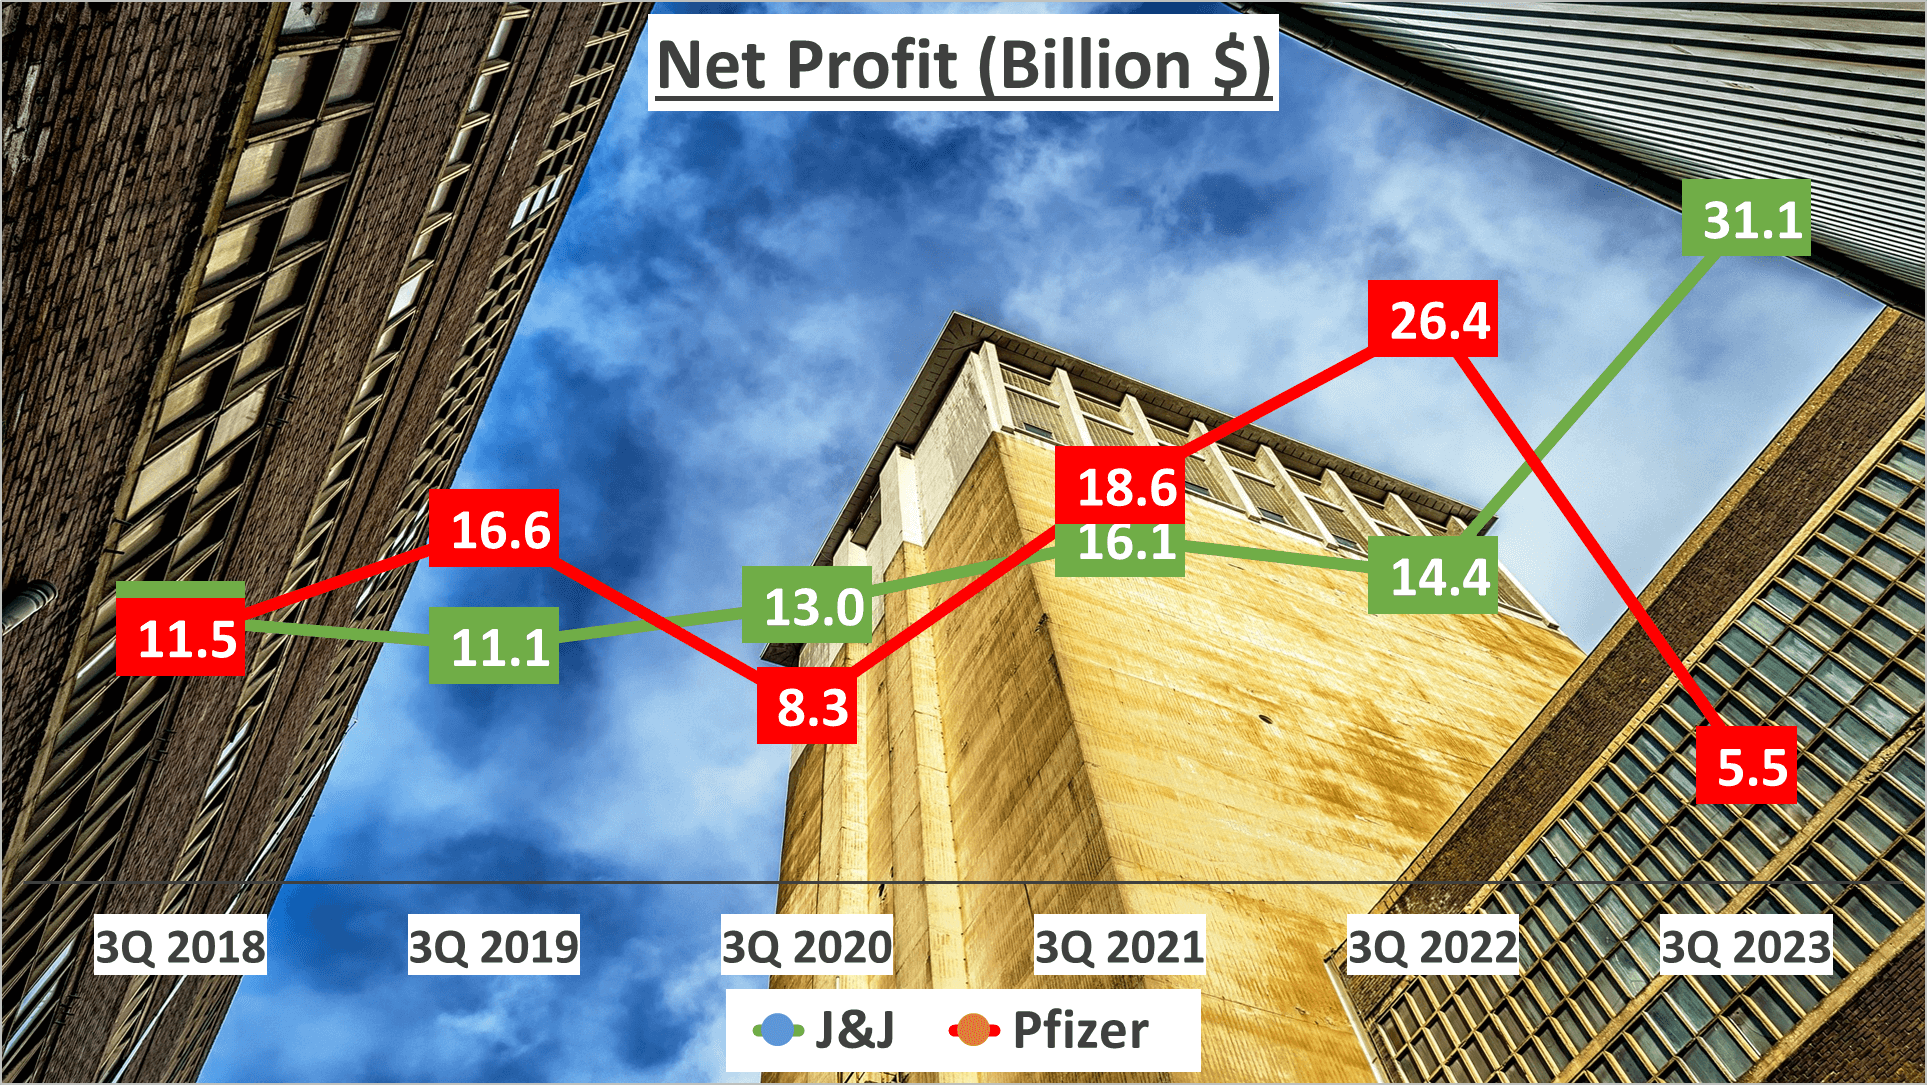
What does this signify? Despite Pfizer’s revenue growth, their profitability has been hindered by stagnant costs and declining revenue. Conversely, Johnson & Johnson, with their superior profit margins and impressive net profits, has showcased a stronger ability to convert revenue into earnings.
In terms of profitability, Johnson & Johnson outperforms Pfizer, despite the latter’s revenue growth.
Stock Performance – JNJ vs Pfizer Stock Analysis
How have the stocks of these companies fared?
Let’s take a stroll down memory lane to 2018. Suppose you had $1000 to invest. You pondered whether to invest in Johnson & Johnson or Pfizer.
Fast forward to February 2024, what would your investment look like?
If you had chosen Johnson & Johnson, your initial $1000 would have grown to $1214. That’s a 21% increase over the initial investment, with an annual growth rate of around 4%.

Not too shabby, right? But what if you had opted for Pfizer instead?
Well, it’s a different story. Your investment would have dwindled to $650. That’s a 35% decrease from your initial investment over five years. Quite a contrast, isn’t it?
Now, you might wonder, why such a stark difference? The answer lies in their business performance during this period.
Pfizer, despite its prominence in the pharmaceutical industry, experienced a decline in business performance. The company’s net profit margin significantly dropped in the third quarter of 2024 due to a revenue decline, while operating costs remained unchanged. This decline in business performance mirrored in their stock market value, explaining the drop in the value of your hypothetical investment.
On the flip side, Johnson & Johnson maintained a steady growth trajectory. Their innovative medicine and medtech sectors significantly contributed to revenue, ensuring a stable profit margin and a healthier return on investment for shareholders.
In the grand scheme, investing in a company transcends mere name or industry considerations. It’s about comprehending the company’s financial health, profit margins, and resource management.
Clearly, Johnson & Johnson has delivered a superior return for investors over the past five years.
Financial Health – JNJ vs Pfizer Stock Analysis
Let’s now assess the financial health of both companies.
As we enter the third quarter of 2023, a notable divergence emerges in their financial standings.
Johnson & Johnson’s total assets stood at a substantial $166B, while Pfizer’s total assets reached $215B. In terms of net assets, Johnson & Johnson held $71B, closely trailed by Pfizer with $97B.
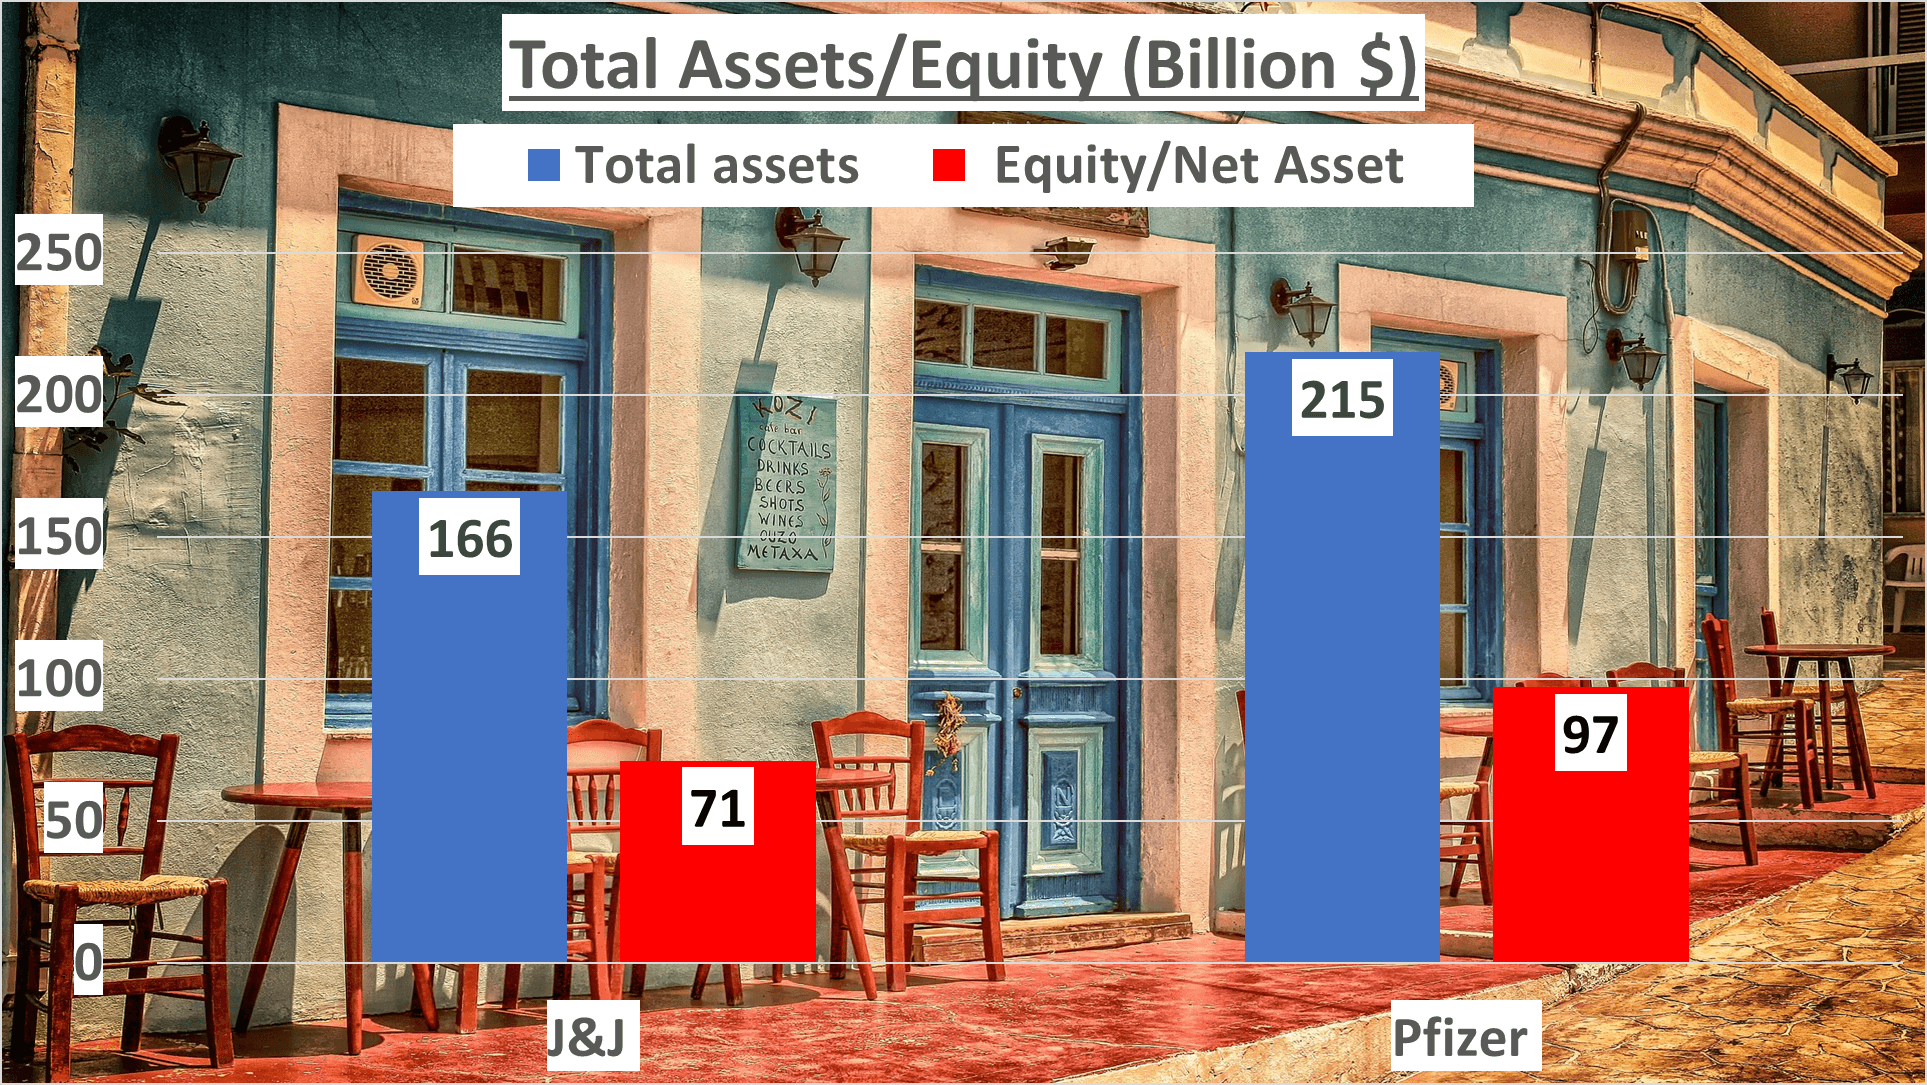
However, it’s not solely about the assets; it’s also about their utilization. The Equity to Total Assets ratio for Johnson & Johnson was 43%, while Pfizer slightly surpassed with 45%. This implies that Pfizer might be slightly more adept at generating profits from its assets.
Now, let’s shift our focus to liquidity, a critical measure of a company’s ability to meet short-term obligations. Johnson & Johnson’s Current Ratio was 1.21, whereas Pfizer boasted a significantly higher ratio of 2.38. Similarly, the Quick Ratio, a stricter liquidity gauge, was 0.96 for Johnson & Johnson and a robust 2.05 for Pfizer.
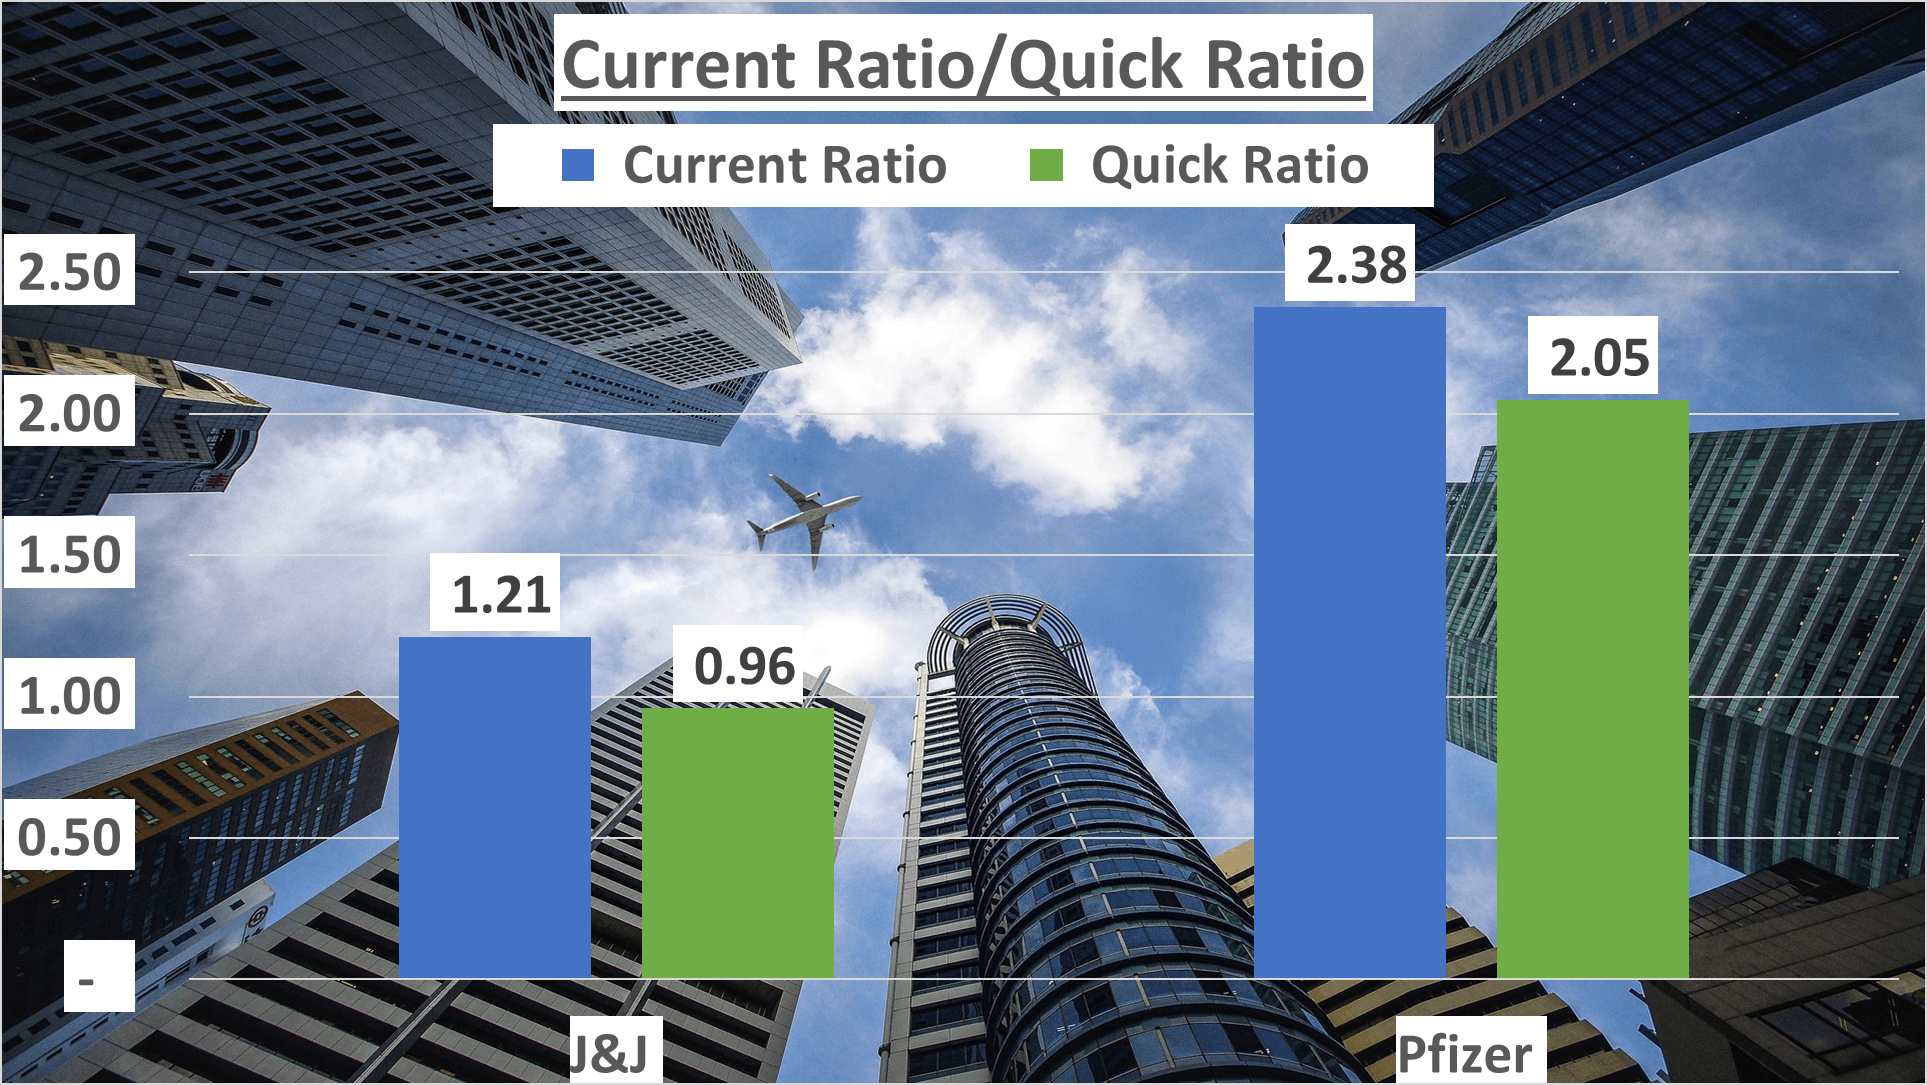
These ratios indicate that Pfizer is better positioned to handle sudden financial downturns or unforeseen expenses, akin to having a more substantial safety buffer or a larger rainy day fund.
So, what’s the takeaway from these figures and percentages? While Johnson & Johnson may have recorded higher revenues and net profits, Pfizer exhibited stronger financial ratios, suggesting better profit generation from its assets and a stronger liquidity position. This could imply Pfizer’s potential resilience in the face of financial turmoil or market fluctuations.
Despite its lower profitability, Pfizer seems to be in a stronger financial position. It’s an intriguing contrast, highlighting that financial health is just one facet of the overall picture. We’ll delve into operational efficiency and return on equity in our next analysis.
Efficiency and Return on Equity – JNJ vs Pfizer Stock Analysis
Let’s delve into the operational efficiency and return on equity of these companies.
The inventory days for Johnson & Johnson and Pfizer are quite similar, standing at 147 days and 149 days, respectively. This indicates the average number of days that both companies hold their inventory before selling it.
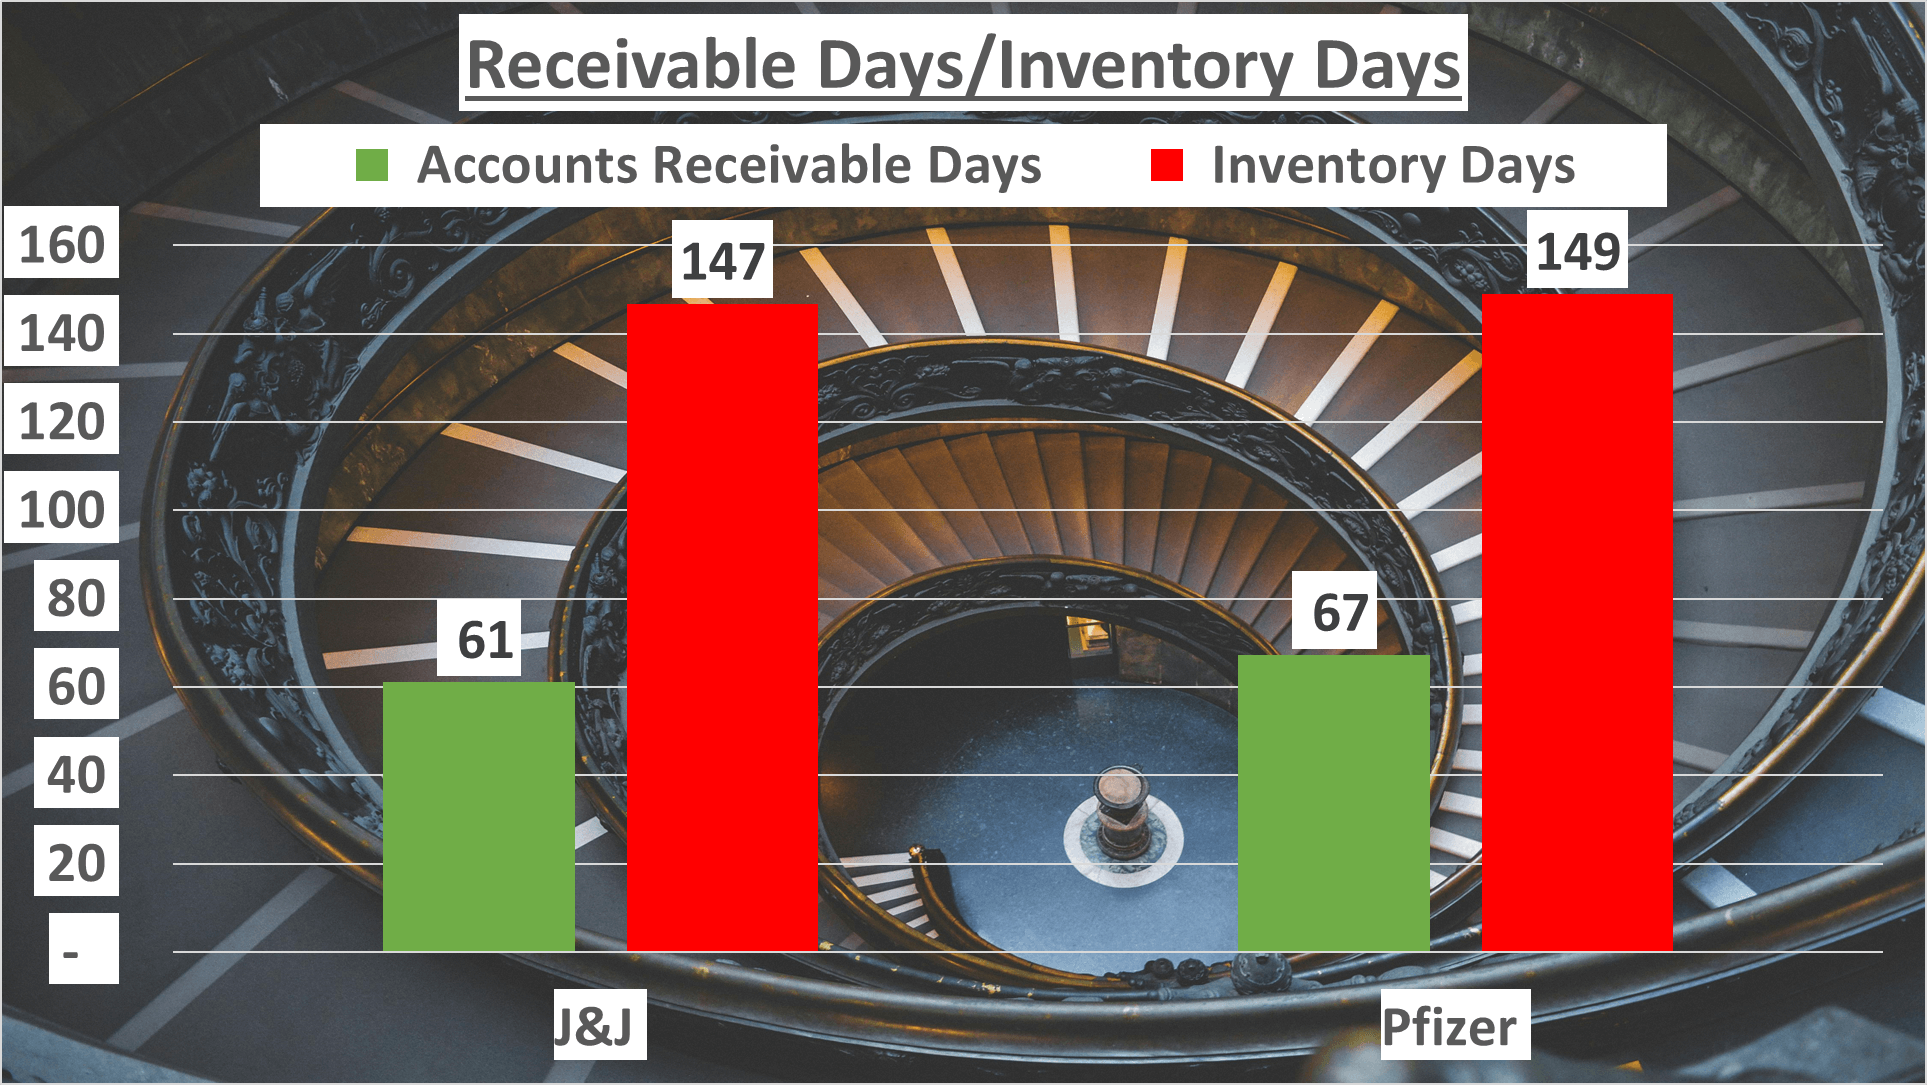
Regarding receivable days, Johnson & Johnson takes about 61 days to collect revenue after a sale, while Pfizer takes slightly longer at 67 days. Shorter receivable days signify faster collection of account receivables, a positive sign for operational efficiency.
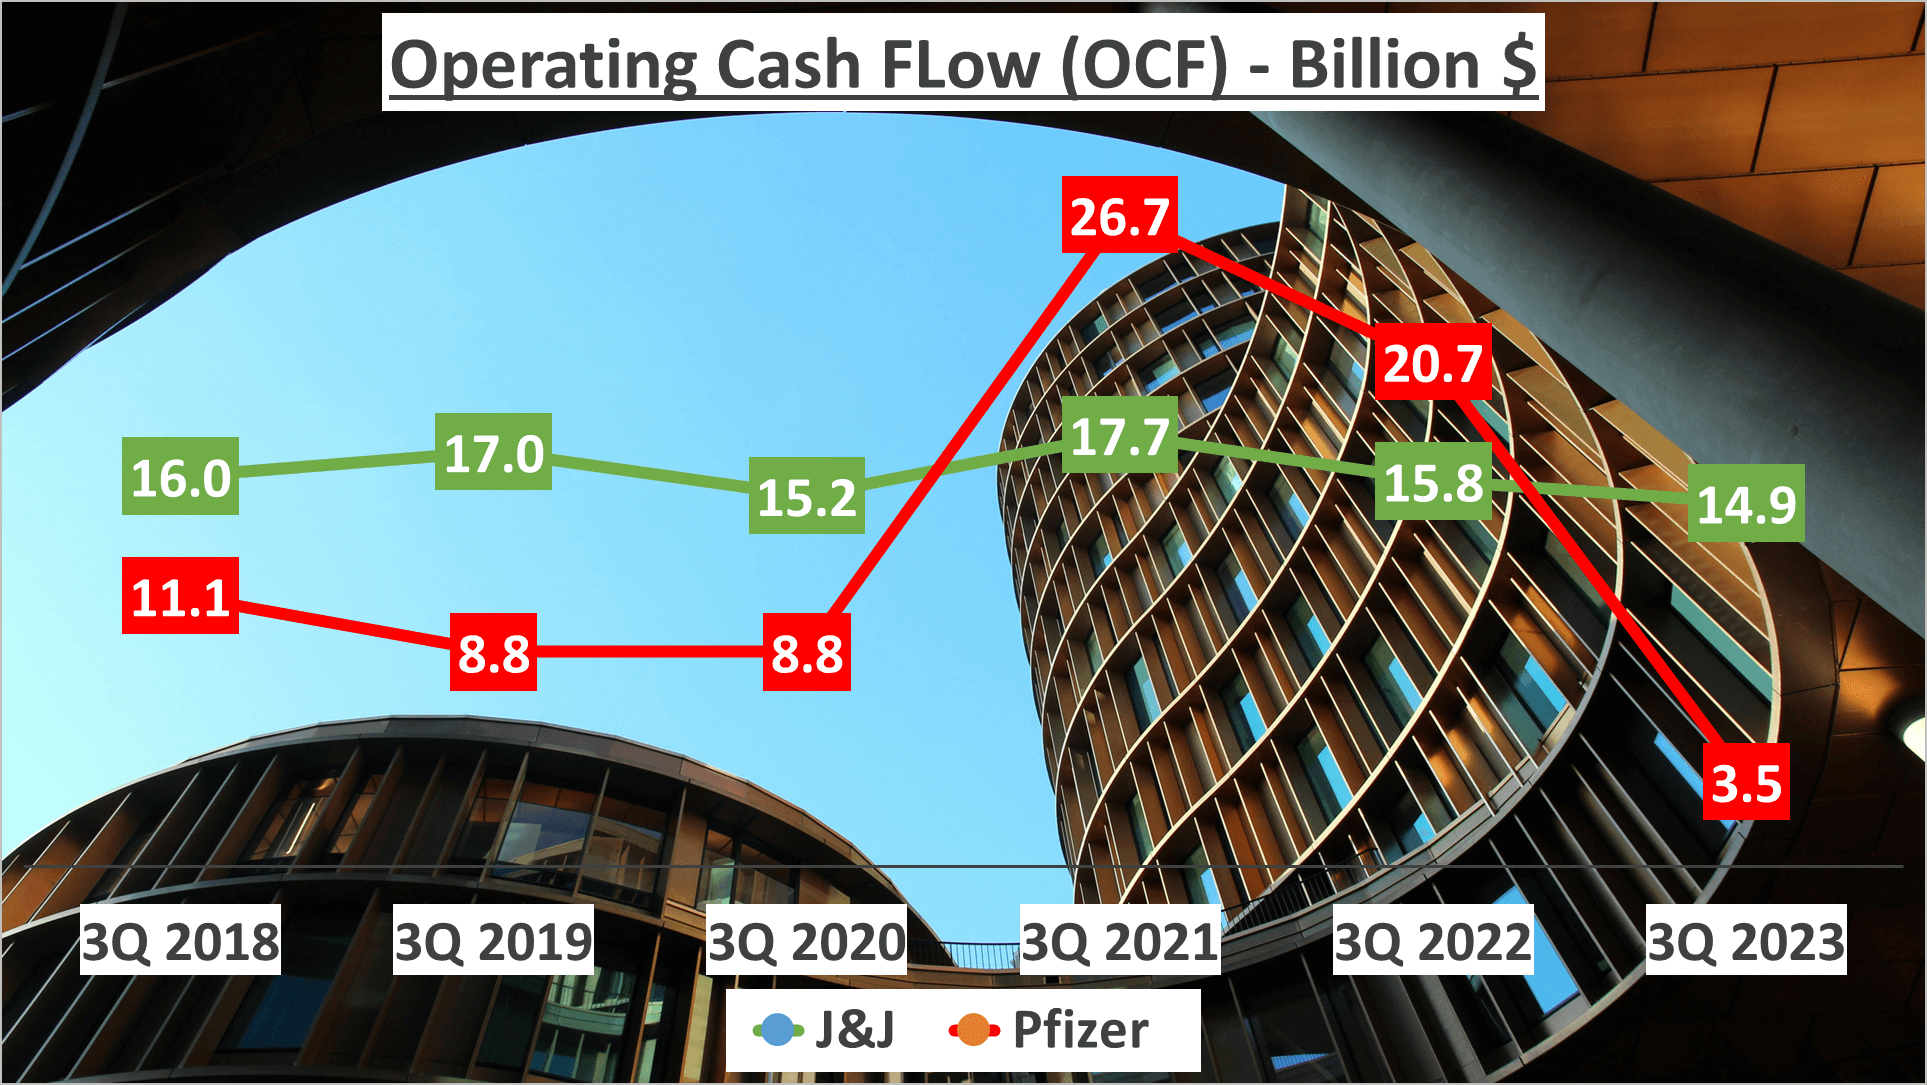
Now, onto cash flows. Johnson & Johnson’s operating cash flow stands at $14.9B, significantly higher than Pfizer’s $3.5B. This suggests that Johnson & Johnson is generating more cash from its core business operations.
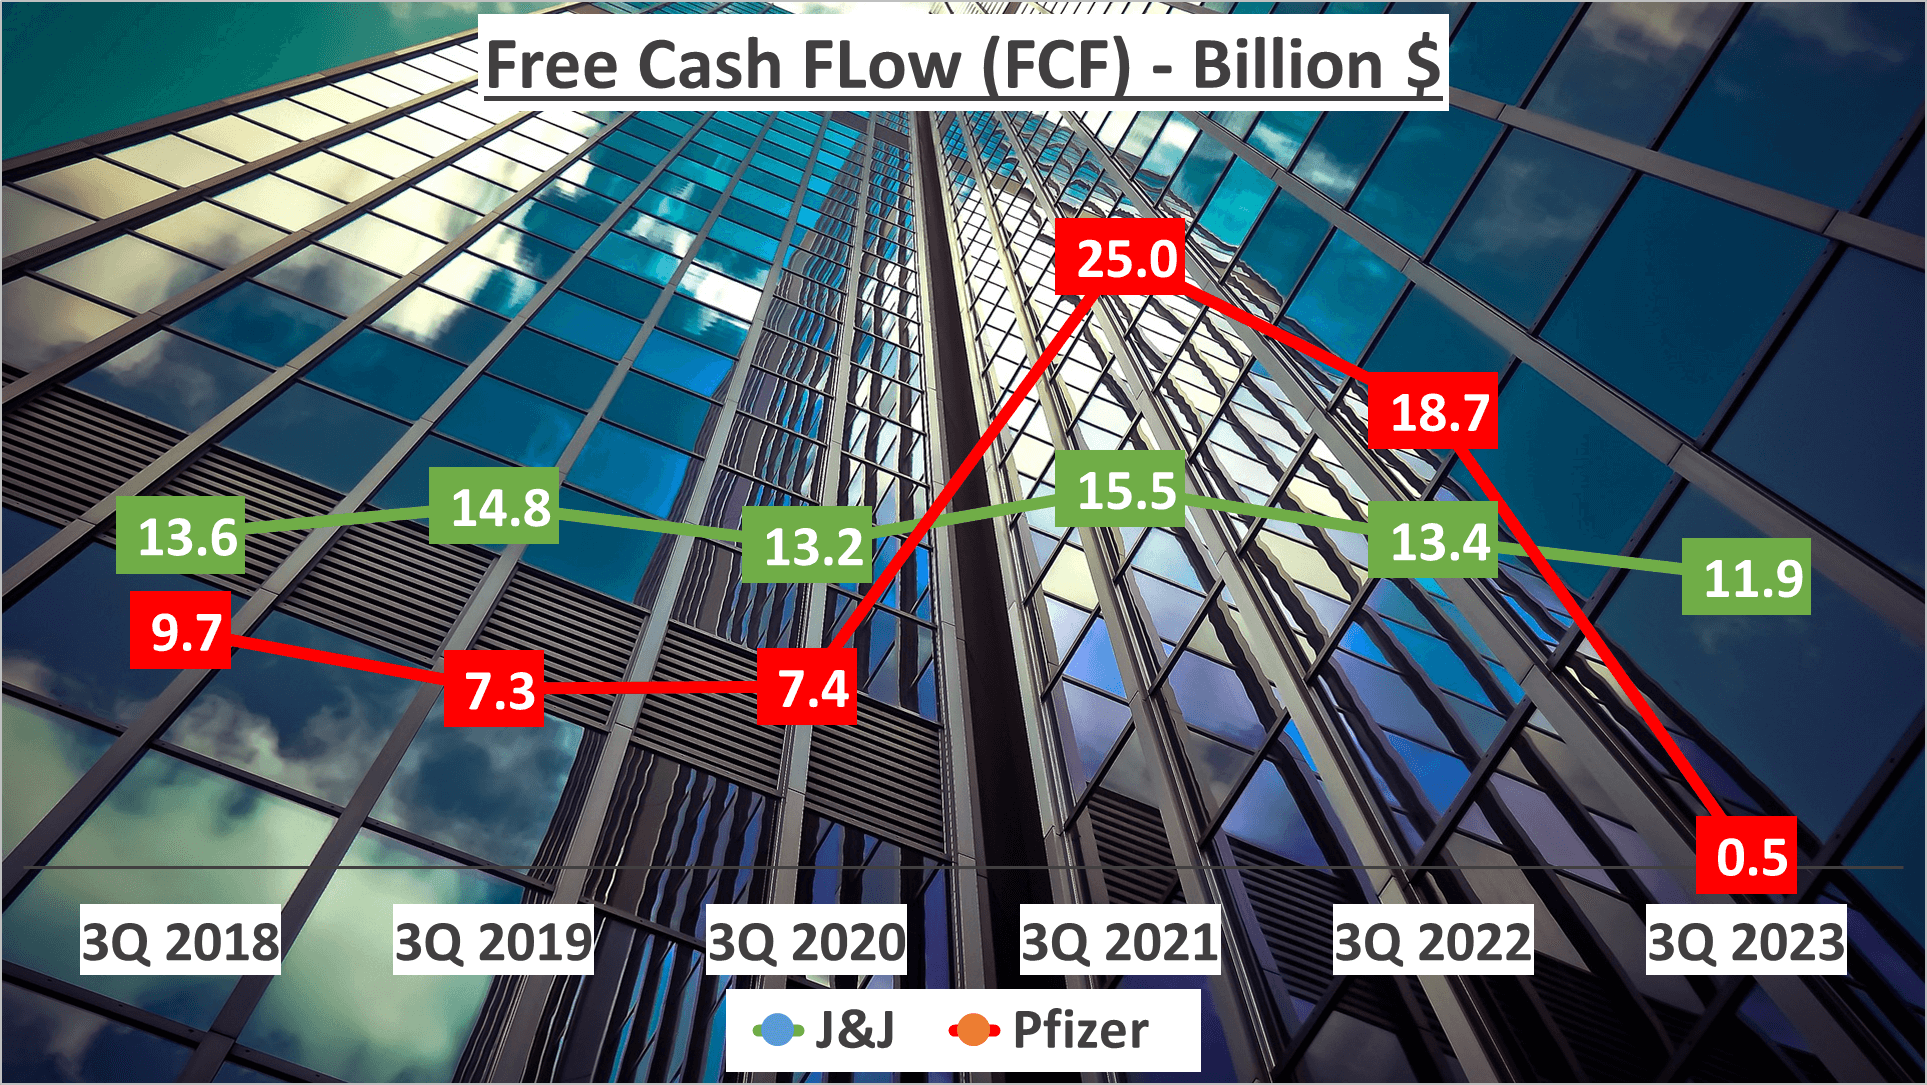
Furthermore, Johnson & Johnson’s free cash flow, representing the cash generated after laying out the money required to maintain or expand its asset base, is at $11.9B. In contrast, Pfizer’s free cash flow is just $0.5B. Both companies have experienced a decline in cash flows over the years, with Pfizer facing a sharper decrease.
Now, let’s discuss return on equity (ROE), a measure of financial performance. Johnson & Johnson boasts an ROE of 58%, much higher than Pfizer’s 8%. This indicates that Johnson & Johnson is more efficient at generating income from the investment received from its shareholders.
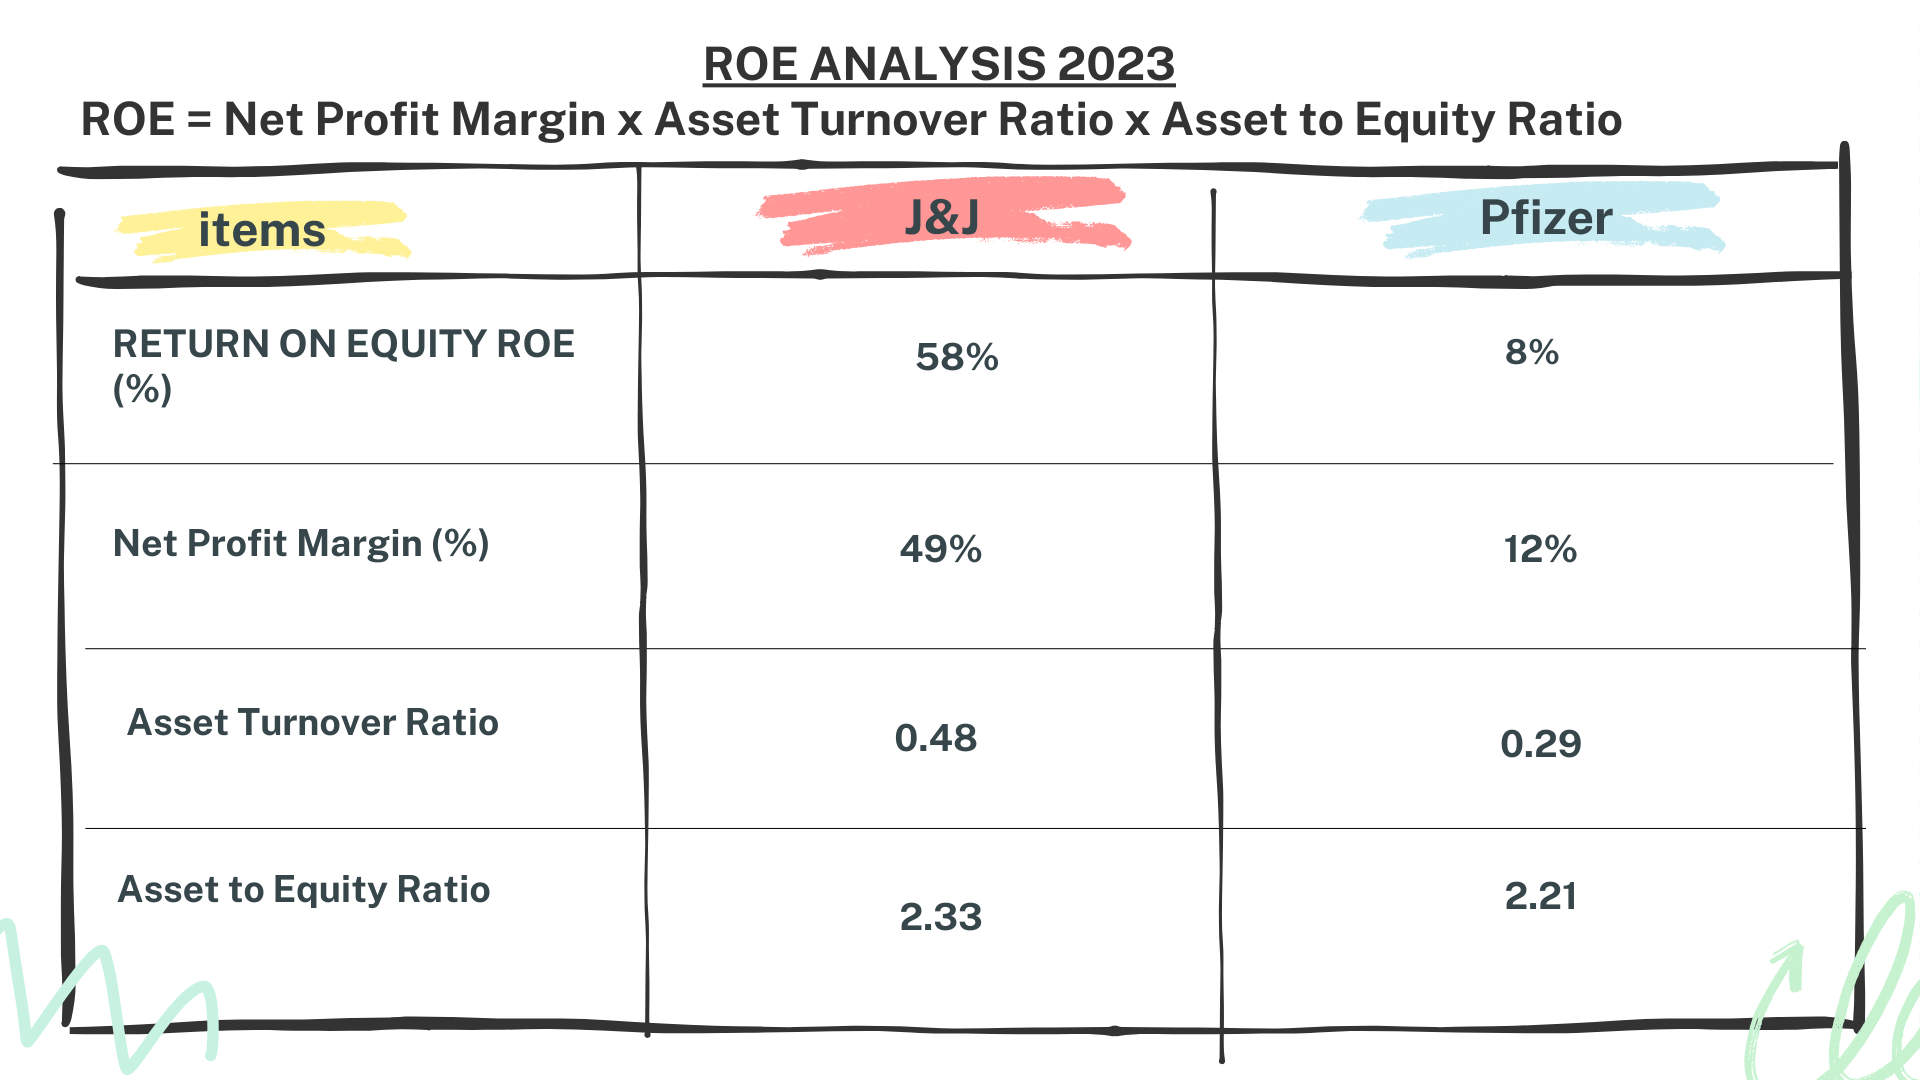
In conclusion, considering operational efficiency and return on equity, Johnson & Johnson once again outperforms Pfizer. It’s important to remember that these metrics are just part of the bigger picture, and investors should always consider multiple factors before making investment decisions.
Conclusion – JNJ vs Pfizer Stock Analysis
So, what’s the verdict?
After a comprehensive assessment, it’s evident that Johnson & Johnson has consistently outperformed Pfizer in terms of profitability and operational efficiency.
Despite Pfizer having a stronger financial position, it hasn’t been able to capitalize as effectively.
In the realm of investing, understanding a company’s performance goes beyond mere numbers; it’s also about how these numbers are achieved.
Remember to subscribe to our channel for the latest videos, and feel free to let us know in the comments which company you would like us to analyze next.
Author: investforcus.com
Follow us on Youtube: The Investors Community

