MARA Stock Analysis – Have you ever pondered the potential outcomes of investing $1000 in Marathon Digital back in 2018?
Let’s rewind the clock and revisit history. By February 2024, that initial investment would have surged to a remarkable $20,271, marking an astonishing growth of 1927%.

In simpler terms, your $1000 would have multiplied by 20, with an annual growth rate of an impressive 83%.
While these figures may seem surreal, they are a testament to Marathon Digital’s exceptional financial and operational performance over the years.
But what fueled this explosive growth? Was it mere chance, or the result of meticulously executed strategies and favorable market dynamics? And what insights can we glean from Marathon Digital’s journey to inform our future investment decisions?
To answer these questions, we must delve into Marathon Digital’s financial metrics. We’ll analyze its revenue growth, profit margins, net profits, asset management, current ratio, cash flow, and conduct a thorough Dupont Analysis to gauge its financial robustness.
Join me as we embark on this voyage of exploration. Let’s unravel the numbers, strategies, and market forces that have propelled Marathon Digital’s trajectory from 2018 to 2024. Let’s heed the lessons offered by hindsight and leverage these insights to make informed investment choices in the future.
Now, let’s delve deeper into the financial and operational landscape of Marathon Digital to unravel the secrets behind its remarkable growth.
Revenue Analysis – MARA Stock Analysis
To comprehend Marathon Digital’s growth trajectory, let’s dissect their revenue figures. Over the last three quarters of 2023, the company amassed an impressive $231M in revenue.
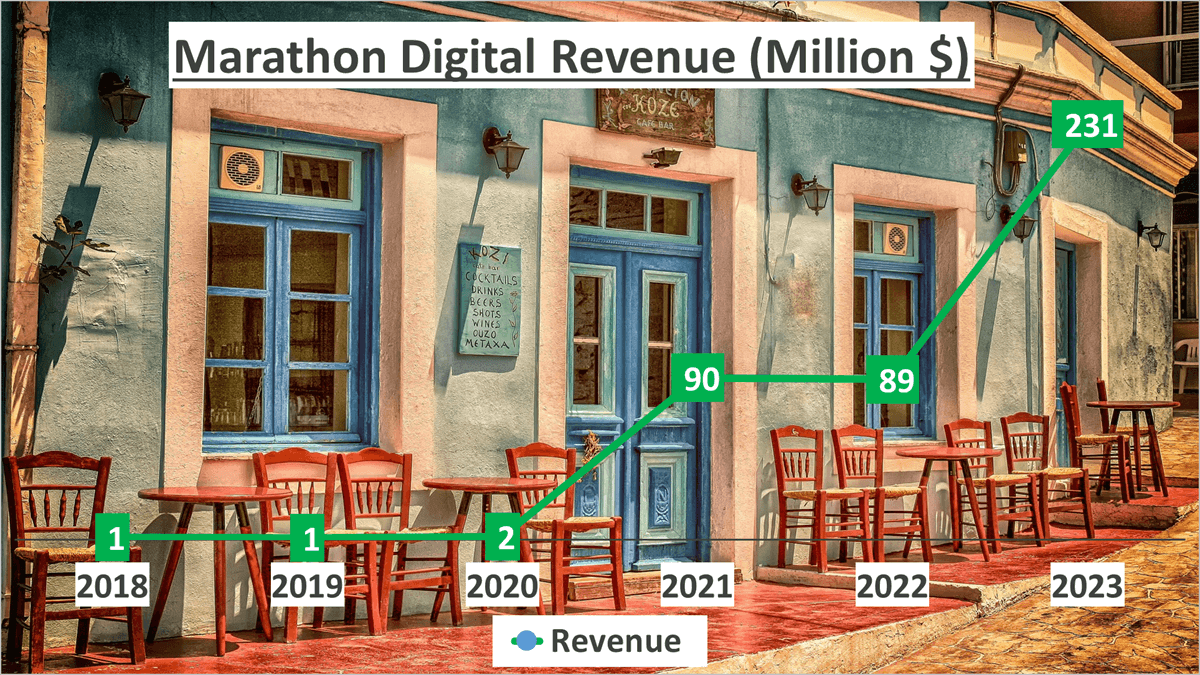
Now, let’s contextualize this. Since 2018, this reflects an astounding annual compound growth rate (CAGR) of 182%.
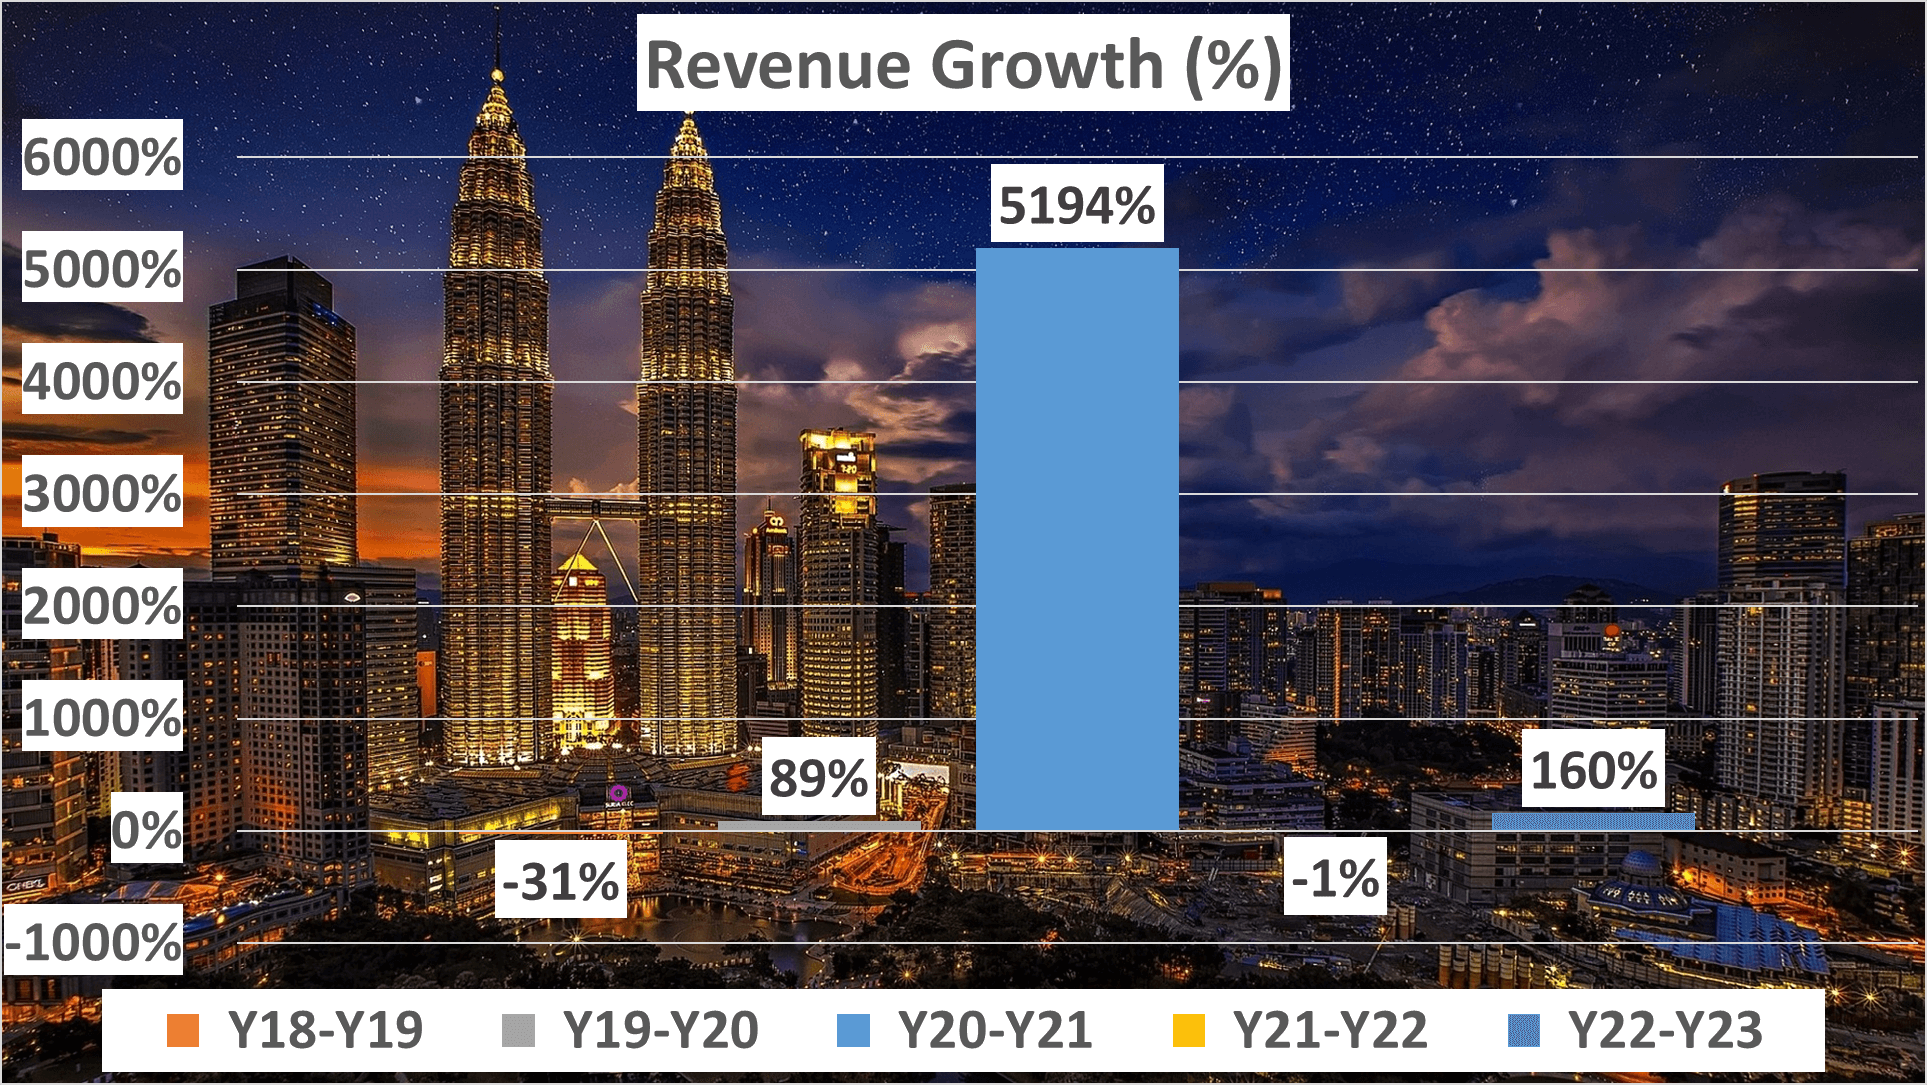
However, Marathon Digital’s revenue journey hasn’t been a linear ascent; it’s resembled more of a rollercoaster ride. From 2018 to 2019, the company experienced a 31% revenue decline. Yet, they rebounded vigorously in 2020 with an 89% growth, followed by a staggering 5,194% surge in 2021. Although there was a slight 1% dip in 2022, Marathon Digital regained momentum in 2023 with a robust 160% growth.
Breaking down Marathon Digital’s revenue sources reveals their primary income streams. A significant 85% of revenue originates from Block rewards, with Participant contributing 10% and Transaction fees comprising a minor 4%.
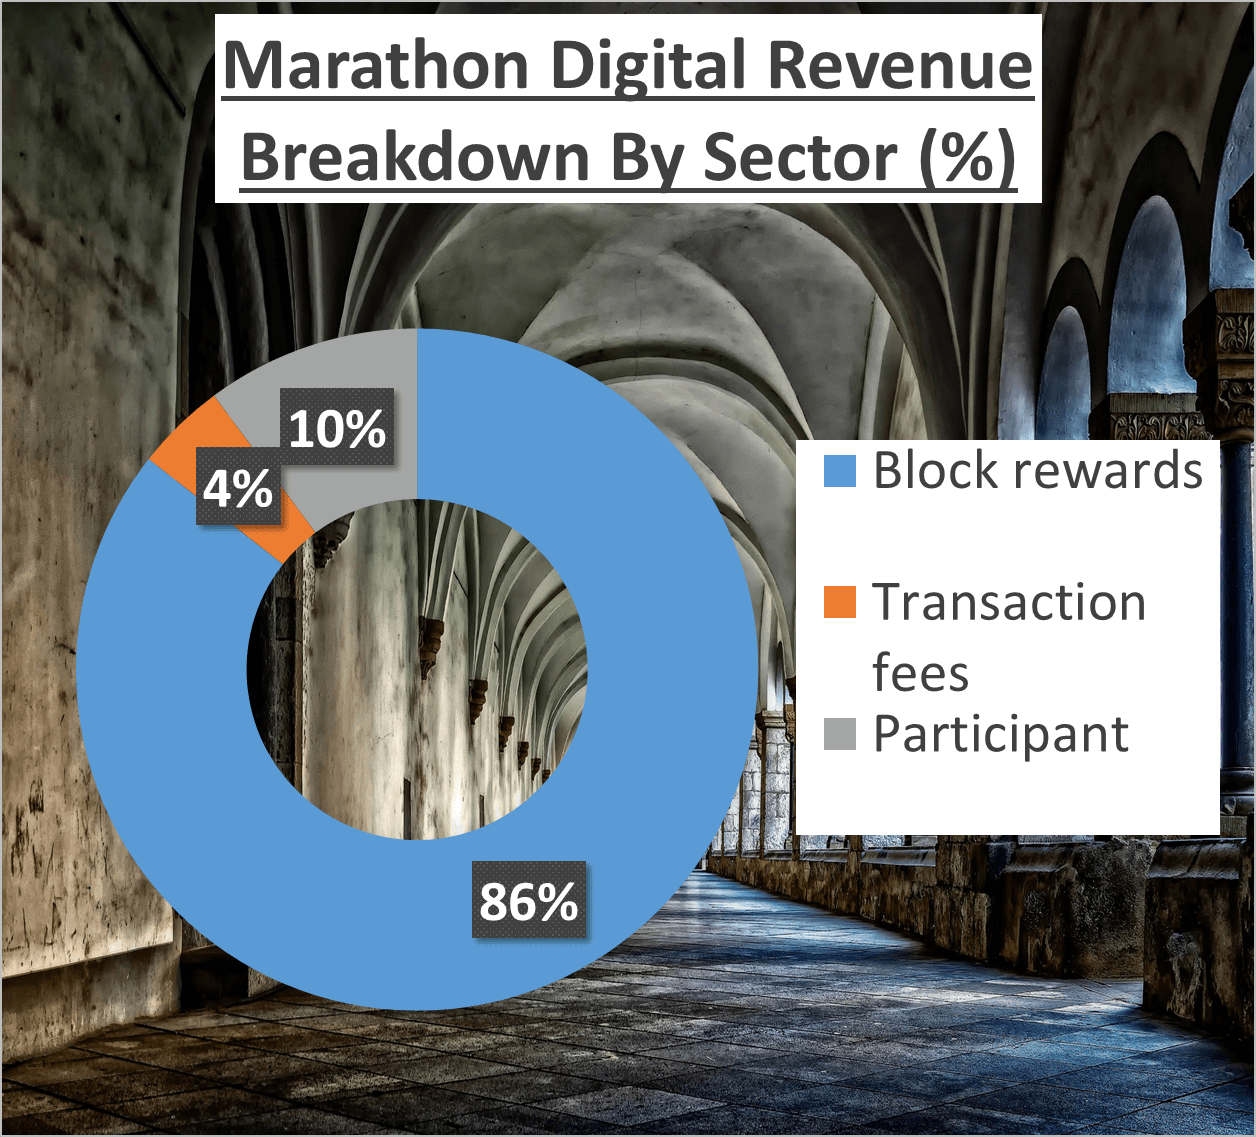
Understanding these figures unveils Marathon Digital’s business model dynamics, resilience amidst market fluctuations, and adeptness in seizing growth opportunities. It’s not just about the end numbers; it’s about the journey.
Impressive, isn’t it? But let’s not halt here. Let’s delve deeper into their Profit Margin.
Profit Margin and Net Profit – MARA Stock Analysis
Profit margins offer valuable insights into a company’s financial well-being, often surpassing the significance of revenue figures alone. Let’s delve into Marathon Digital’s profit margins.
In the last three quarters of 2023, Marathon Digital encountered a peculiar scenario regarding its profit margins. The Gross Profit Margin was -11%, potentially raising eyebrows as it implies that the company’s cost of goods sold exceeded its revenue. However, before drawing conclusions, let’s examine the Net Profit Margin.
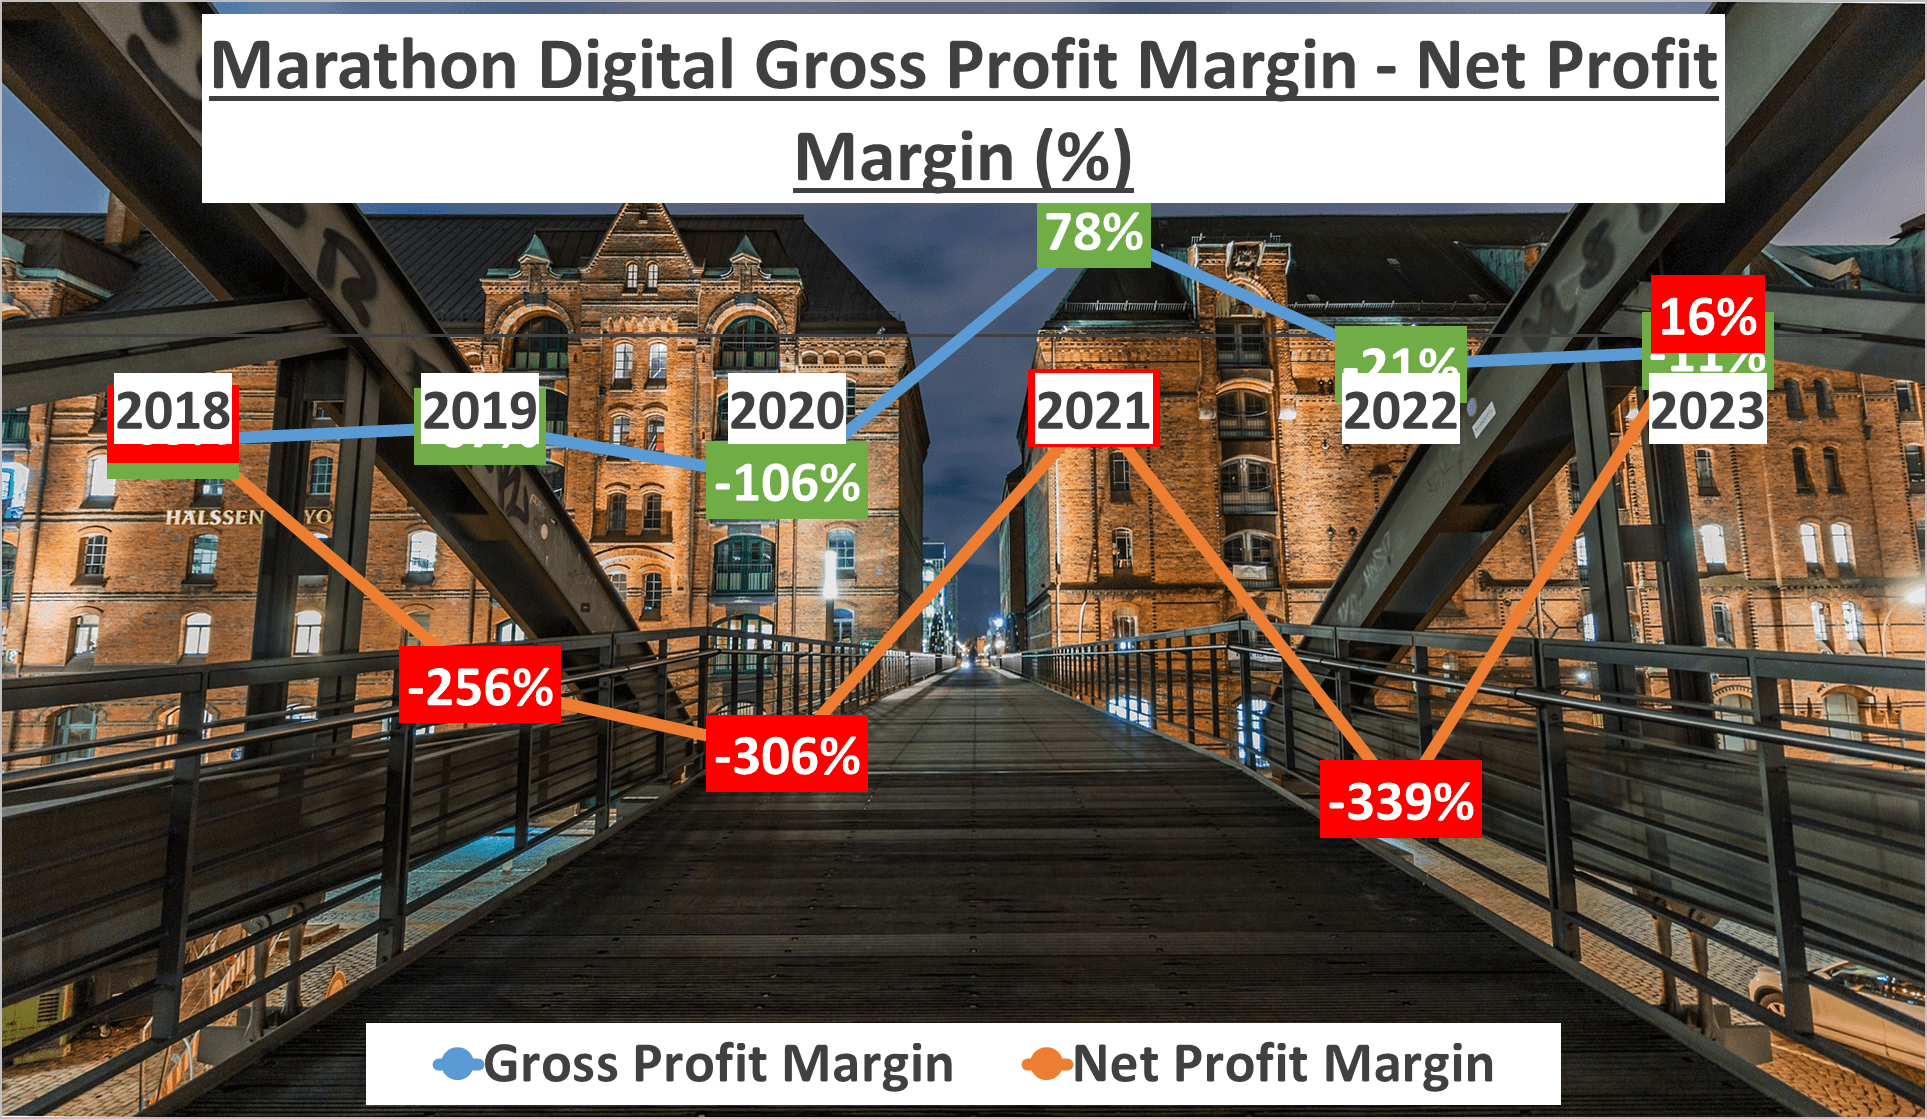
Remarkably, the Net Profit Margin for the same period stood at a positive 16%. This crucial metric indicates that despite the negative Gross Profit Margin, Marathon Digital maintained profitability after accounting for all operational expenses, interest, taxes, and other outlays.
Although a 16% Net Profit Margin may appear modest at first glance, considering the company’s financial history, it assumes greater significance. For the first time since 2018, Marathon Digital reported a positive Net Profit, amounting to $36M in the last three quarters of 2023.

This shift to profitability bodes well for Marathon Digital and its stakeholders. It signifies the company’s strategic decisions and investments bearing fruit, positioning it on a trajectory of growth. Investors keenly evaluate a company’s profitability as a pivotal factor in their investment decisions. Marathon Digital’s transition from losses to profitability may signal favorable prospects for its stock.
In conclusion, while the negative Gross Profit Margin raises concerns, the positive Net Profit Margin and the shift to profitability offer promising indicators for Marathon Digital. But what lies ahead in terms of its assets? That’s a tale for the next installment. Stay tuned.
Cash Flow and Dupont Analysis – MARA Stock Analysis
Cash flow serves as the lifeblood of any business. Let’s assess Marathon Digital’s performance in this regard. Interestingly, the last three quarters of 2023 present a paradox. Marathon Digital’s Operating Cash Flow registers at -$224M, with Free Cash Flow trailing behind at -$337M.
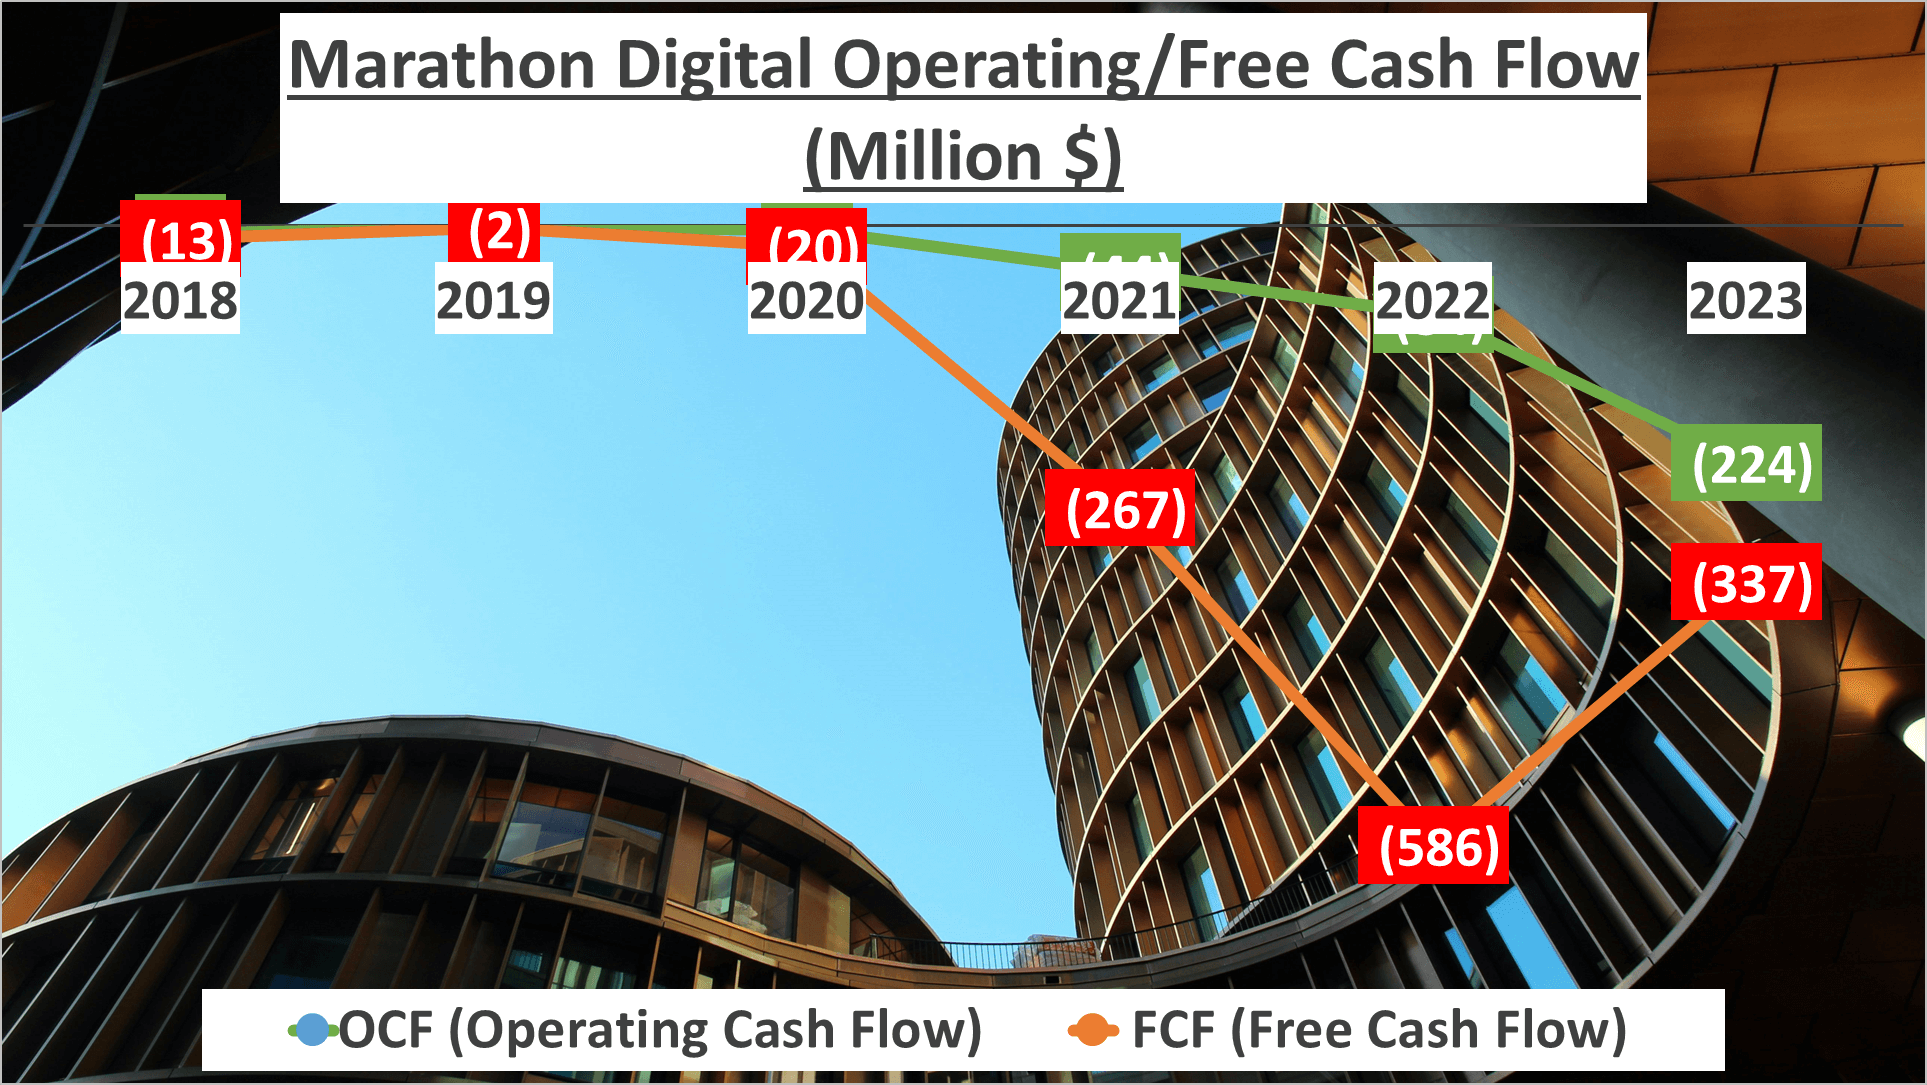
This implies that more money is flowing out of the business than flowing in, despite the positive net profit of $36M for the same period. Such a scenario warrants a deeper exploration to decipher the underlying dynamics.
Enter Dupont Analysis—a method dissecting Return on Equity (ROE) into three components for a nuanced understanding of a company’s financial well-being. These components include Net Profit Margin, Asset Turnover, and Asset to Equity.
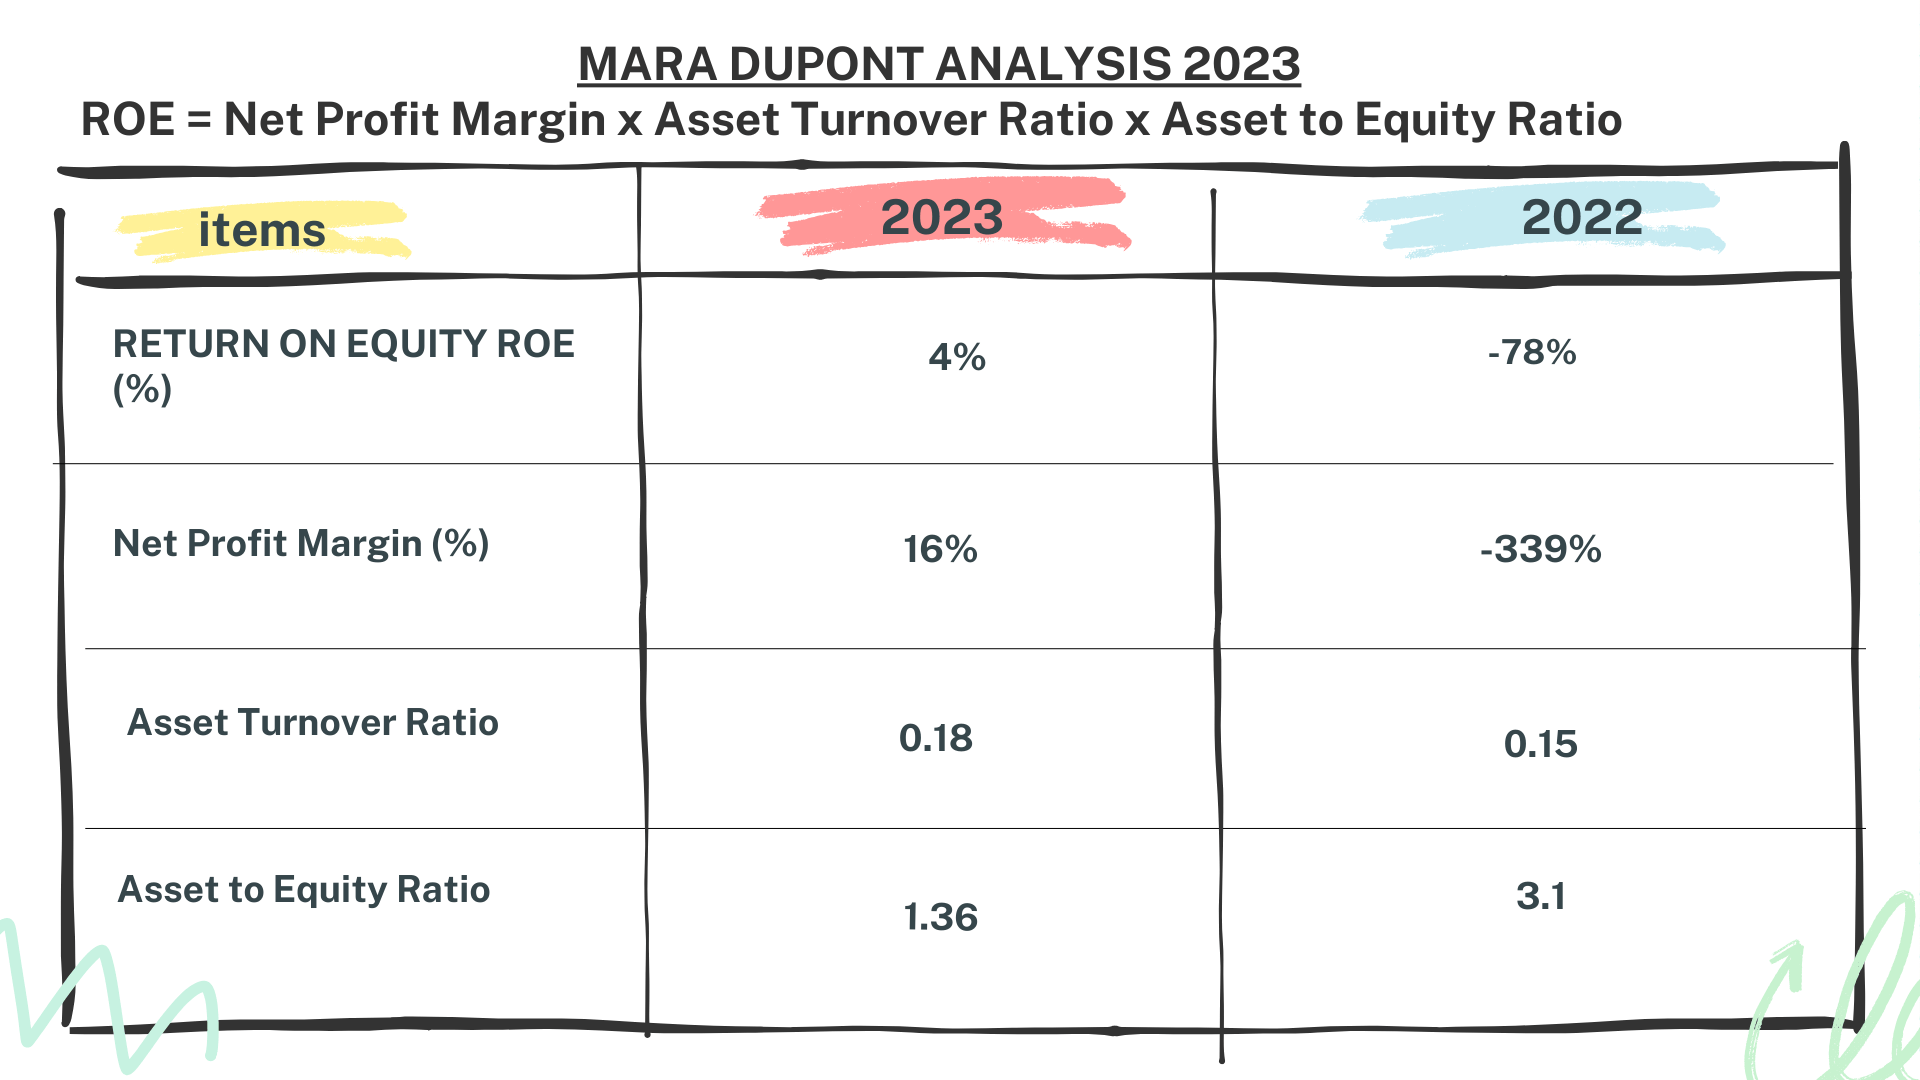
In the last three quarters of 2023, Marathon Digital boasts an ROE of 4%, marking a significant improvement from the negative 78% recorded in the corresponding period of 2022. The Net Profit Margin, reflecting the company’s profitability, stands at 16%, a substantial leap from the negative 339% in 2022.
Next, the Asset Turnover ratio, indicating the efficiency of asset utilization in generating sales, stands at 0.18 in 2023, slightly up from 0.15 the previous year.
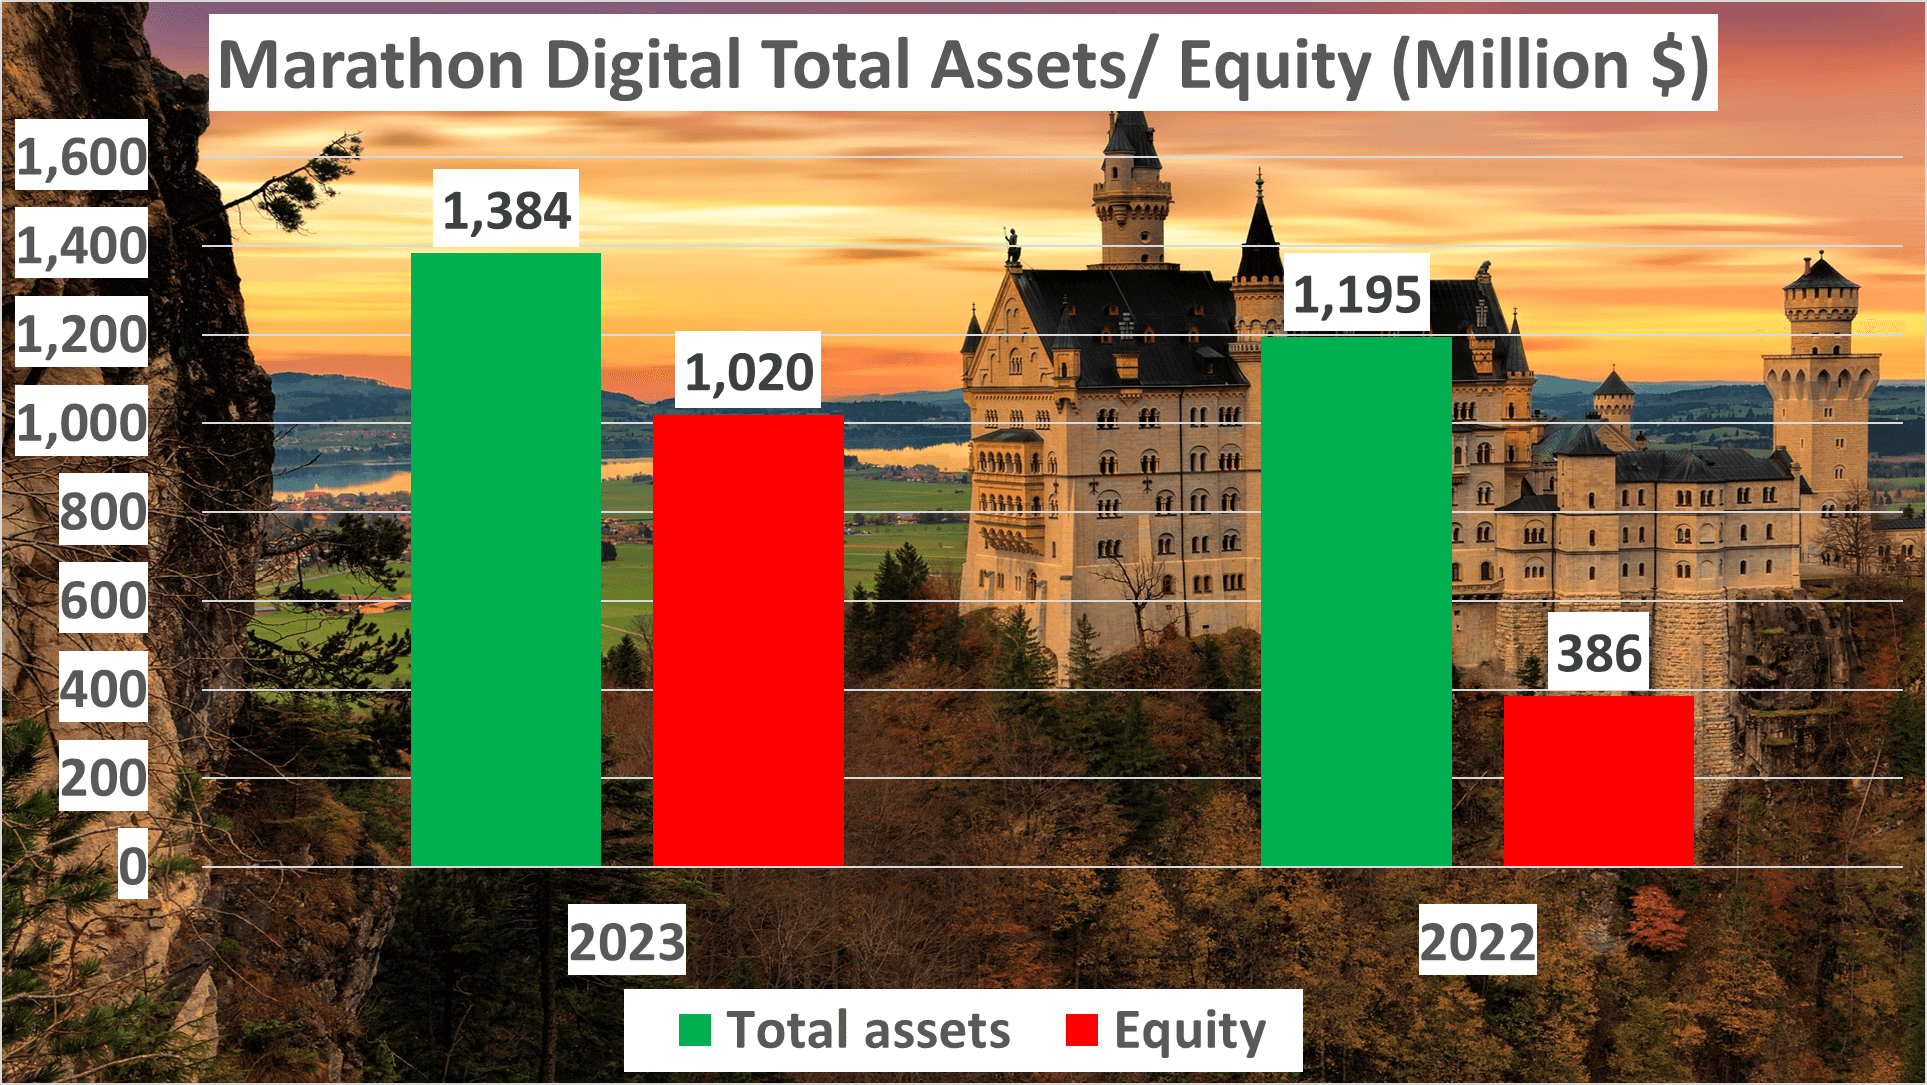
Lastly, the Asset to Equity ratio, signifying the balance between assets and equity, stands at 1.36 in 2023, down from 3.1 in 2022, suggesting a more balanced financial structure.
In conclusion, we’ve conducted a comprehensive analysis of Marathon Digital’s financial and business landscape. Don’t forget to subscribe to our channel for more insightful analyses, and feel free to suggest companies for our future analyses.
Author: investforcus.com
Follow us on Youtube: The Investors Community

