The Fast Food Titans – McDonald’s vs Burger King Stock Analysis, Curious about how the financials of the world’s top fast-food chains, McDonald’s and Burger King, compare? Let’s dive into the numbers.
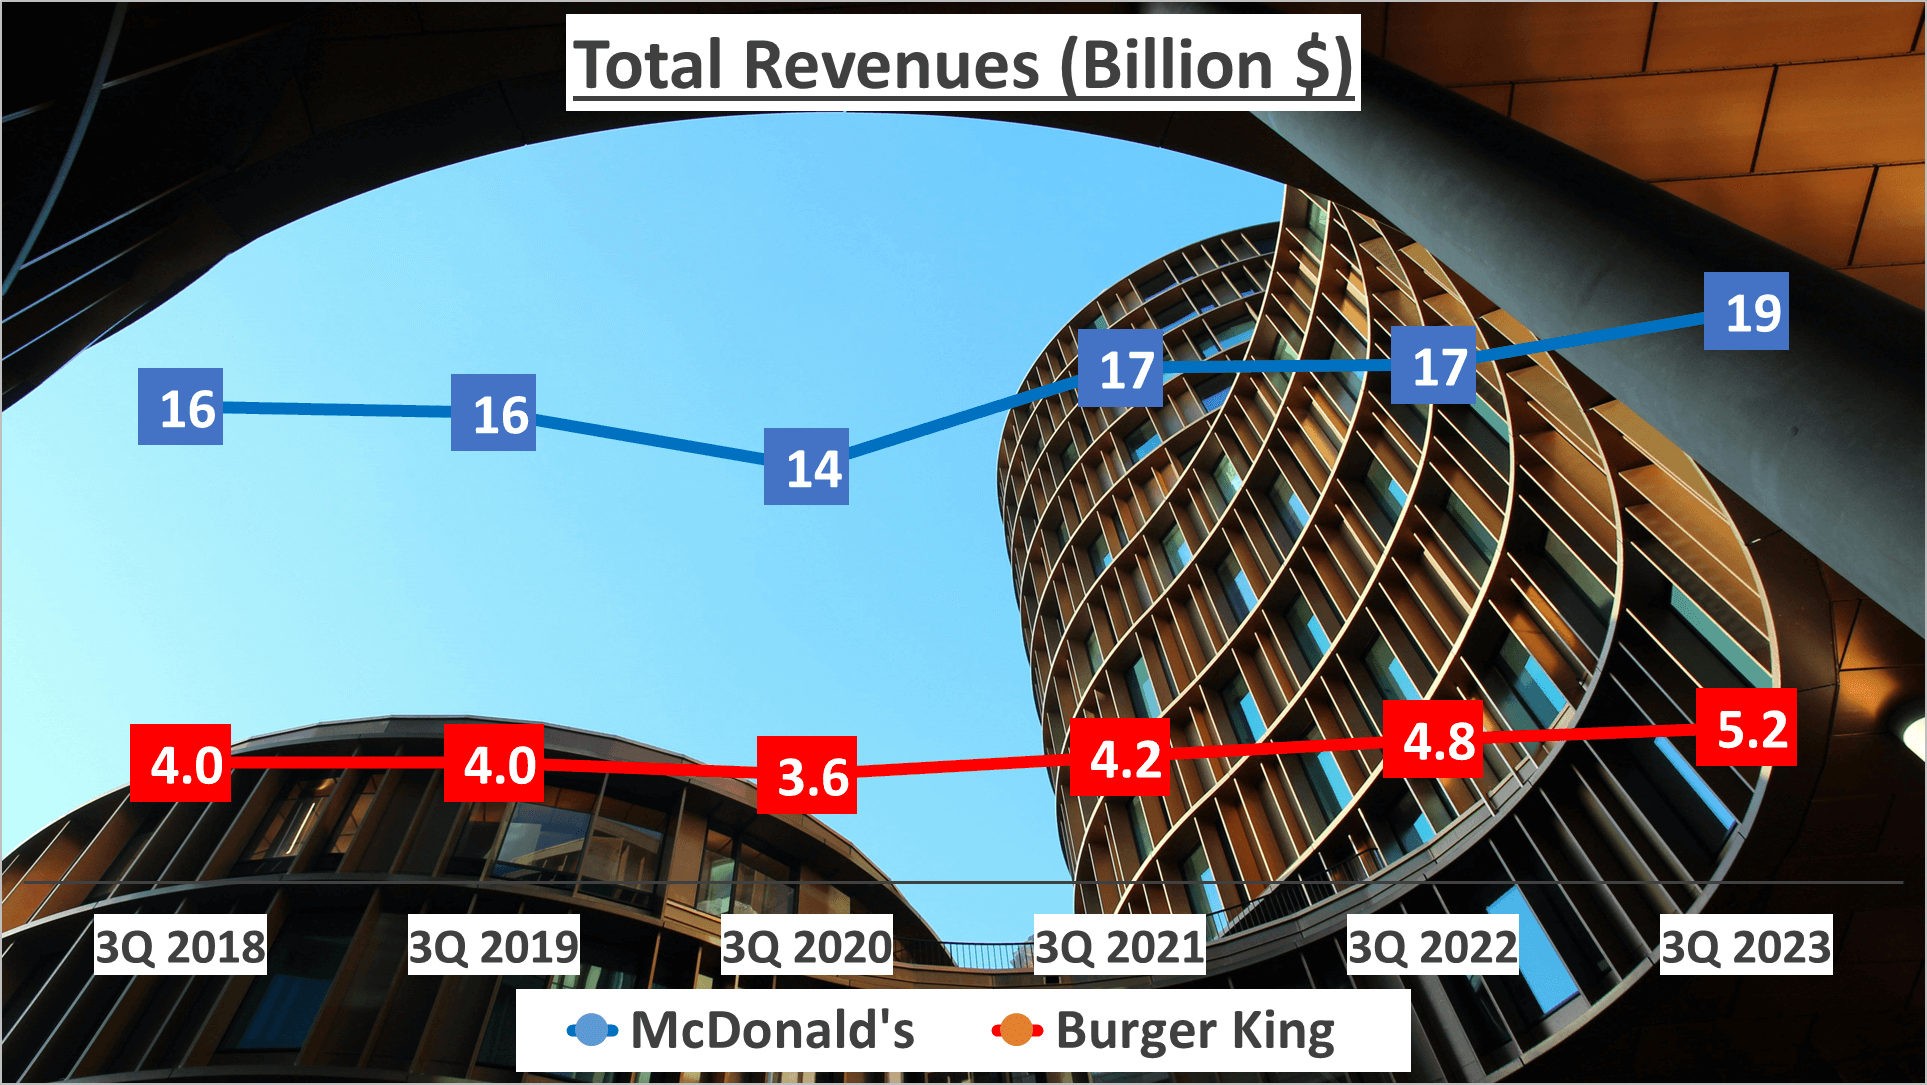
Beginning with a glimpse at their total revenues for the third quarter of 2023, McDonald’s reported a staggering $19 billion, while Burger King brought in a respectable $5.2 billion. However, analyzing the five-year span from 2018 to 2023, Burger King’s Compound Annual Growth Rate (CAGR) slightly outpaced McDonald’s, standing at 5% compared to McDonald’s 4%.
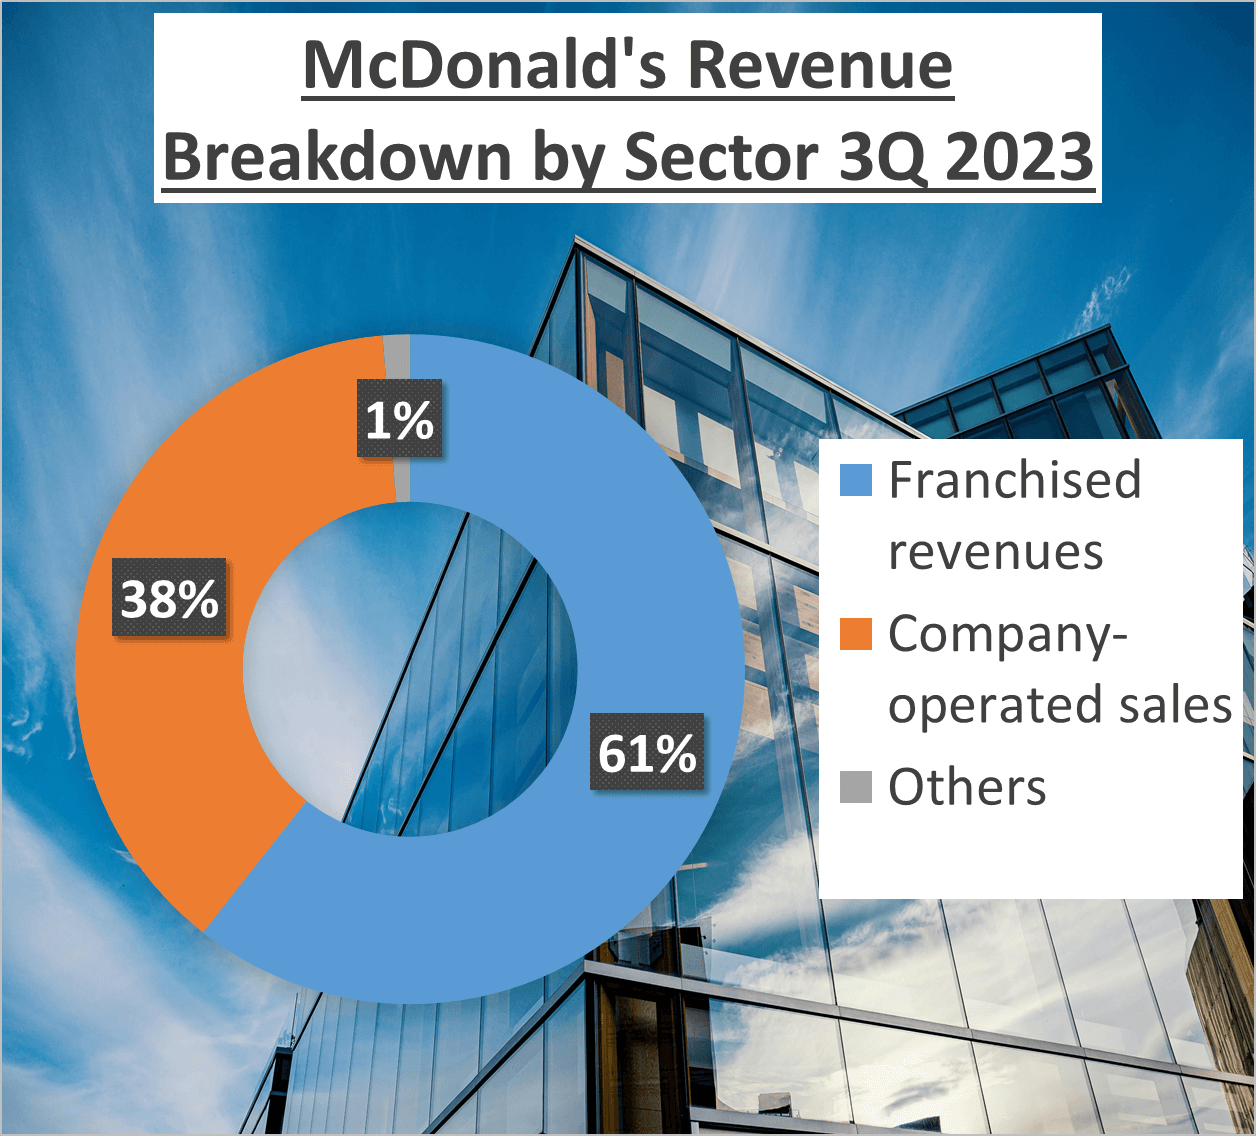
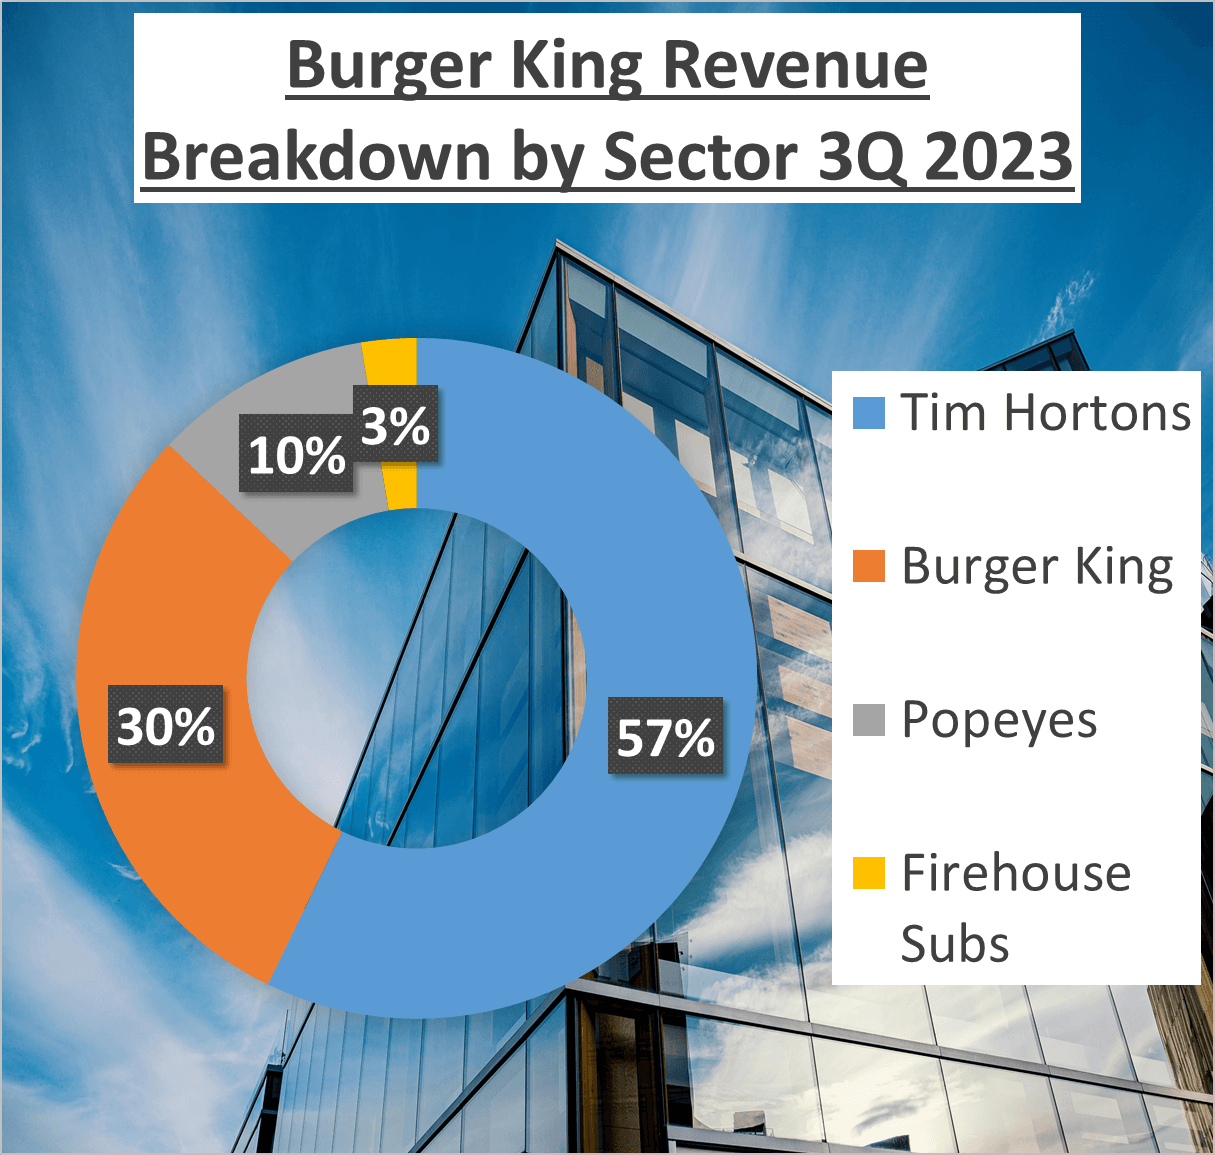
While these revenue figures impress, the revenue structure paints a more detailed picture. McDonald’s derives a majority of its revenue, 61%, from franchised revenues, with the remaining 38% from company-operated sales. In contrast, Burger King boasts a more diversified revenue structure. Fifty-seven percent of its revenue comes from Tim Hortons, 30% from Burger King itself, 10% from Popeyes, and 3% from Firehouse Subs.
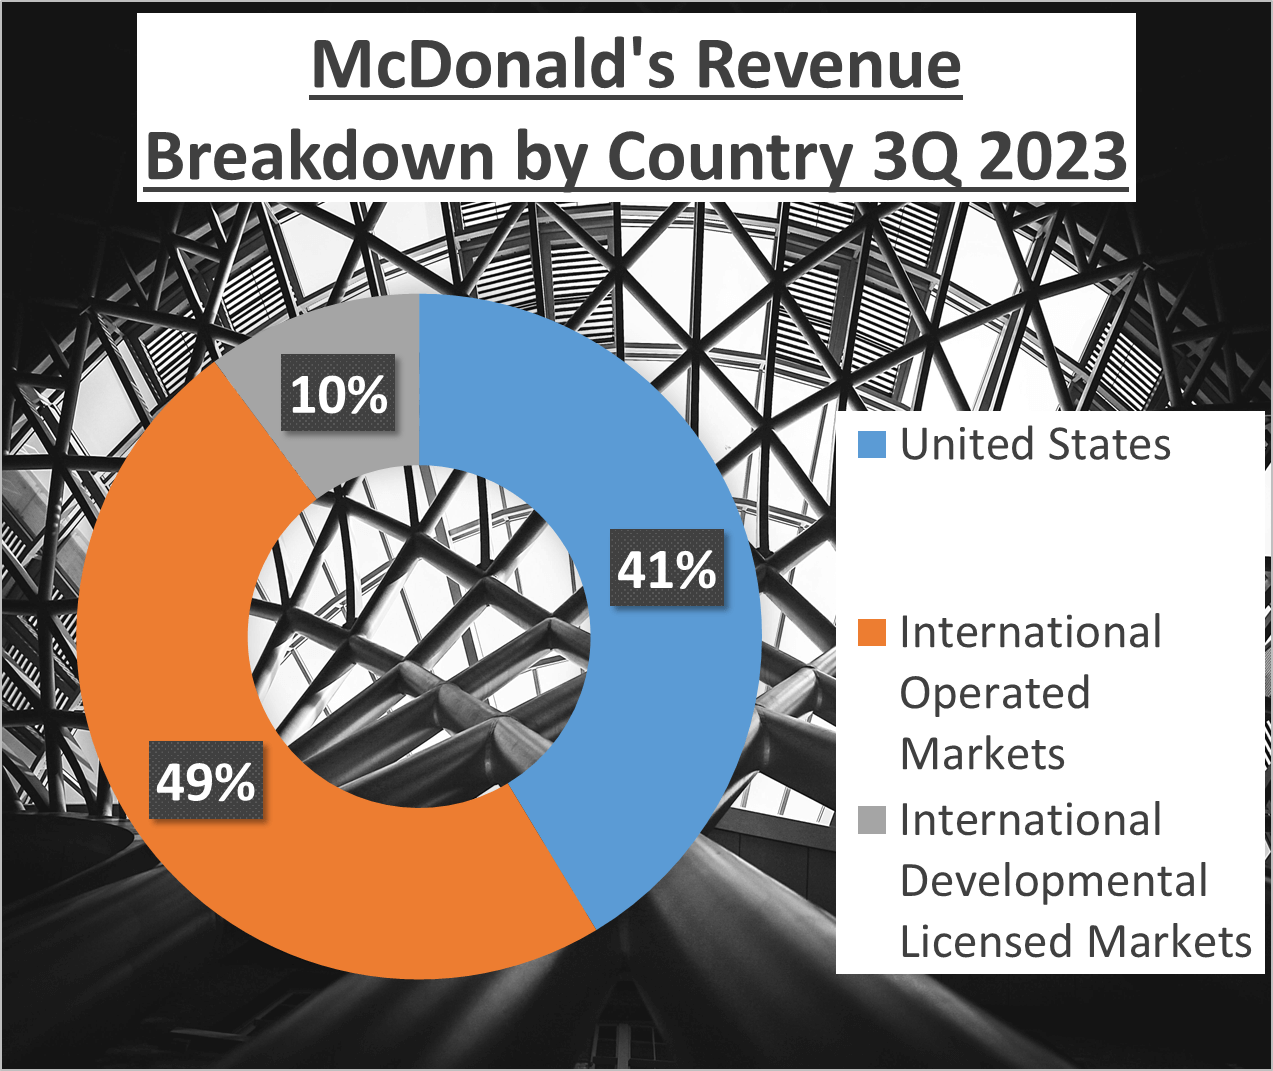
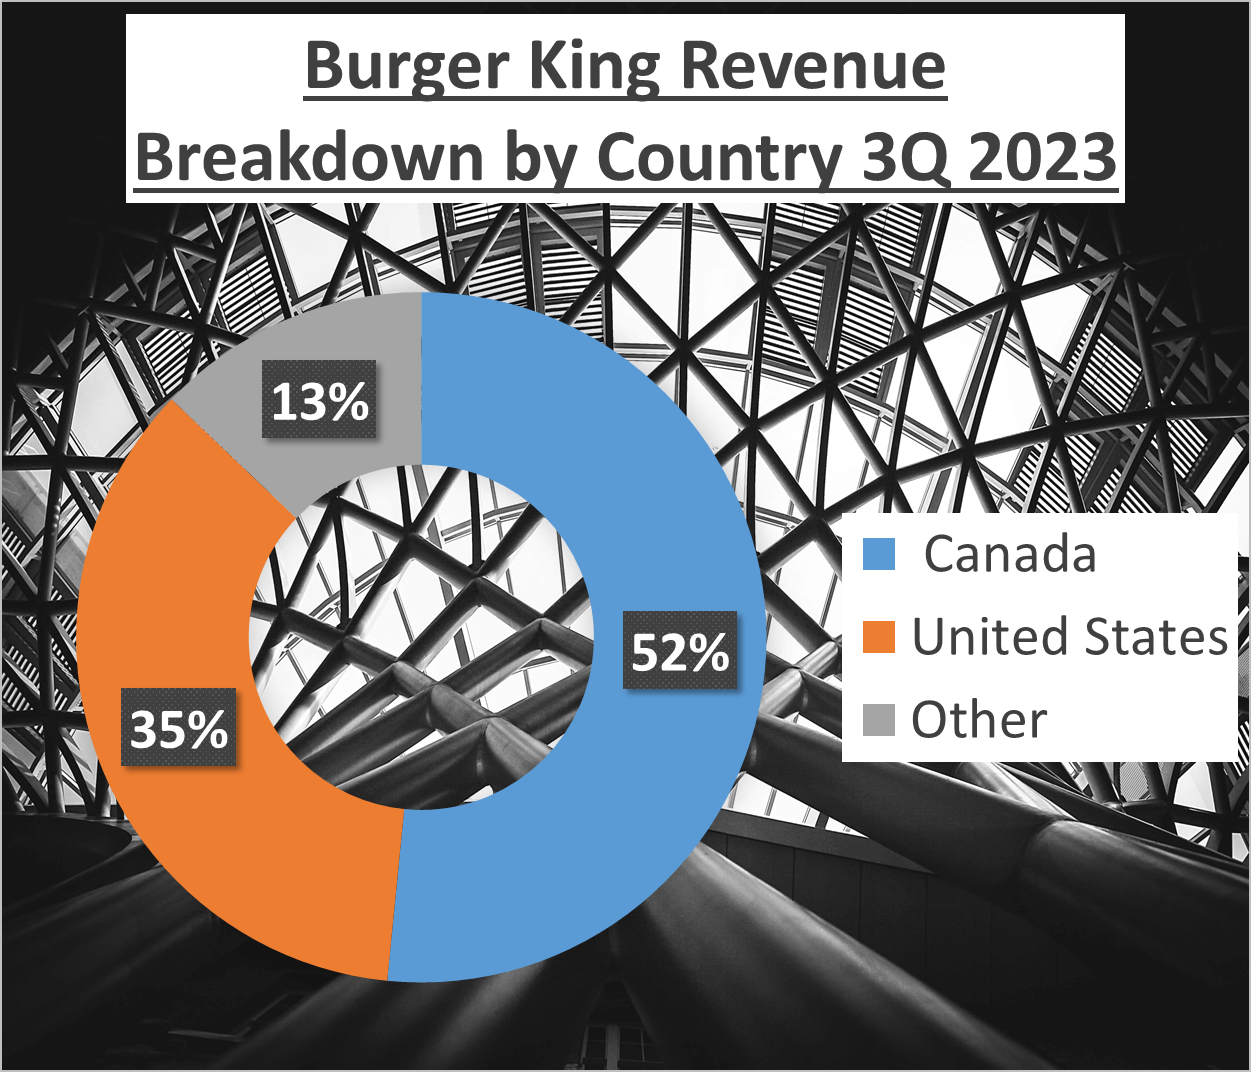
Geographically, McDonald’s sees 41% of its revenue from the United States, 48% from International Operated Markets, and 10% from International Developmental Licensed Markets. Burger King’s revenue is slightly more concentrated, with 52% from Canada, 36% from the United States, and 13% from other regions.
These figures offer insight into the companies’ performance and growth over the past five years. But what about profitability?
Profitability Analysis – McDonald’s vs Burger King Stock Analysis
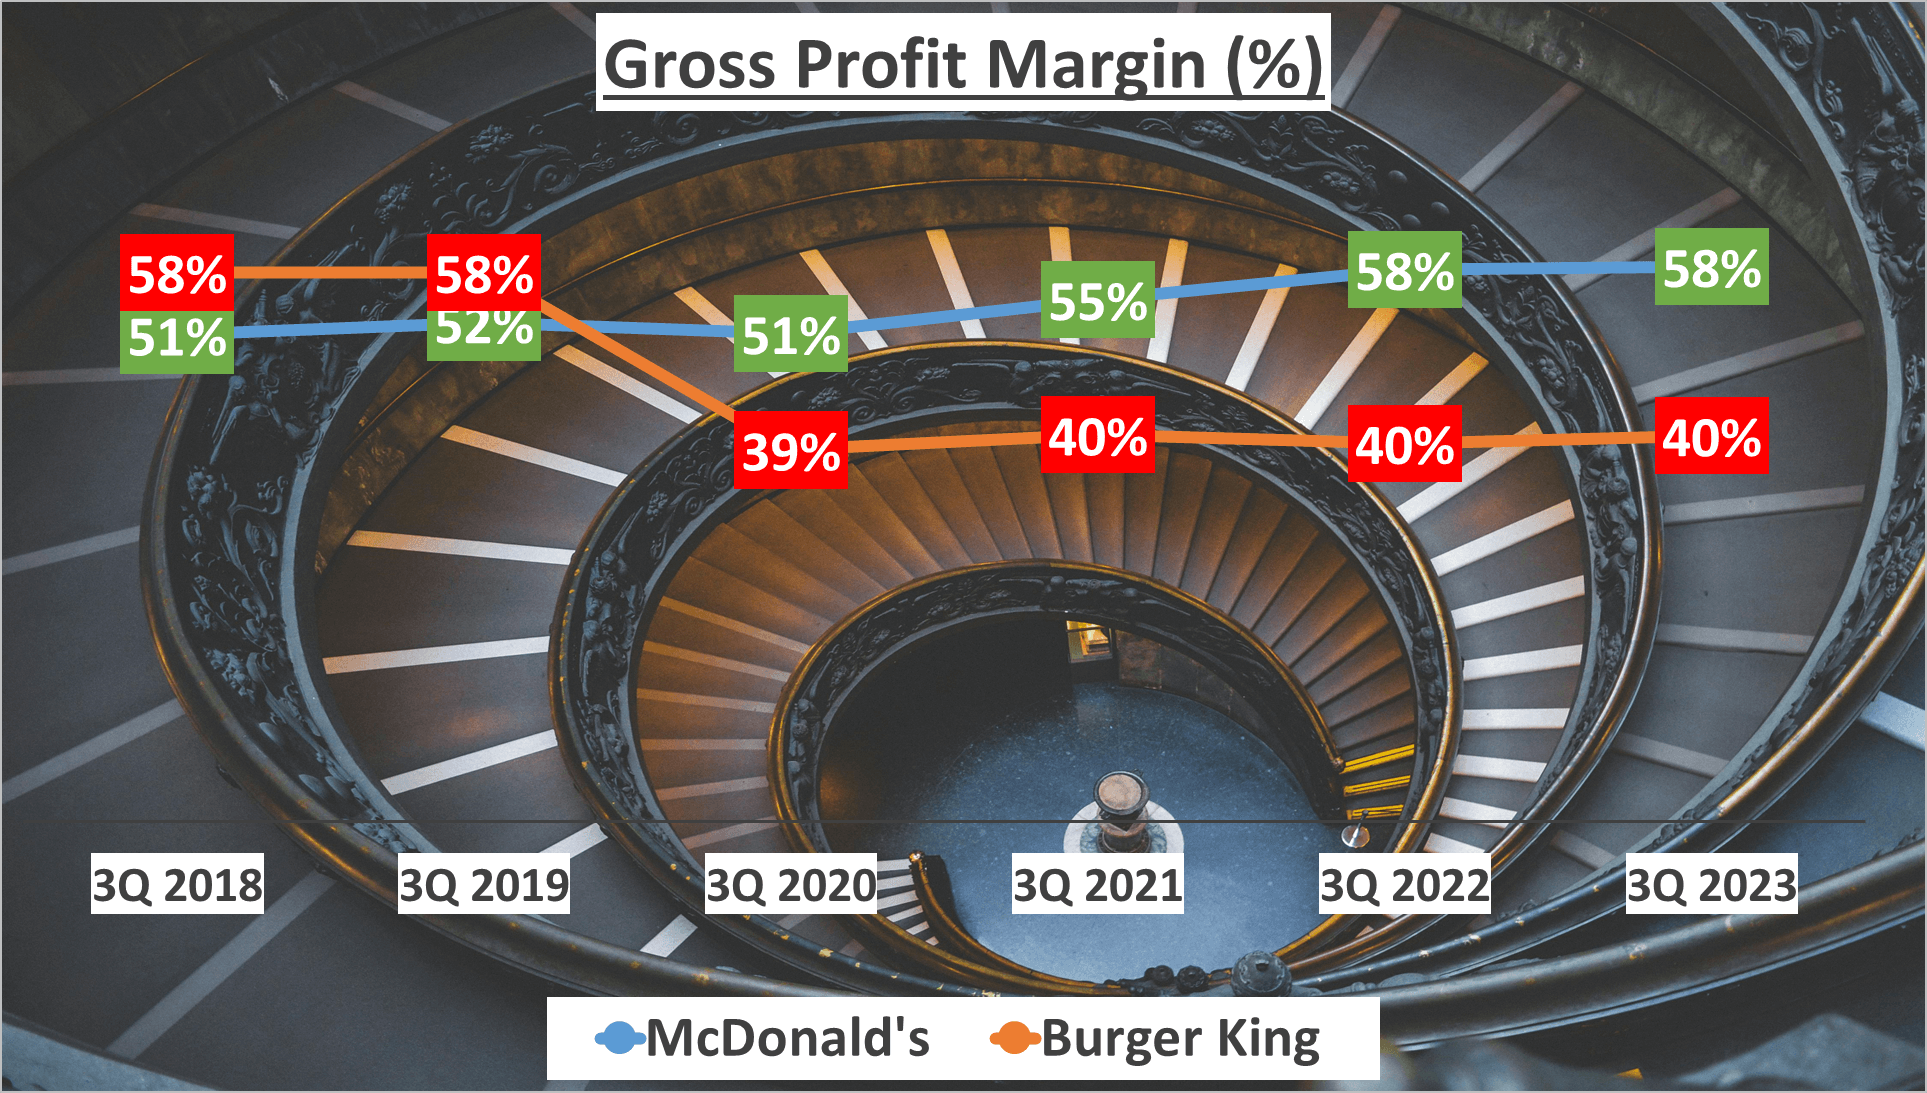
Profitability stands as a pivotal factor in assessing a company’s financial well-being. Let’s delve into the Gross Profit Margin and Net Profit Margin of both McDonald’s and Burger King for the third quarter of 2023. McDonald’s boasts a robust Gross Profit Margin of 58%, notably surpassing its five-year average of 54%. In contrast, Burger King’s Gross Profit Margin sits at 40%, slightly below its five-year average of 46%.
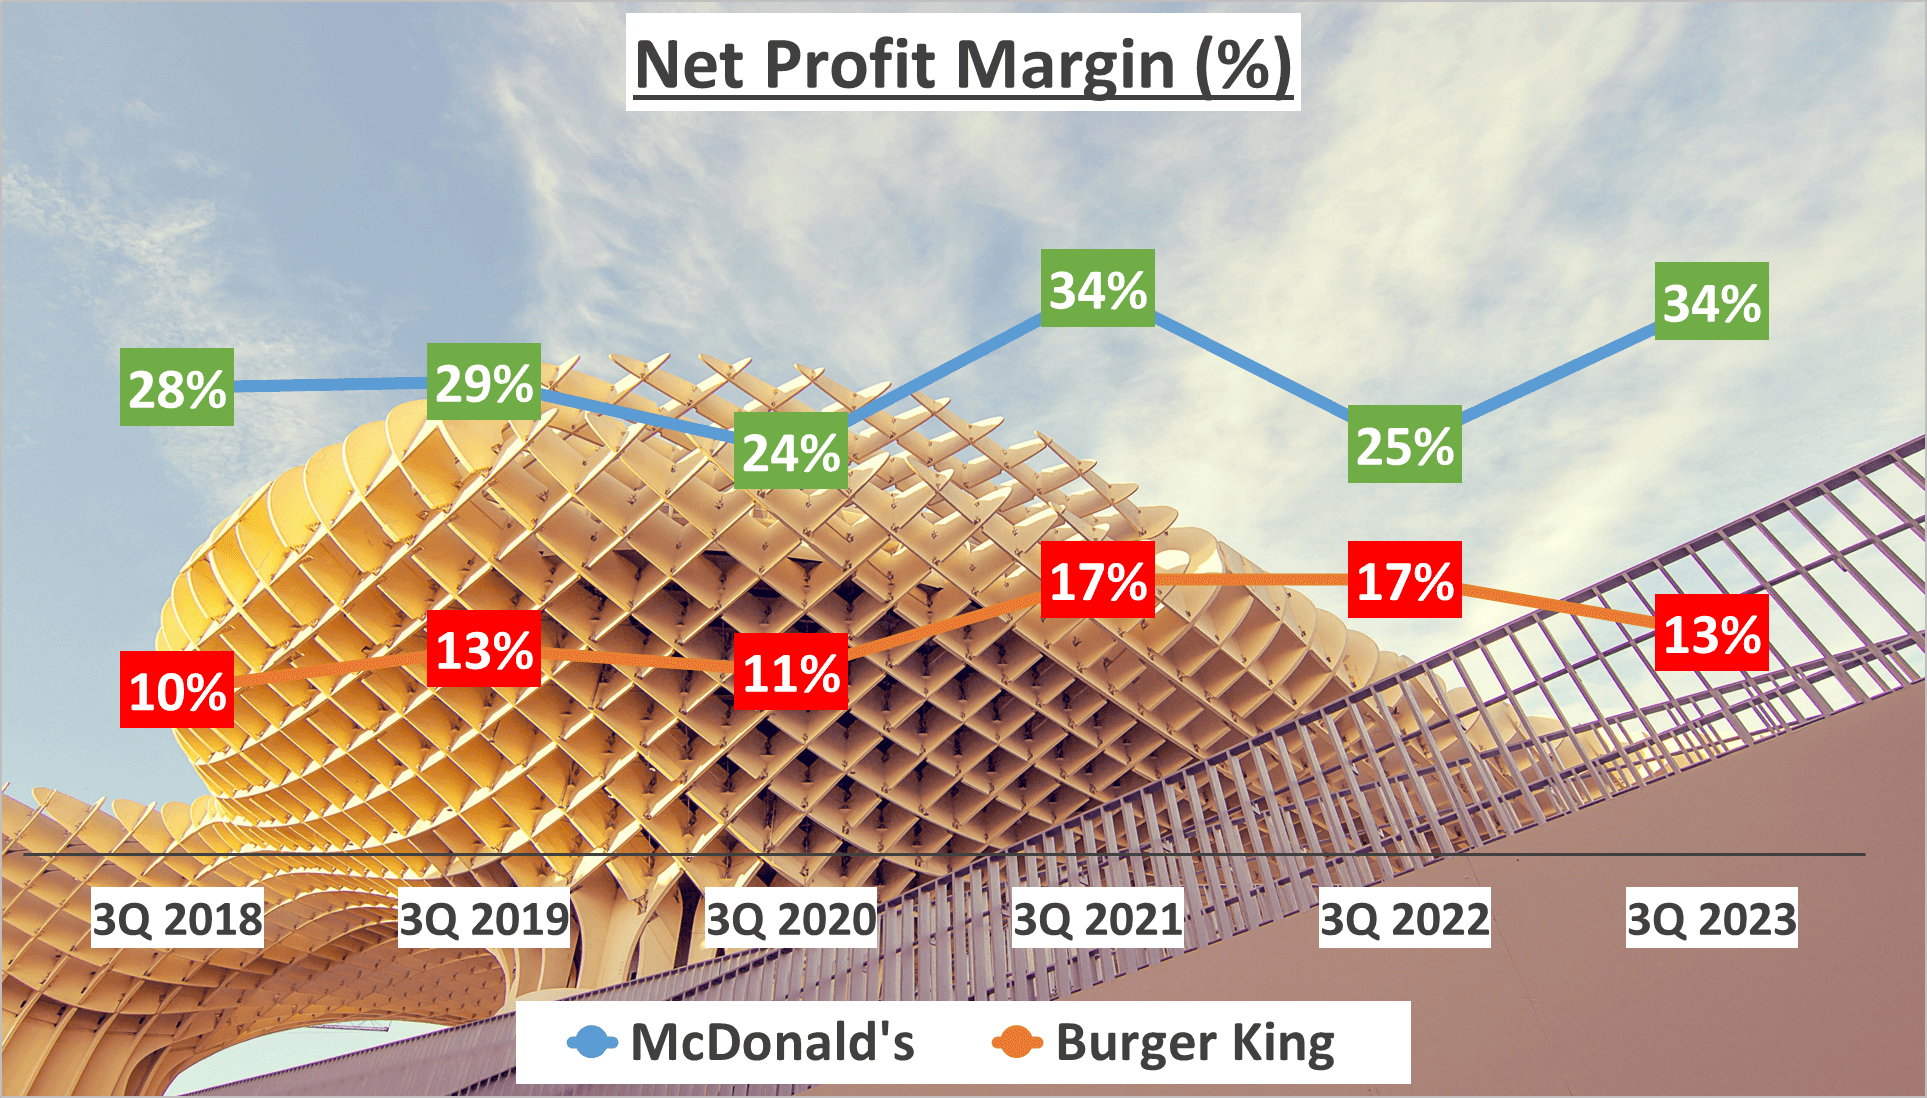
Shifting focus to the Net Profit Margin, McDonald’s demonstrates a formidable figure of 34%, exceeding its five-year average of 29%. Conversely, Burger King maintains a steady Net Profit Margin of 13%, aligning with its five-year average.
Yet, profitability extends beyond margins. Net profit, the bottom line, holds equal significance. McDonald’s records a net profit of $6 billion for the same period, indicating a Compound Annual Growth Rate (CAGR) of 7% over the past five years. While Burger King starts from a smaller base, it exhibits accelerated growth with a net profit of $1 billion and a CAGR of 12% over the same period.
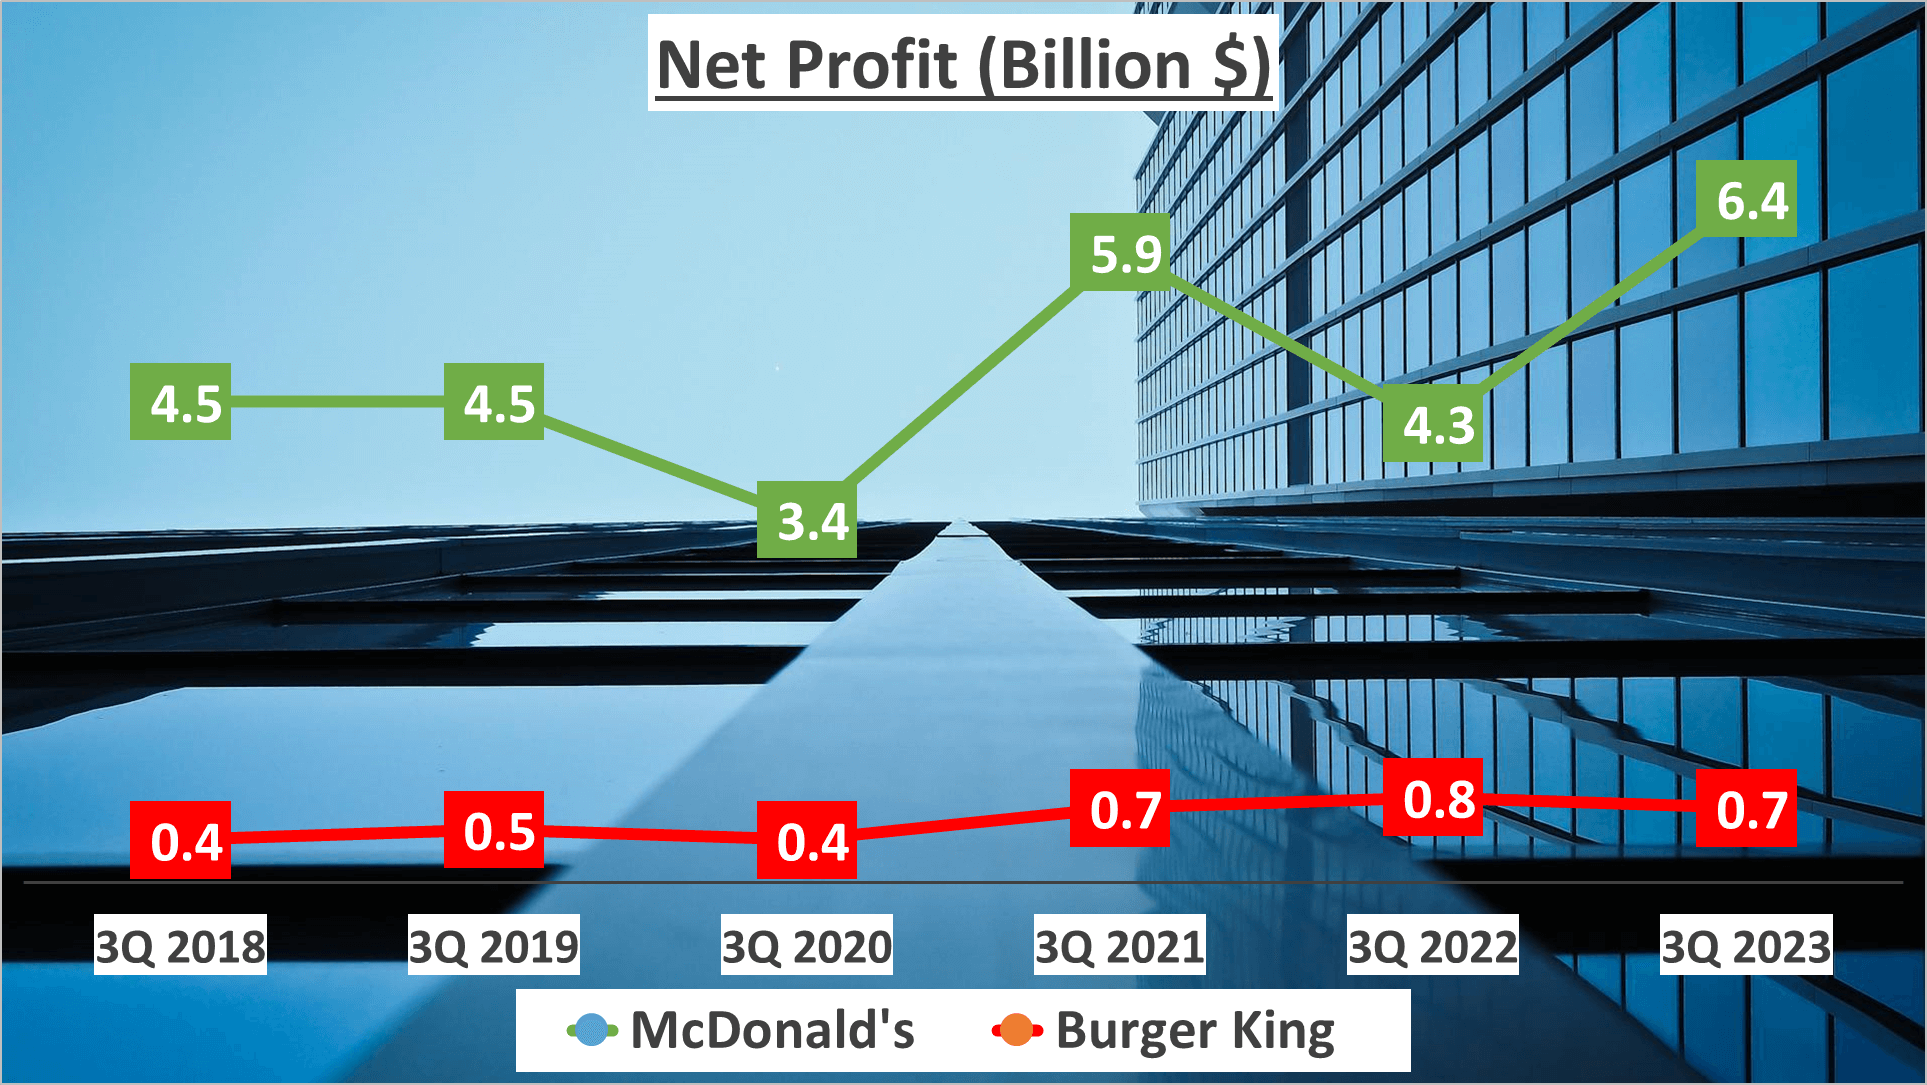
These statistics unveil divergent profit trajectories. McDonald’s, with its elevated profit margins and substantial net profit, emerges as a dominant force in the fast-food realm. Conversely, Burger King, despite narrower profit margins, displays promising net profit growth.
These insights shed light on the companies’ profit-generating capabilities. Yet, what about their financial resilience?
Financial Stability – McDonald’s vs Burger King Stock Analysis
Financial stability serves as a cornerstone in evaluating a company’s well-being. By examining the landscape at the close of the third quarter of 2023, we find McDonald’s total assets amounted to $52 billion, whereas Burger King held $23 billion in assets. Undoubtedly, a substantial contrast, yet the narrative unfolds further.
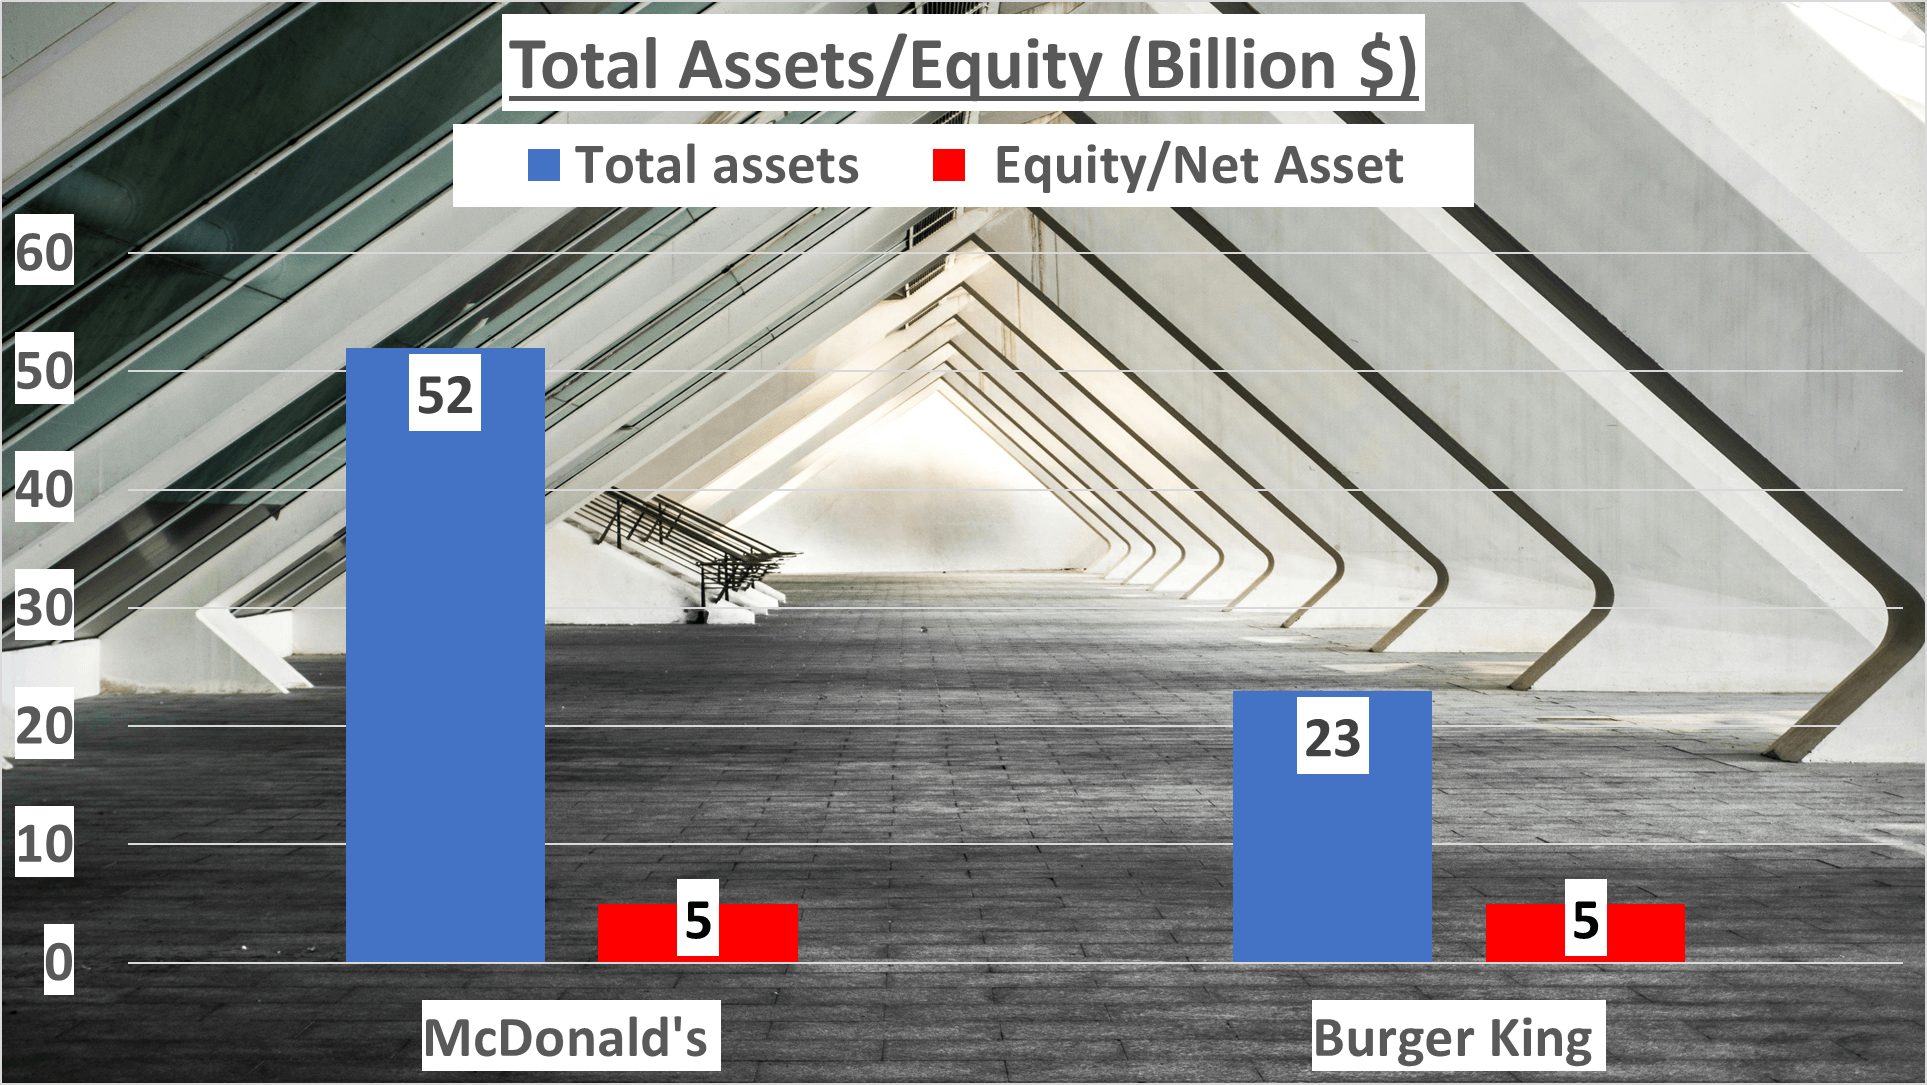
Diving into net assets, we encounter an intriguing revelation. Despite the glaring gap in total assets, both McDonald’s and Burger King reported net assets of $5 billion. How could this be, given the discrepancy? Let’s delve deeper.
The equity to total assets ratio furnishes insights into a company’s financial leverage. Here, McDonald’s ratio stood at 9%, indicating a higher reliance on debt in its capital structure, while Burger King’s ratio doubled at 20%, reflecting a more conservative debt approach.
Liquidity constitutes another pivotal aspect in assessing financial stability. McDonald’s boasted a current ratio of 1.71, whereas Burger King recorded 1.15. Both figures surpassing one, implying sound short-term financial health.
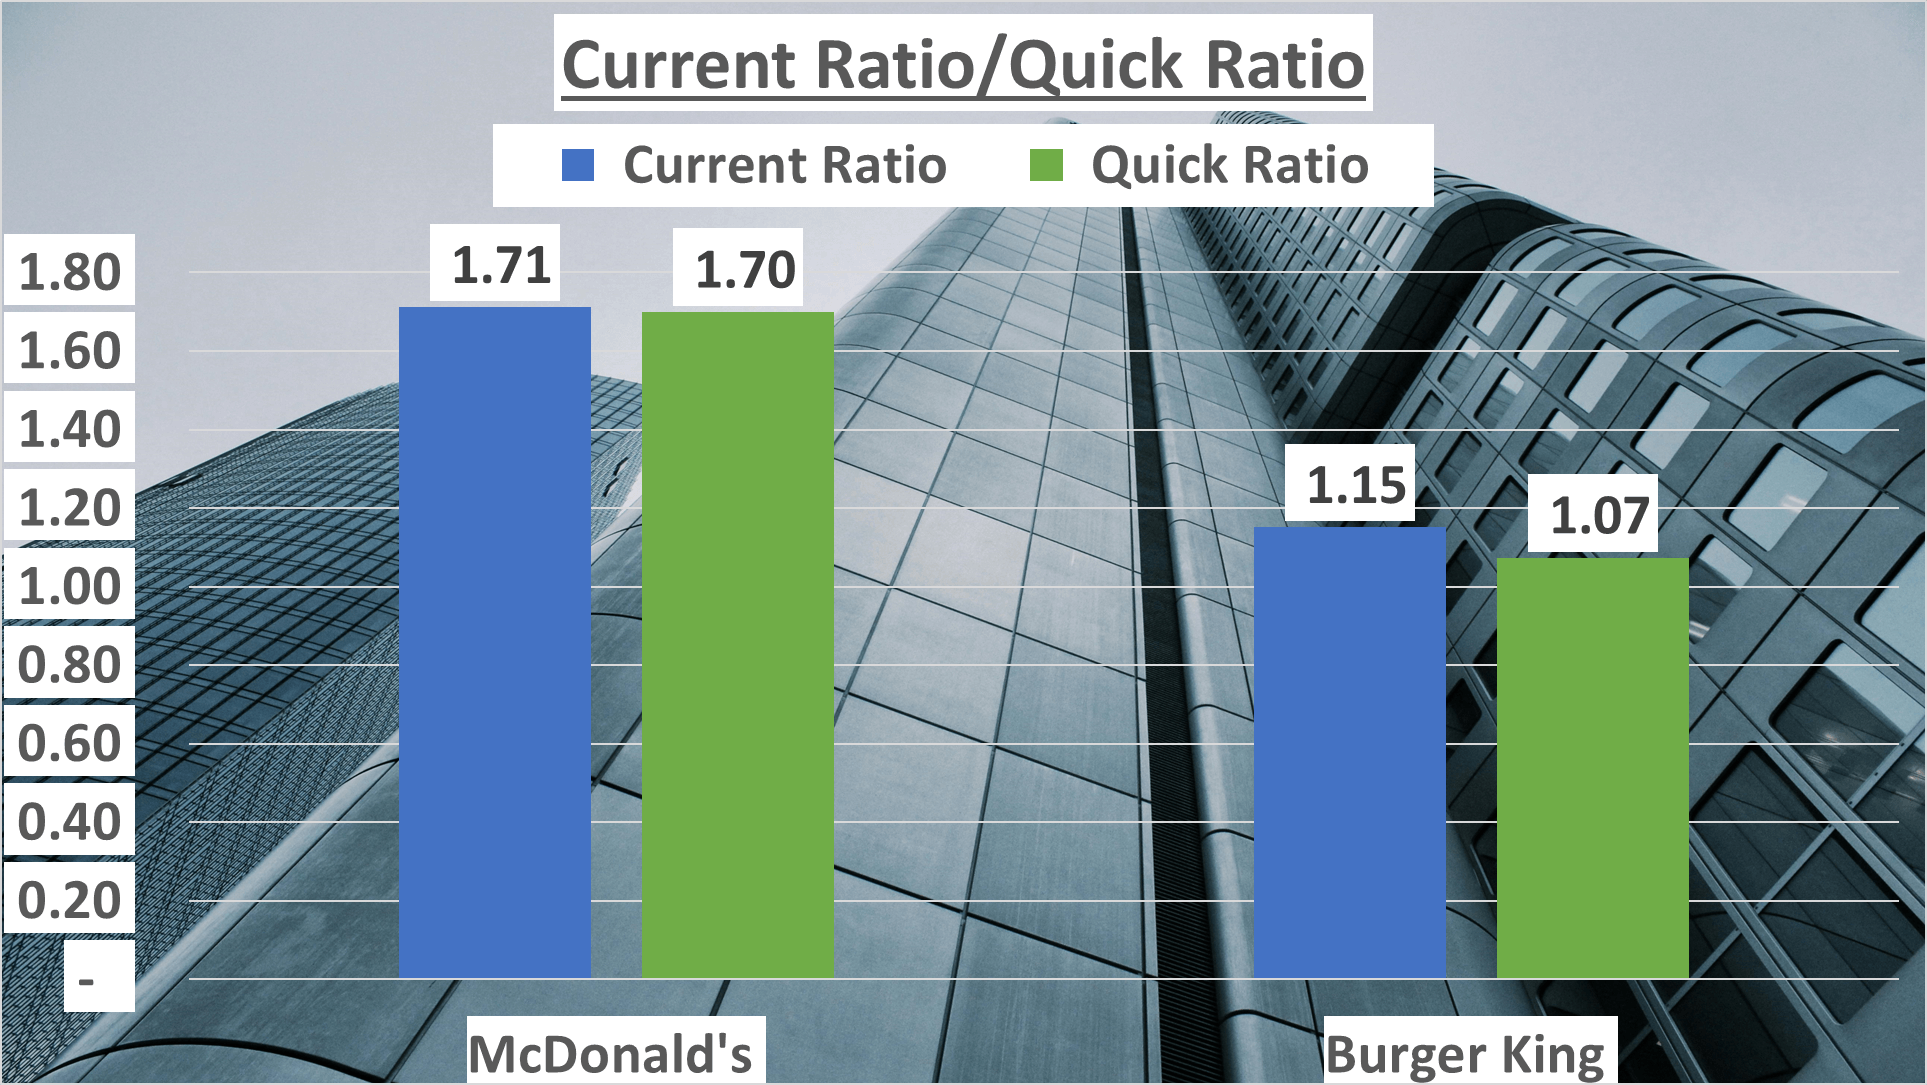
Similarly, the quick ratio, excluding inventories from current assets, paints a stricter picture of short-term liquidity. McDonald’s exhibited a quick ratio of 1.7, while Burger King’s stood at 1.07. Once again, both entities display ratios exceeding one, reinforcing robust liquidity positions.
What does this signify? Well, while McDonald’s and Burger King adopt distinct strategies concerning capital structure and leverage, both demonstrate resilience in liquidity and capacity to meet short-term obligations.
These metrics offer insights into the companies’ financial stability. Yet, what about their operational efficiency?
Operational Efficiency – McDonald’s vs Burger King Stock Analysis
Operational efficiency serves as a pivotal gauge of how adeptly a company utilizes its resources to drive profits.
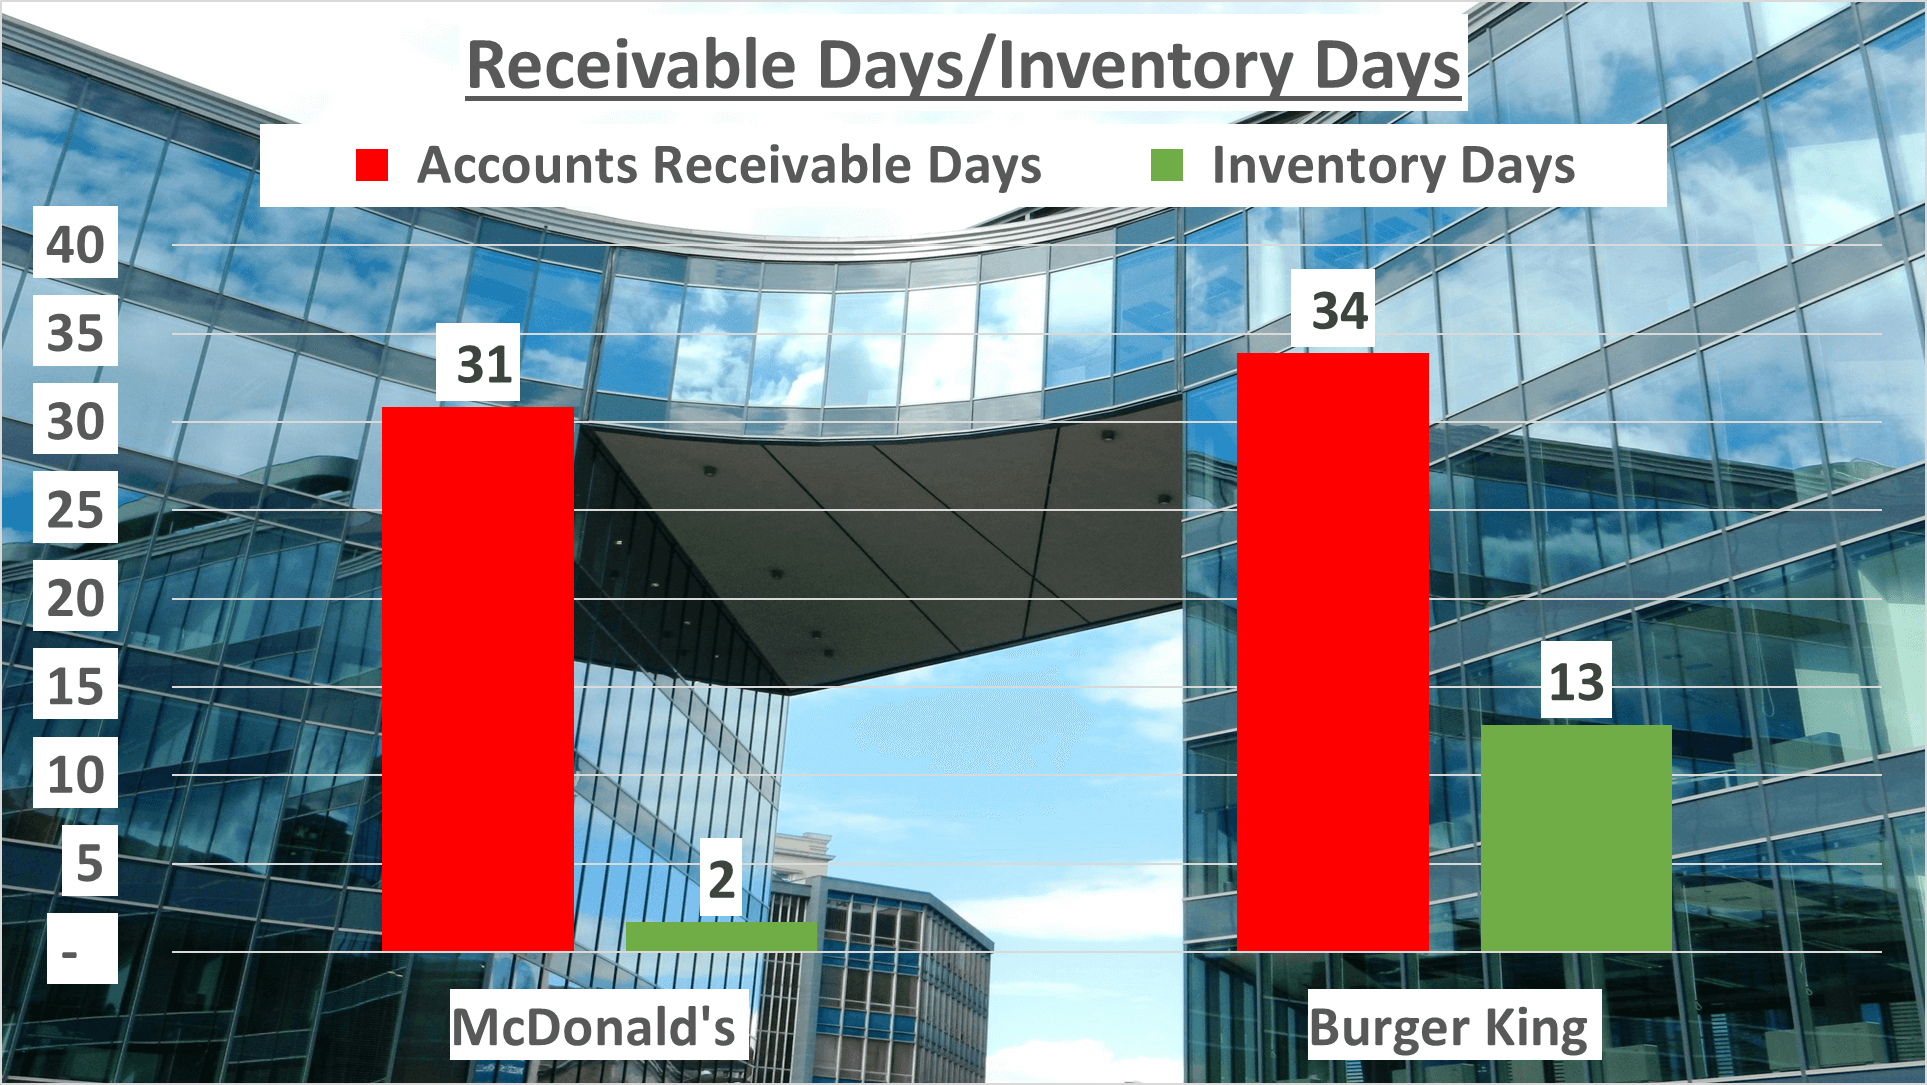
Delving into operational efficiency, we scrutinize metrics such as inventory days and accounts receivable days. McDonald’s demonstrates remarkable efficiency with an inventory turnover of merely 2 days, whereas Burger King operates at a slower pace with 13 inventory days. Similarly, McDonald’s collects receivables swiftly in approximately 31 days, while Burger King takes a slightly longer period of 34 days.
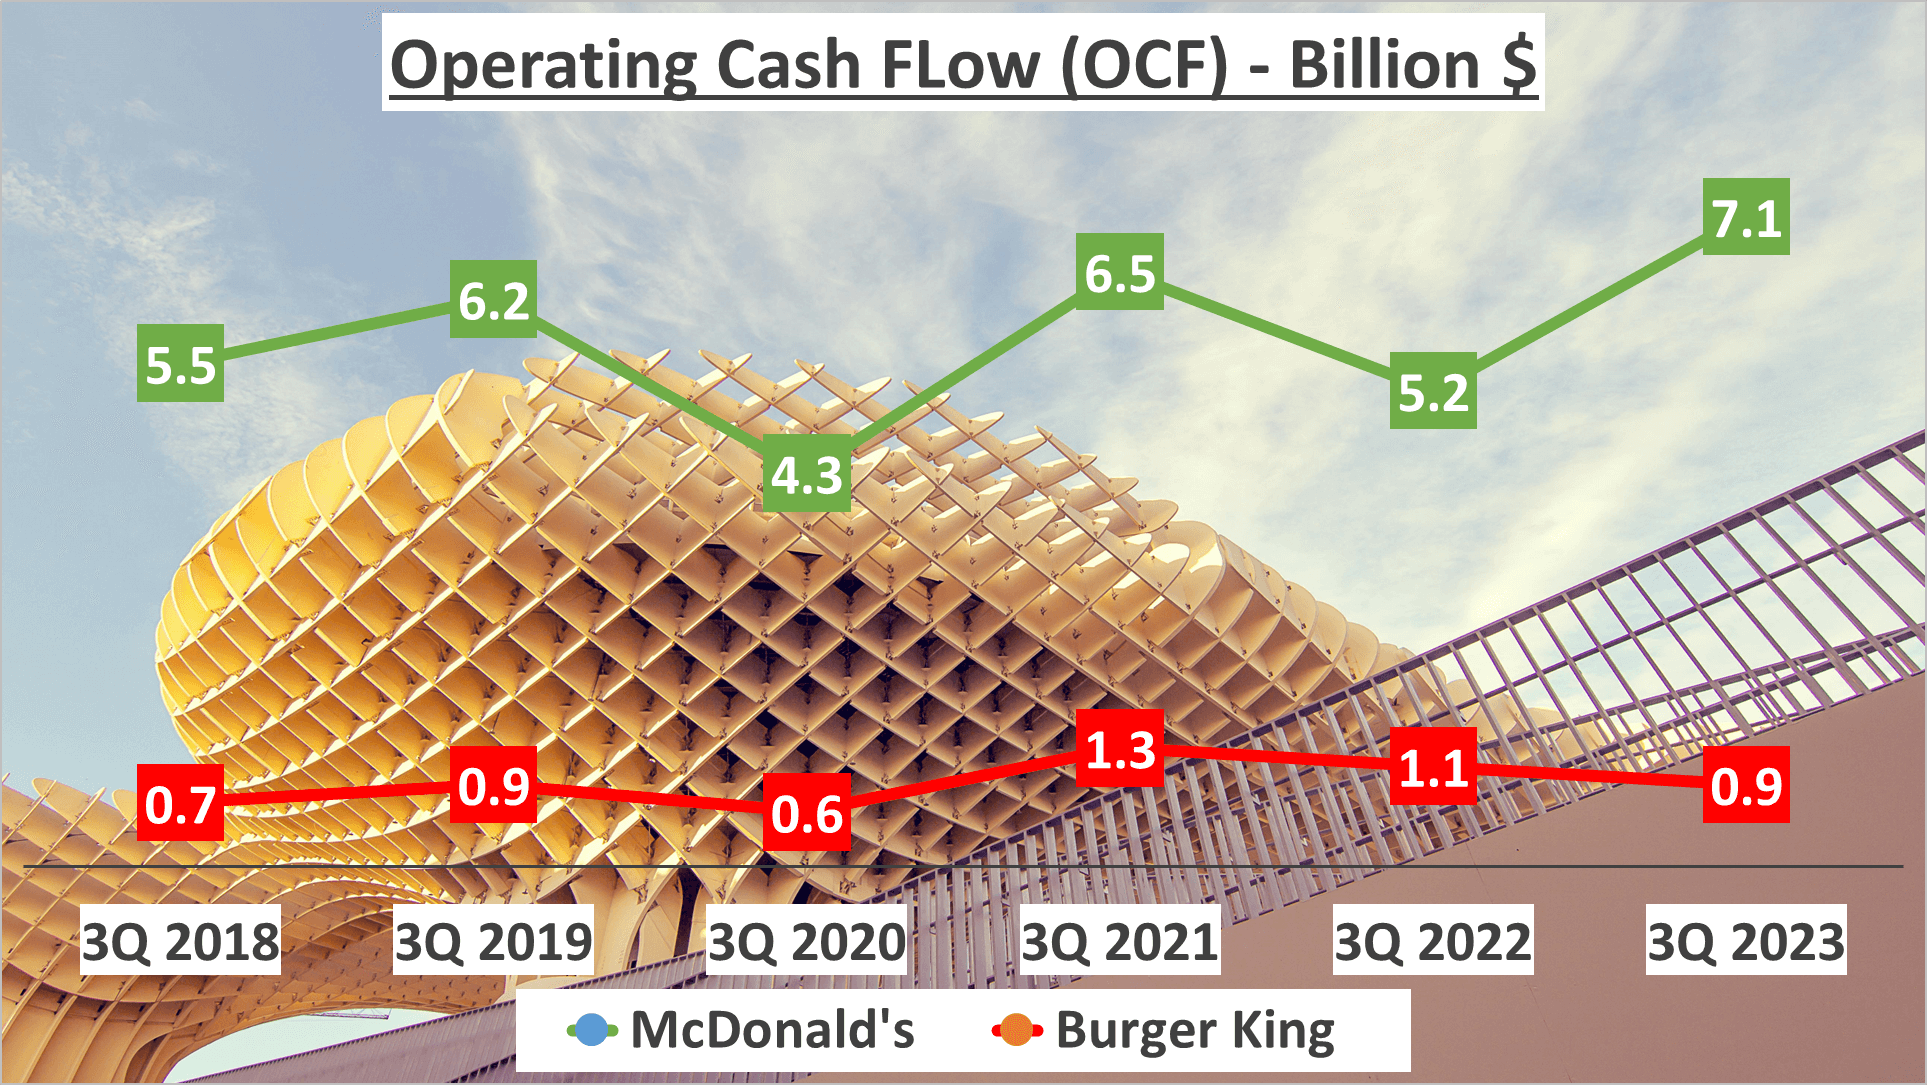
In terms of cash flow—a cornerstone in assessing a company’s liquidity, solvency, and financial agility—both fast-food titans exhibit robust figures. McDonald’s boasts an impressive operating cash flow of $7 billion, whereas Burger King maintains a respectable $1 billion.
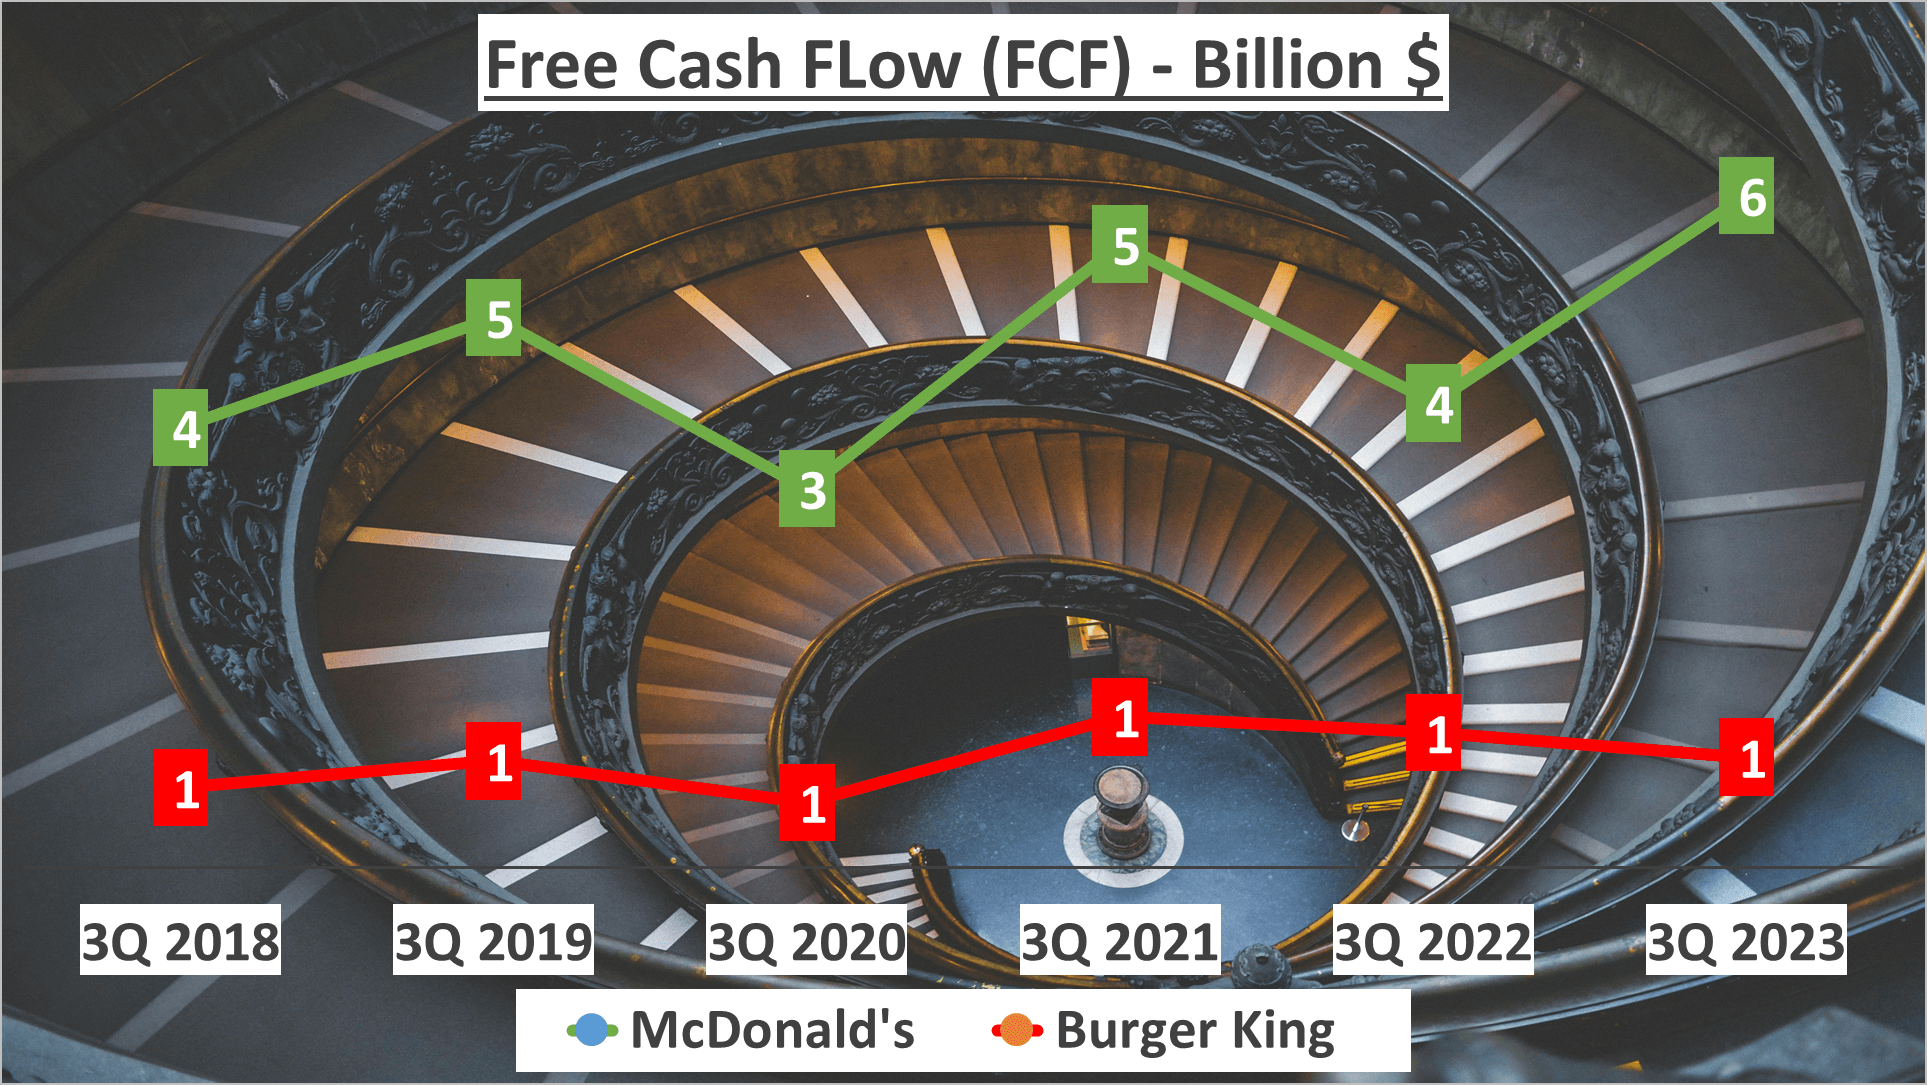
Now, let’s delve into free cash flow—a pivotal metric representing the cash available after accounting for capital expenditures. McDonald’s showcases a noteworthy free cash flow of $6 billion, overshadowing Burger King’s $1 billion.
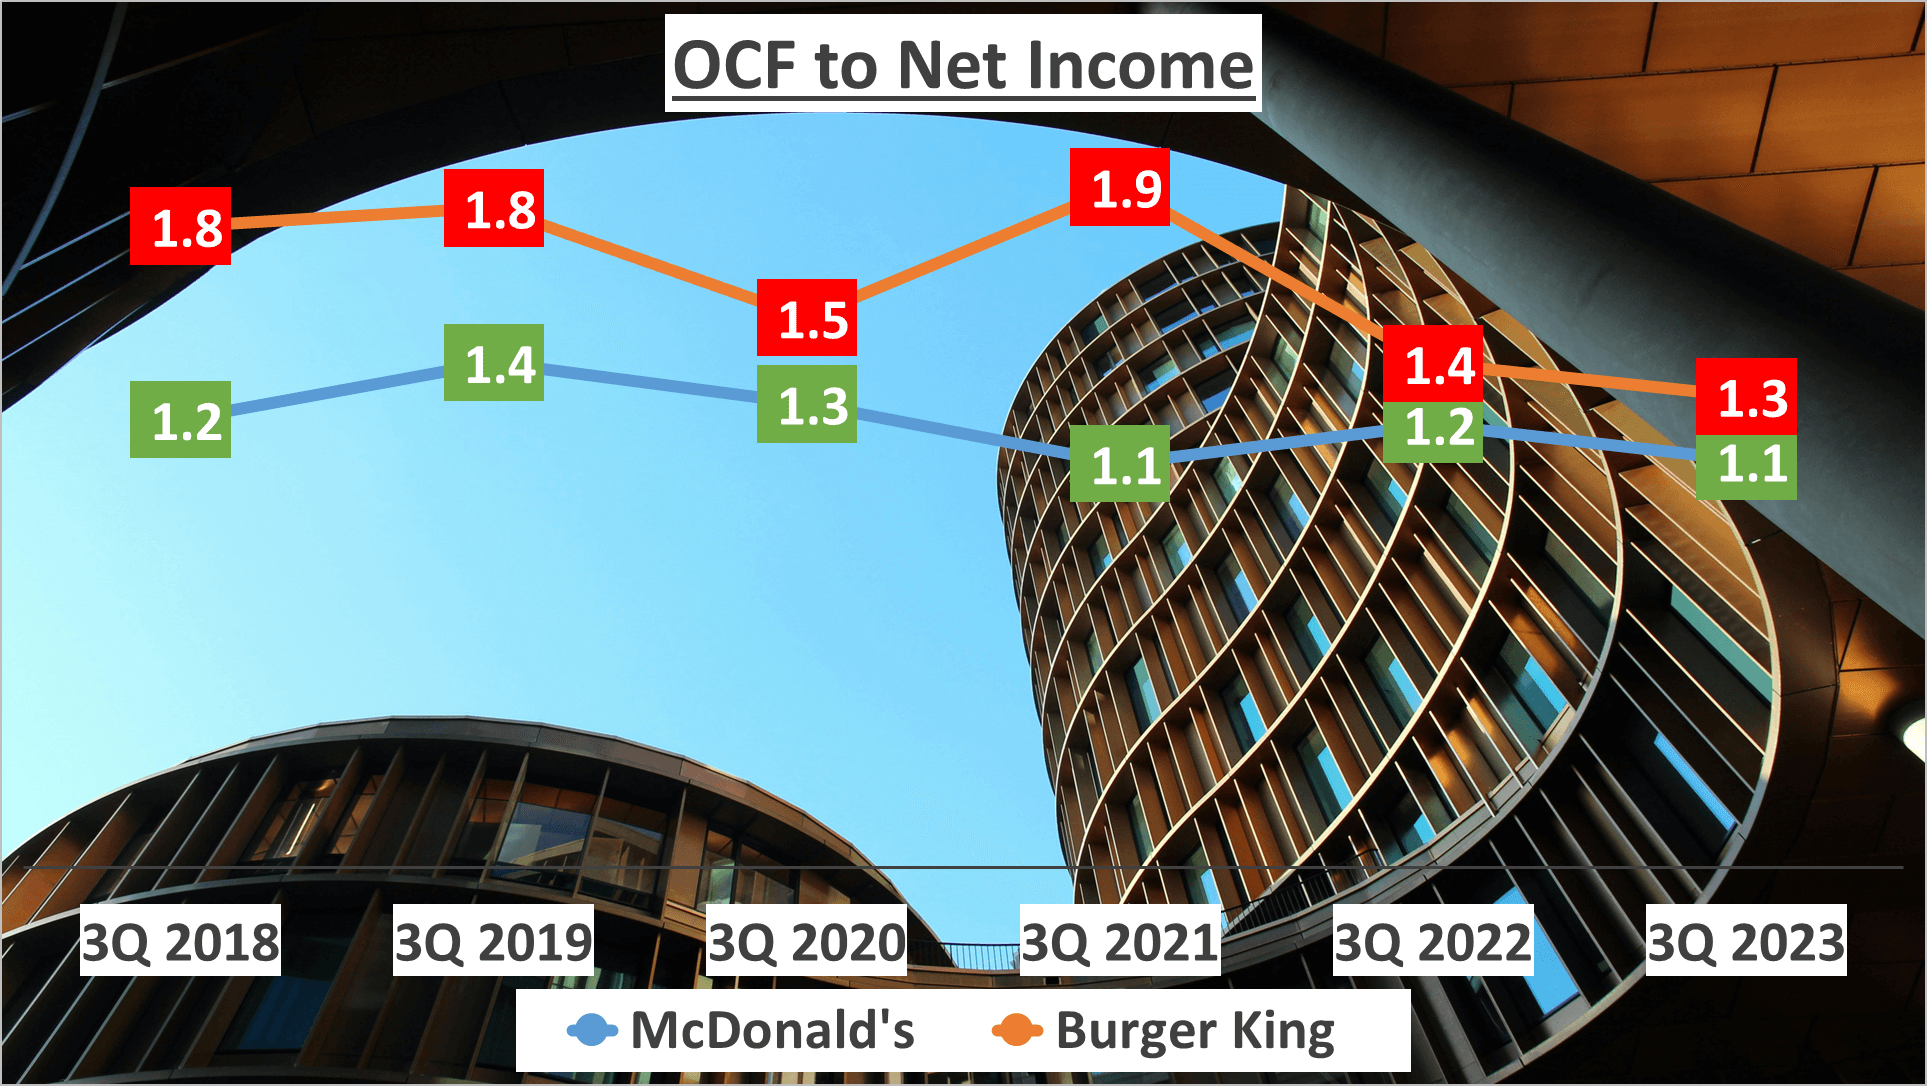
Examining the operating cash flow to net income ratio unveils insights into a company’s capacity to translate profits into cash. McDonald’s exhibits a ratio of 1.1, signifying a strong proficiency in converting profit into cash. Conversely, Burger King boasts a slightly higher ratio of 1.3, underscoring its efficiency in profit-to-cash conversion.
These metrics shed light on the operational efficiency of both companies. However, what about their return on equity?
Return on Equity Analysis – McDonald’s vs Burger King Stock Analysis
Return on Equity (ROE) serves as a crucial metric in assessing a company’s financial prowess, offering insights into its profitability and efficiency in utilizing equity to generate profits.
Let’s conduct a Dupont analysis of McDonald’s and Burger King’s ROE for the third quarter of 2023. This breakdown entails examining three components: Net Profit Margin, Asset Turnover, and Equity Multiplier, providing a comprehensive understanding of their financial performance.
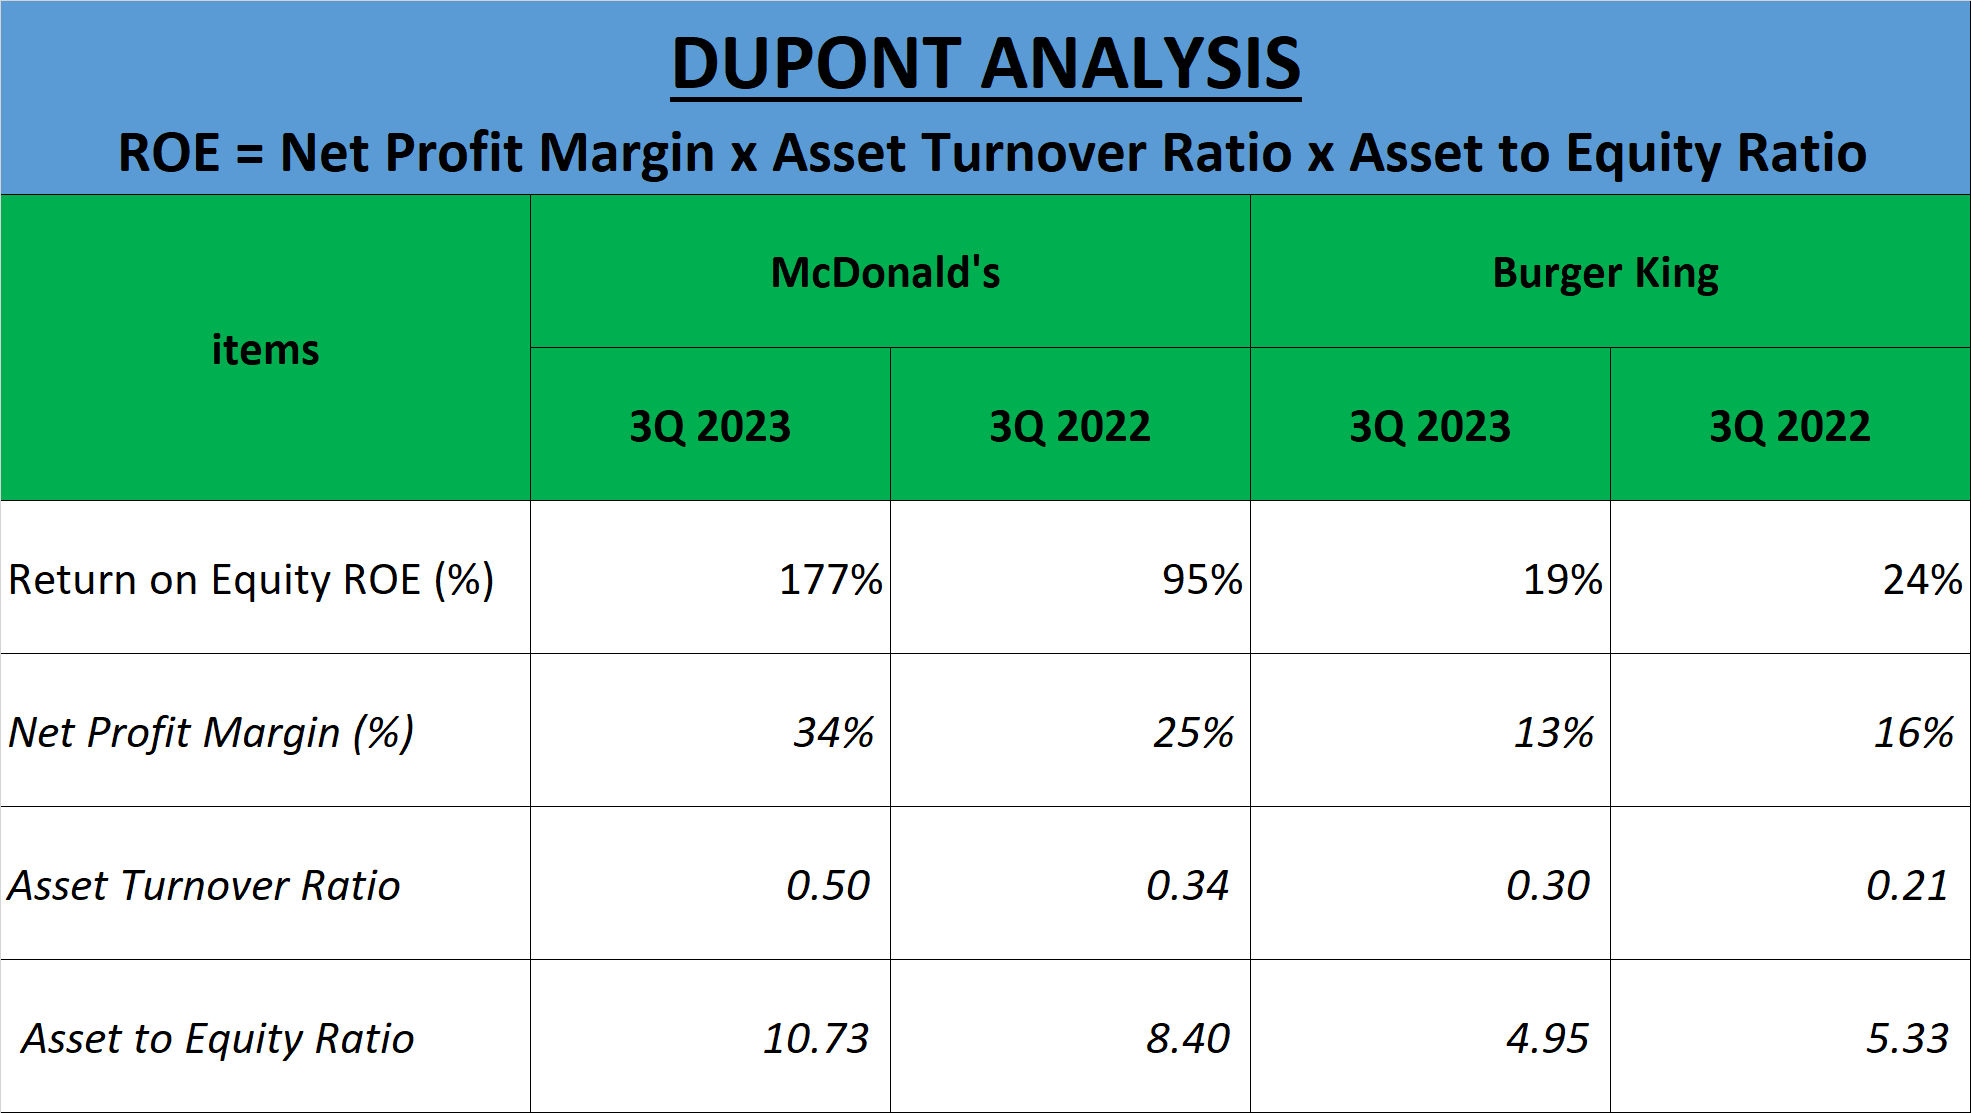
McDonald’s ROE stands remarkably high at 177%. This remarkable figure is propelled by a robust Net Profit Margin of 34%, indicative of McDonald’s exceptional profitability. Its Asset Turnover is 0.5, signifying that for every dollar in assets, McDonald’s generates $0.50 in sales. Additionally, the Equity Multiplier, or Asset to Equity ratio, is 10.73, implying McDonald’s efficient use of leverage to bolster its ROE.
In contrast, Burger King’s ROE is more modest at 19% compared to McDonald’s. With a Net Profit Margin of 13%, Burger King exhibits lower profitability per dollar of revenue. Its Asset Turnover is 0.3, indicating it generates $0.30 in sales for every dollar in assets. Furthermore, the Asset to Equity ratio is 4.95, suggesting Burger King’s conservative approach with less reliance on leverage.
In summary, McDonald’s boasts a superior ROE driven by its exceptional profitability and adept utilization of leverage. However, Burger King adopts a more cautious stance with lesser dependence on leverage.
These insights offer a comprehensive perspective on the financial performance of both companies, aiding investors in evaluating potential investments and discerning which entity possesses a more sustainable business model over the long haul.
Author: investforcus.com
Follow us on Youtube: The Investors Community

