Meta vs Alphabet Stock Analysis – Curious about how Meta and Alphabet fare financially? Today, we delve into the financial metrics.
Meta, the force behind Facebook, Instagram, and WhatsApp, and Alphabet, the parent company of Google, stand as two titans in the tech realm. With interests spanning social networking, digital advertising, cloud computing, and artificial intelligence, both companies wield significant influence.
But how do they measure up in terms of financial performance? That’s precisely what we aim to uncover.
Through a comprehensive analysis of their revenues, profits, operational efficiency, and other critical financial indicators, we seek to paint a clearer picture of their financial well-being and growth potential.
For investors seeking to make informed decisions, a deep understanding of the financial standings of these tech giants is paramount. Let’s embark on this journey.
Meta vs Alphabet Stock Analysis: Revenue Insights
Let’s start by examining the total revenues of Meta and Alphabet.
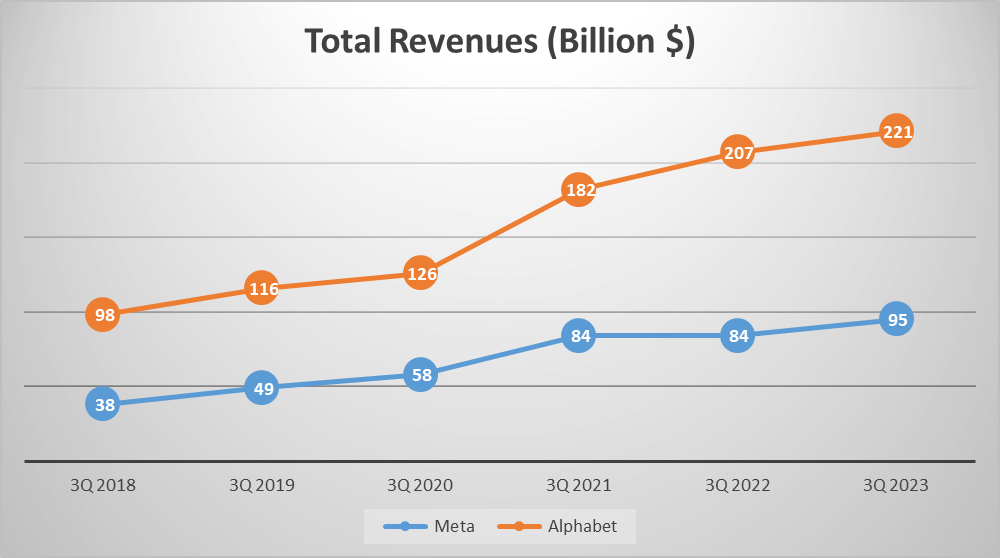
As of the close of the third quarter of 2023, Meta’s total revenue stood at $95B, while Alphabet’s soared to a staggering $221B.
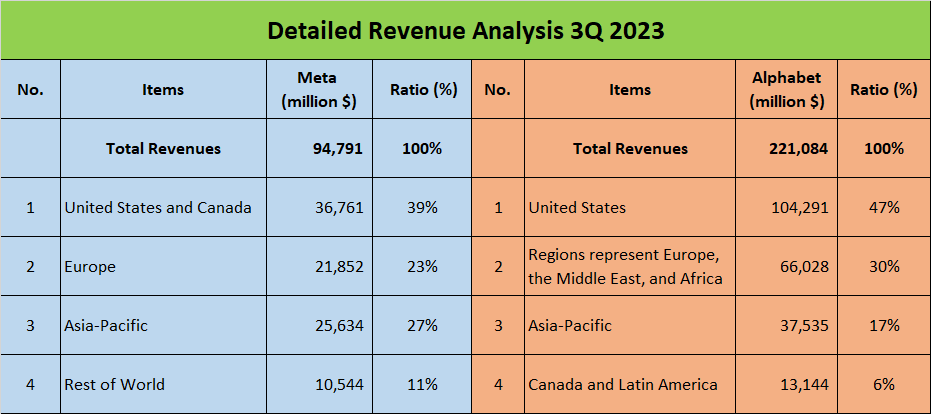
Breaking down these revenues, we find that 39% of Meta’s revenue originated from the United States and Canada, 23% from Europe, 27% from Asia-Pacific, and the remaining 11% from the rest of the world. In contrast, Alphabet’s revenue composition comprised 47% from the United States, 30% from Europe, the Middle East, and Africa (EMEA), 17% from Asia-Pacific, and a mere 6% from Canada and Latin America.
Now, let’s delve into the historical revenue trends. In the third quarter of 2018, Meta reported revenue of $38B, while Alphabet’s revenue was $98B. Fast forward to the third quarter of 2023, and we witness substantial growth in both companies. Meta’s revenue has surged at a Compound Annual Growth Rate (CAGR) of 20% to reach $95B, whereas Alphabet’s revenue has ascended at a CAGR of 18% to reach $221B.
In essence, over the past five years, both companies have experienced remarkable revenue growth. Meta has more than doubled its revenue, while Alphabet has added a staggering $123B to its revenue stream.
These figures underscore the impressive growth and robust economic performance of both entities. They have not only expanded their revenue streams but also broadened their global footprint, penetrating markets worldwide.
While Alphabet’s total revenue surpasses that of Meta by more than double, both companies have demonstrated remarkable revenue growth over the past five years.
Meta vs Alphabet Stock Analysis: Profit Insights
Let’s delve into the profit margins and strategies employed by Meta and Alphabet. The differences are intriguing.
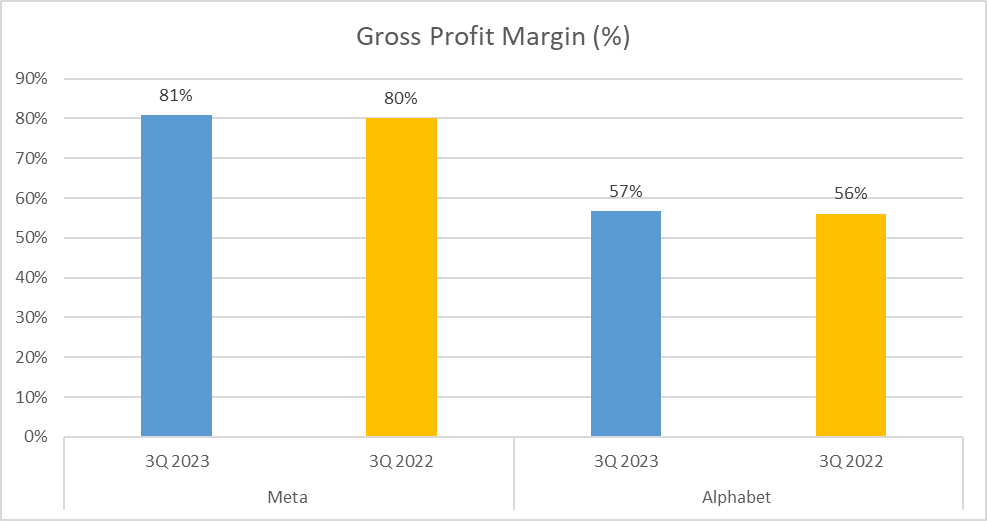
In terms of gross profit margin, Meta leads the pack with a substantial 81%, leaving Alphabet trailing at 57%. This means that Meta retains 81 cents for every dollar generated as gross profit, compared to Alphabet’s 57 cents.
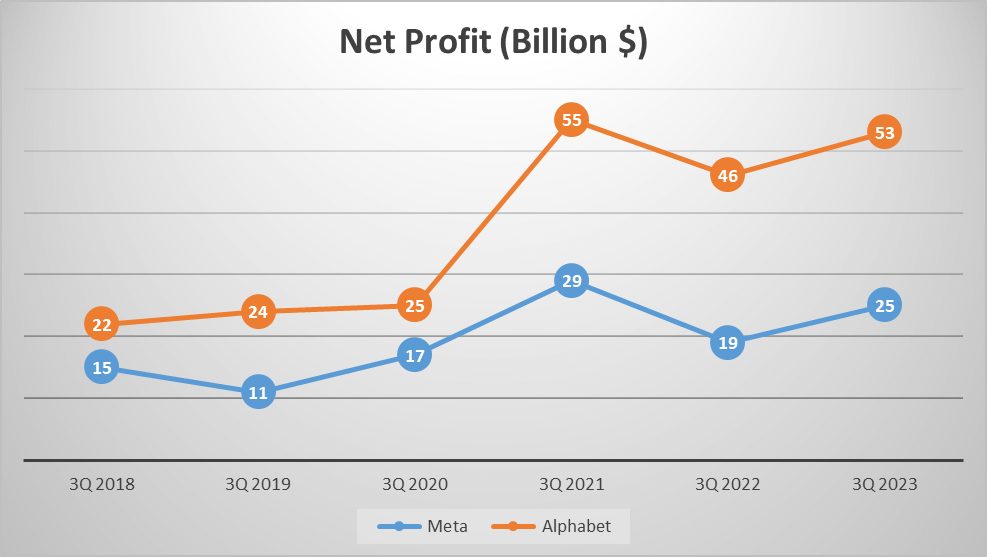
However, when it comes to net profit, Alphabet takes the lead. As of the end of the third quarter of 2023, Alphabet reported a net profit of $53B, surpassing Meta’s $25B. This showcases Alphabet’s superior ability to convert sales into actual profit after deducting all expenses.
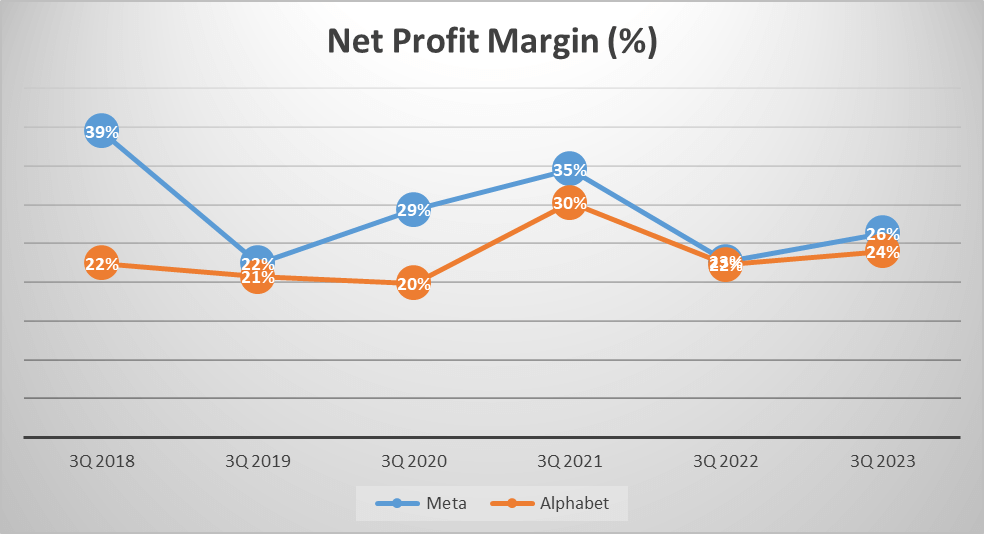
In terms of net profit margin, both tech giants are closely matched. Meta reported a net profit margin of 26%, while Alphabet was slightly behind at 24%. This means that Meta retains 26 cents from each dollar of revenue after covering all costs and expenses, whereas Alphabet retains 24 cents.
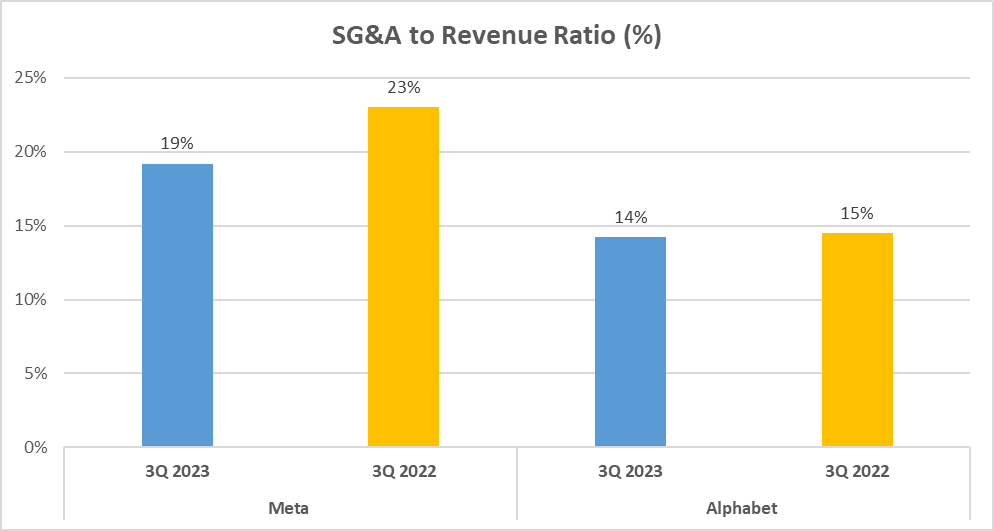
But how efficient are these companies in managing their operating expenses? Meta reported a Selling, General, and Administrative expenses to Revenue Ratio (SG&A to Revenue Ratio) of 19%, while Alphabet reported a lower percentage at 14%. This indicates that Alphabet spends less on operating expenses per dollar of revenue compared to Meta.
Now, let’s examine the net profit growth of these companies over the past five years. From the third quarter of 2018 to the same period in 2023, Meta has seen its net profit grow at a Compound Annual Growth Rate (CAGR) of 11%, while Alphabet has experienced a higher CAGR of 19%.
In summary, while Alphabet boasts a higher net profit, Meta exhibits a larger gross profit margin. Each company has its strengths and weaknesses, making the world of tech investing an intriguing and dynamic landscape.
Meta vs Alphabet Stock Analysis: Efficiency and Liquidity
Next, let’s delve into Meta and Alphabet’s efficiency and liquidity, crucial elements shaping the financial robustness of these tech giants.
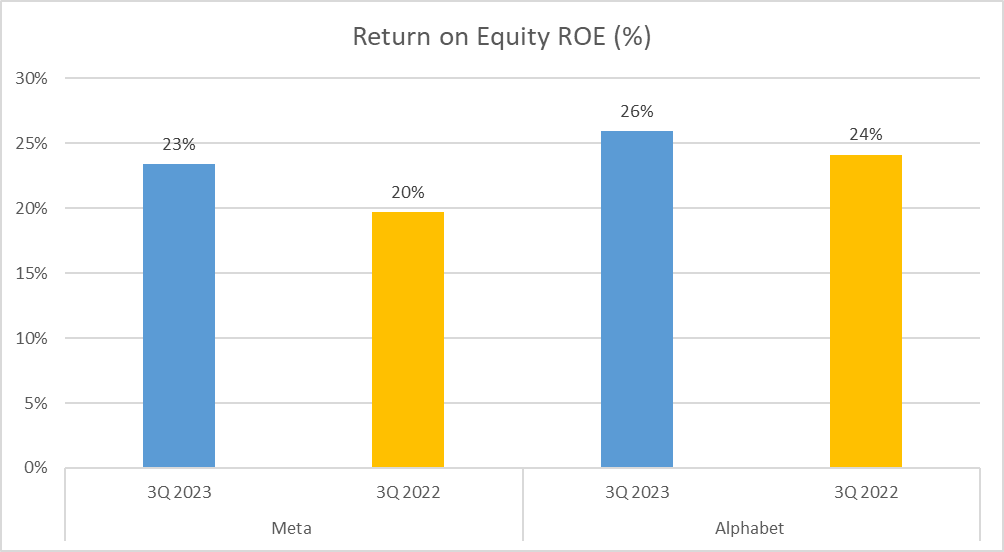
Beginning with Return on Equity (ROE), a metric indicating a company’s profitability relative to shareholders’ investments. Meta boasts an ROE of 23%, slightly trailing Alphabet’s marginally higher figure of 26%.
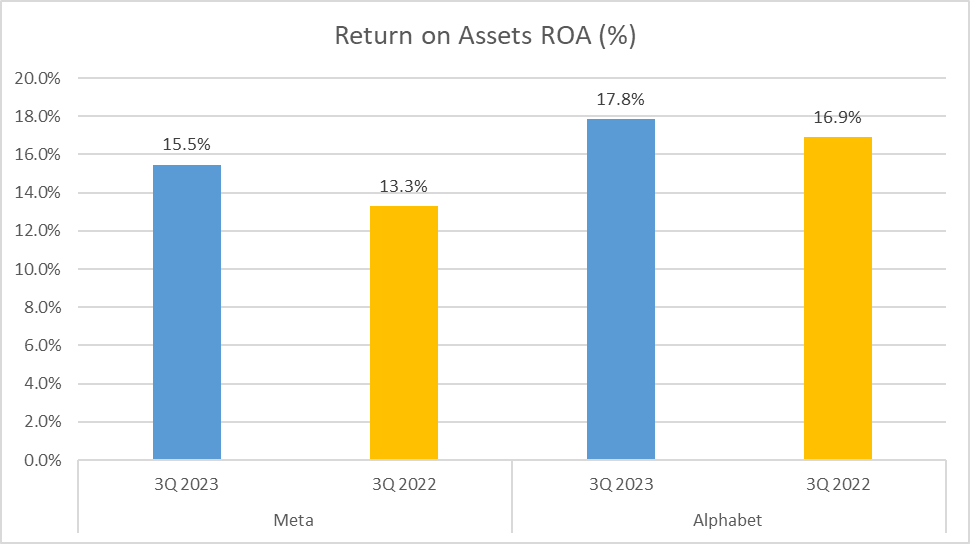
Moving on to Return on Assets (ROA), which gauges how efficiently a company utilizes its assets to generate earnings. Meta achieves an ROA of 15.5%, while Alphabet excels with 17.8%.
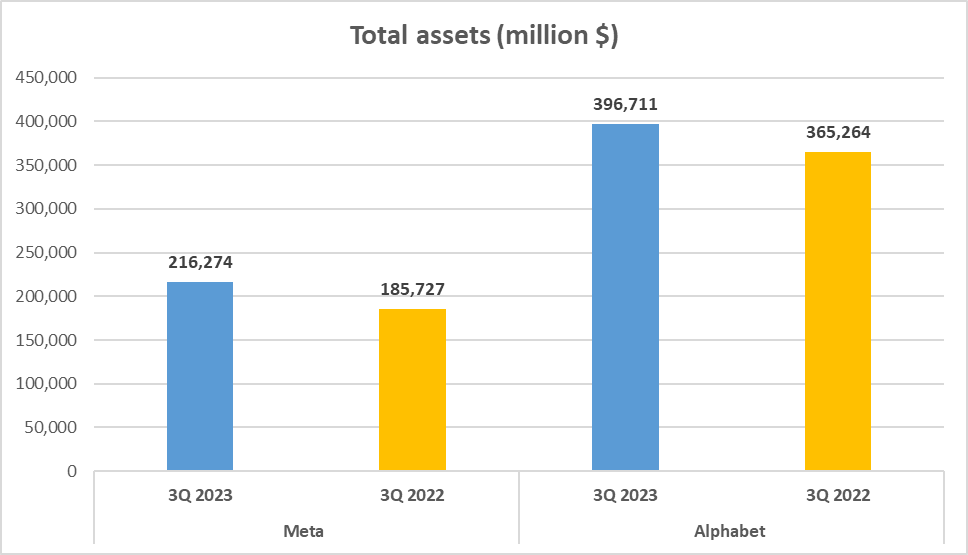
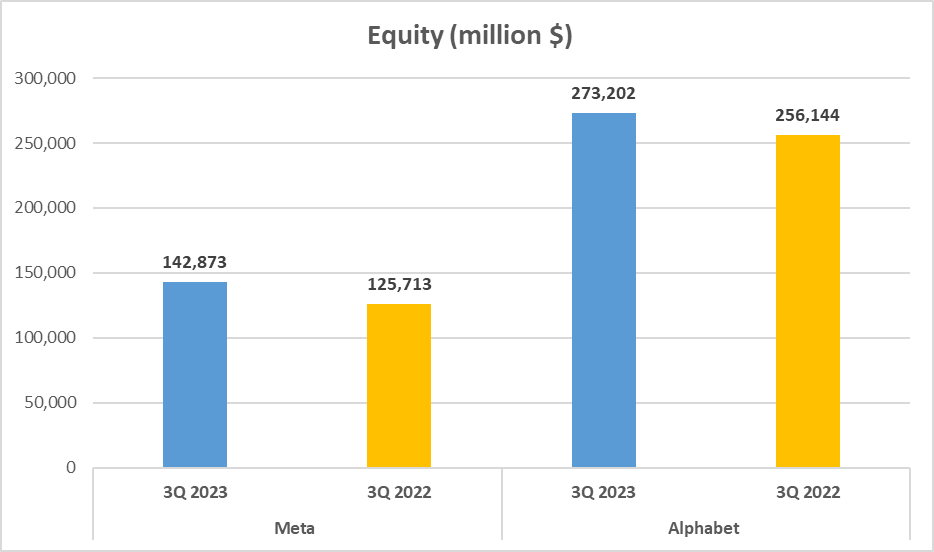
Now, let’s discuss total assets and equity. Meta holds total assets worth $216B, with equity or net assets totaling $143B. In contrast, Alphabet commands total assets of $397B, with equity reaching $273B.
This leads us to the Equity to Total Assets ratio, shedding light on a company’s financial leverage. Meta boasts a ratio of 66%, while Alphabet’s ratio slightly surpasses at 69%.
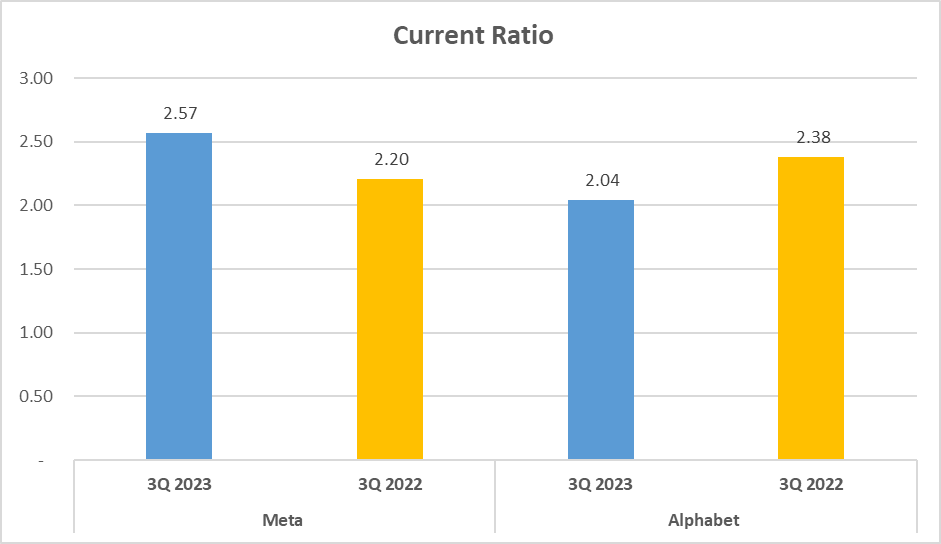
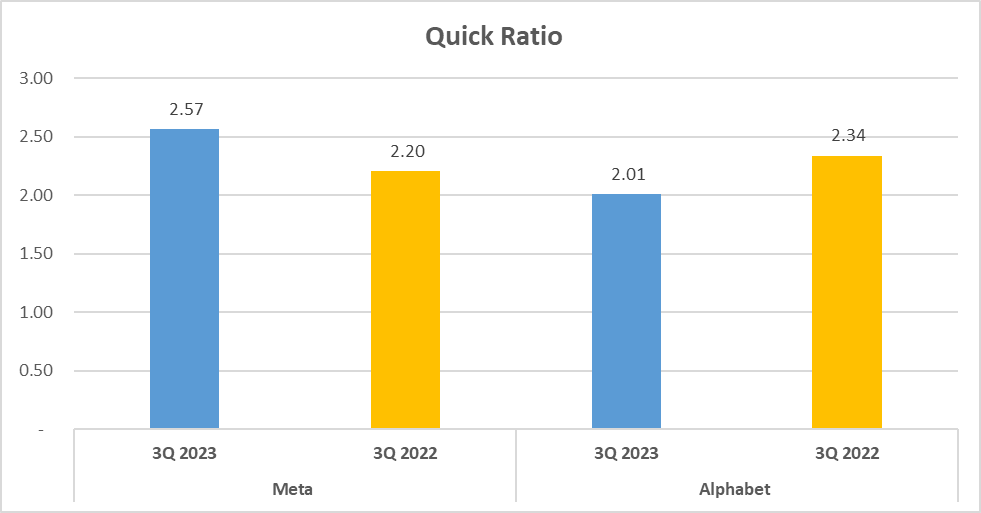
Transitioning to liquidity ratios, crucial for assessing a company’s short-term debt repayment capability. Meta’s current ratio and quick ratio stand at 2.57, reflecting solid liquidity. In comparison, Alphabet’s current ratio is slightly lower at 2.04, with a quick ratio of 2.01.
Lastly, let’s explore the Total Assets Turnover, revealing how effectively a company employs its assets to generate sales. Meta’s total assets turnover is 0.63, while Alphabet’s surpasses at 0.77.
Both companies exhibit robust liquidity and efficiency, rendering them compelling investment prospects.
Meta vs Alphabet Stock Analysis: Operational Efficiency and Cash Flow
Let’s explore operational efficiency and cash flow, pivotal factors in assessing the financial performance of Meta and Alphabet.
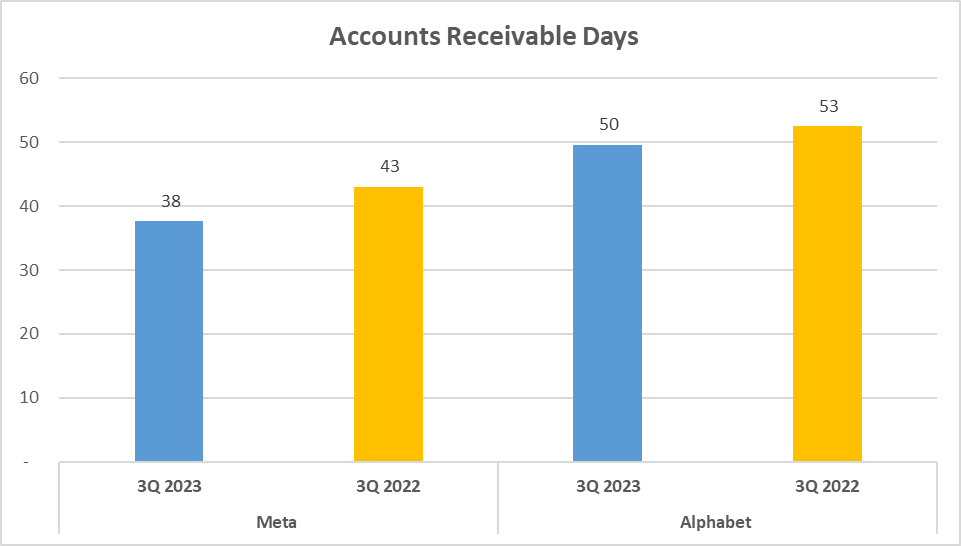
Starting with accounts receivable days, reflecting the average time taken by a company to collect payment post-sale. Meta boasts a swift 38 days, whereas Alphabet extends to 50 days. This suggests Meta’s adeptness in credit control policies.
Moving on to cash generated by operating activities, Meta reports $52B, while Alphabet surges ahead with $83B, indicating Alphabet’s superior cash generation from core operations.
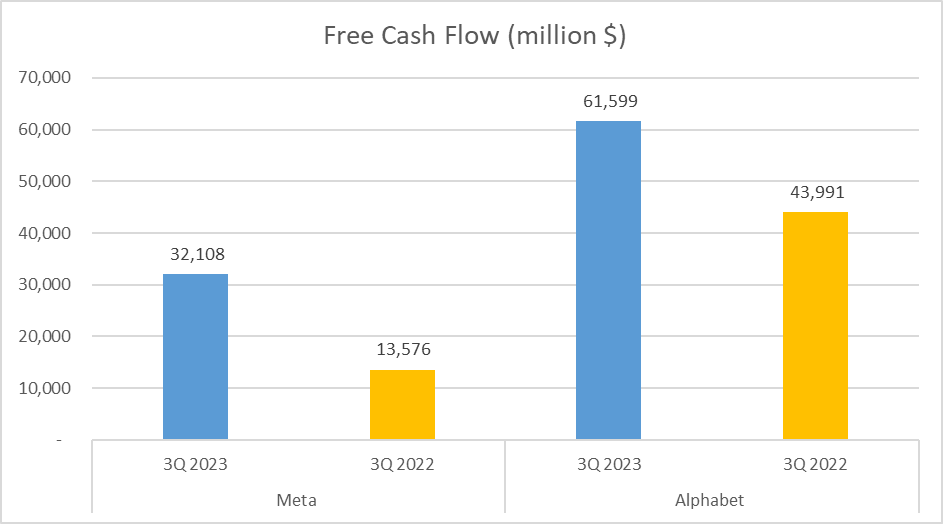
Now, onto free cash flow, representing cash generated post-operational expenses and asset investments. Meta records $32B, whereas Alphabet leads with $62B, signifying Alphabet’s greater cash availability for stakeholders.
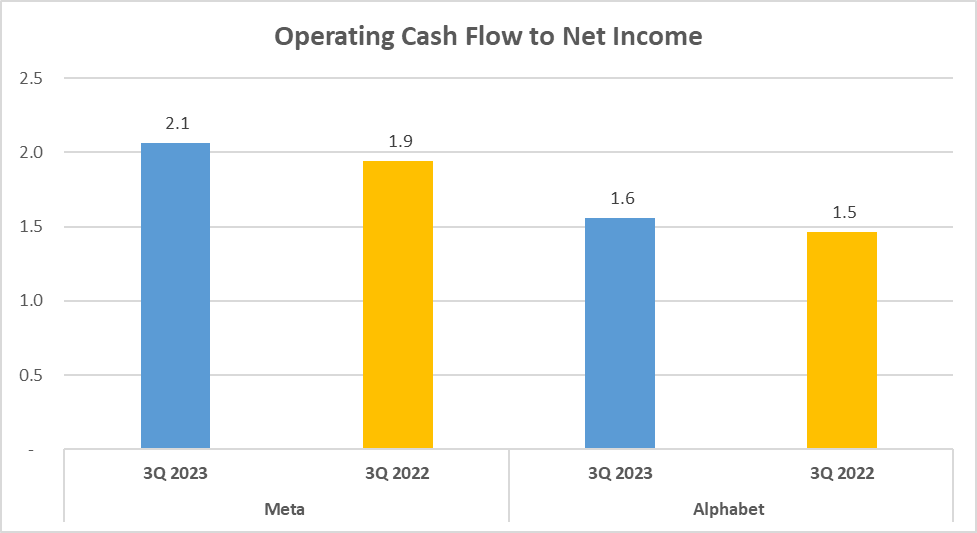
Lastly, operating cash flow to net income ratio highlights Meta’s efficiency in converting net profit into cash, with a ratio of 2.1, surpassing Alphabet’s 1.6.
In summary, while Alphabet excels in operating cash generation and free cash flow, Meta exhibits faster collection processes and higher efficiency in converting net profit to cash. Alphabet holds a slight operational efficiency and cash flow edge, yet Meta remains closely competitive.
Meta vs Alphabet Stock Analysis: DuPont Analysis and Conclusion
Lastly, let’s conduct a DuPont Analysis to dissect the Return on Equity (ROE) of both Meta and Alphabet, breaking it down into three components: net profit margin, asset turnover ratio, and asset-to-equity ratio.
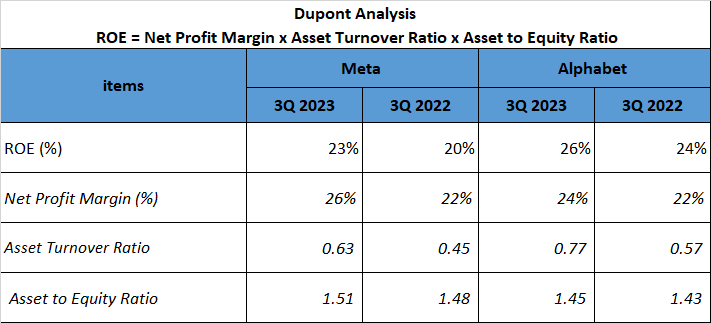
For Meta, boasting an ROE of 23%, we observe a net profit margin of 26%, an asset turnover ratio of 0.63, and an asset-to-equity ratio of 1.51. Conversely, Alphabet, with an ROE of 26%, demonstrates a net profit margin of 24%, an asset turnover ratio of 0.77, and an asset-to-equity ratio of 1.45.
This analysis unveils the diverse factors influencing the ROEs of these tech giants.
In conclusion, both Meta and Alphabet exhibit robust financial performance, each with unique strengths. Understanding these intricacies aids in making informed investment decisions.
Stay tuned for further financial analyses of leading companies.
Author: investforcus.com
Follow us on Youtube: The Investors Community

