NIO Stock Analysis – Have you ever wondered what your one thousand dollars invested in NIO back in 2018 would be worth now, in March 2024?
Surprisingly, that investment would have dwindled to $876, marking a decrease of 12% over six years. But what if you had chosen to withdraw your investment by the end of 2020 or early 2021?

In just two years, you would have witnessed an eight-fold increase in your investment value. These fluctuations in NIO’s stock value are nothing short of fascinating, aren’t they?
It’s akin to riding a roller coaster, a thrill that only the most daring investors are willing to embrace. But what exactly caused these fluctuations?
What factors contributed to the significant drop in NIO stock value following its initial surge?
To unravel this mystery, let’s delve into NIO’s financial landscape.
Revenue Analysis – NIO Stock Analysis
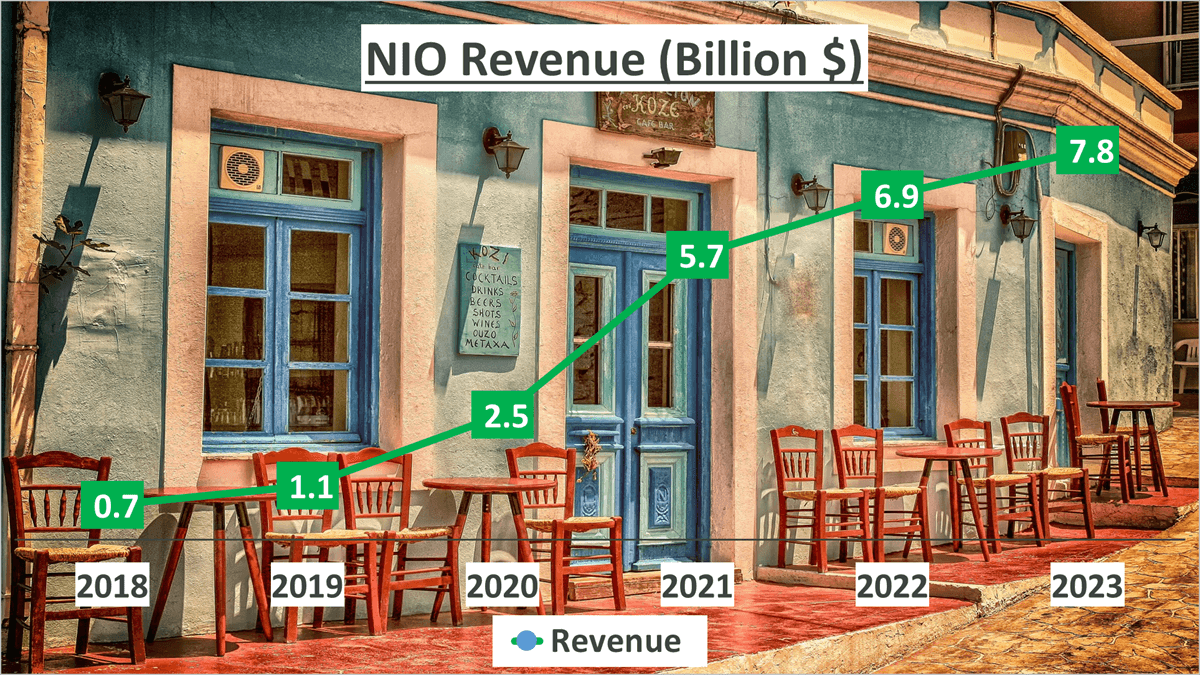
Let’s delve into NIO’s revenue figures. In 2023, NIO’s revenue soared to an impressive $7.8B. If we backtrack to 2018, the Compound Annual Growth Rate (CAGR) stands at a remarkable 62%, showcasing NIO’s scalability and market dominance in a fiercely competitive sector.
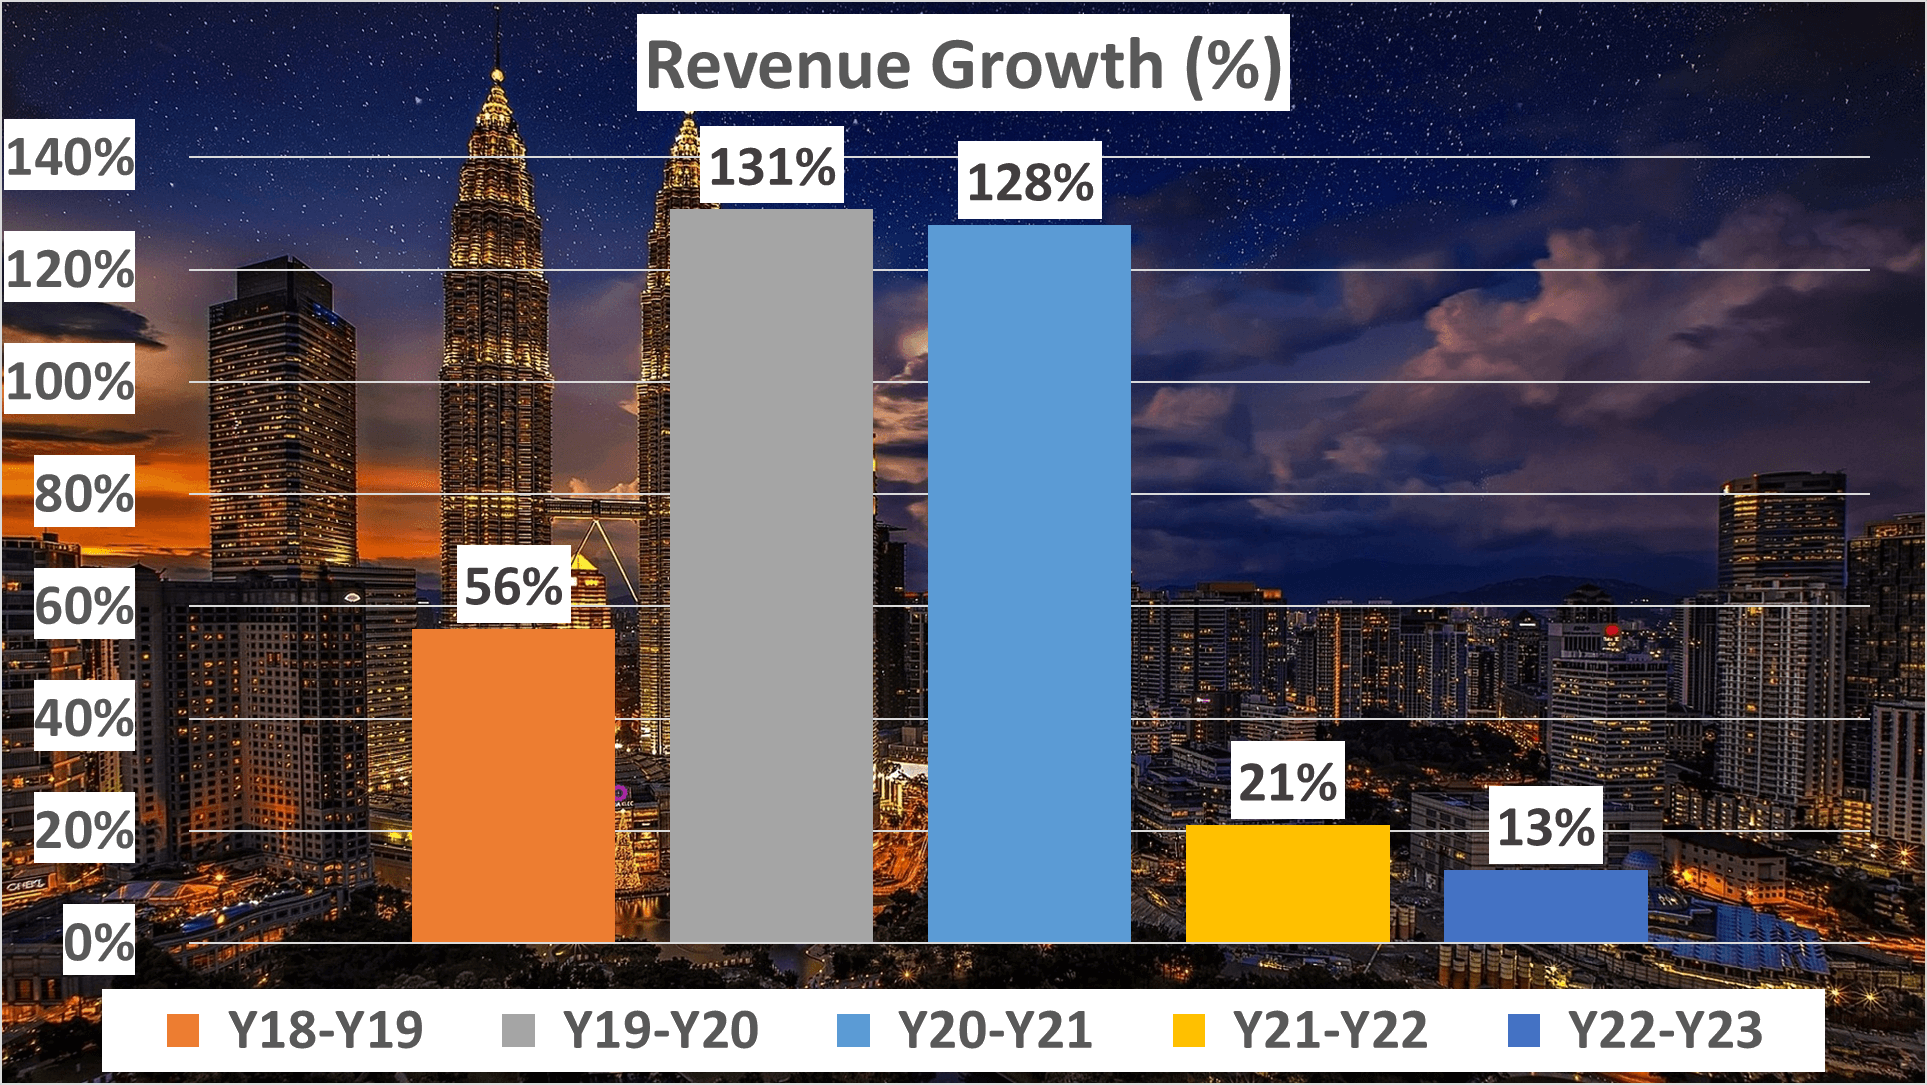
Year-on-year sales growth has been stellar too. Between 2018 and 2019, there was a 56% surge. This escalated to a staggering 131% from 2019 to 2020, maintaining momentum with a 128% increase in 2021. However, growth tapered off slightly in subsequent years, registering at 21% in 2022 and 13% in 2023.
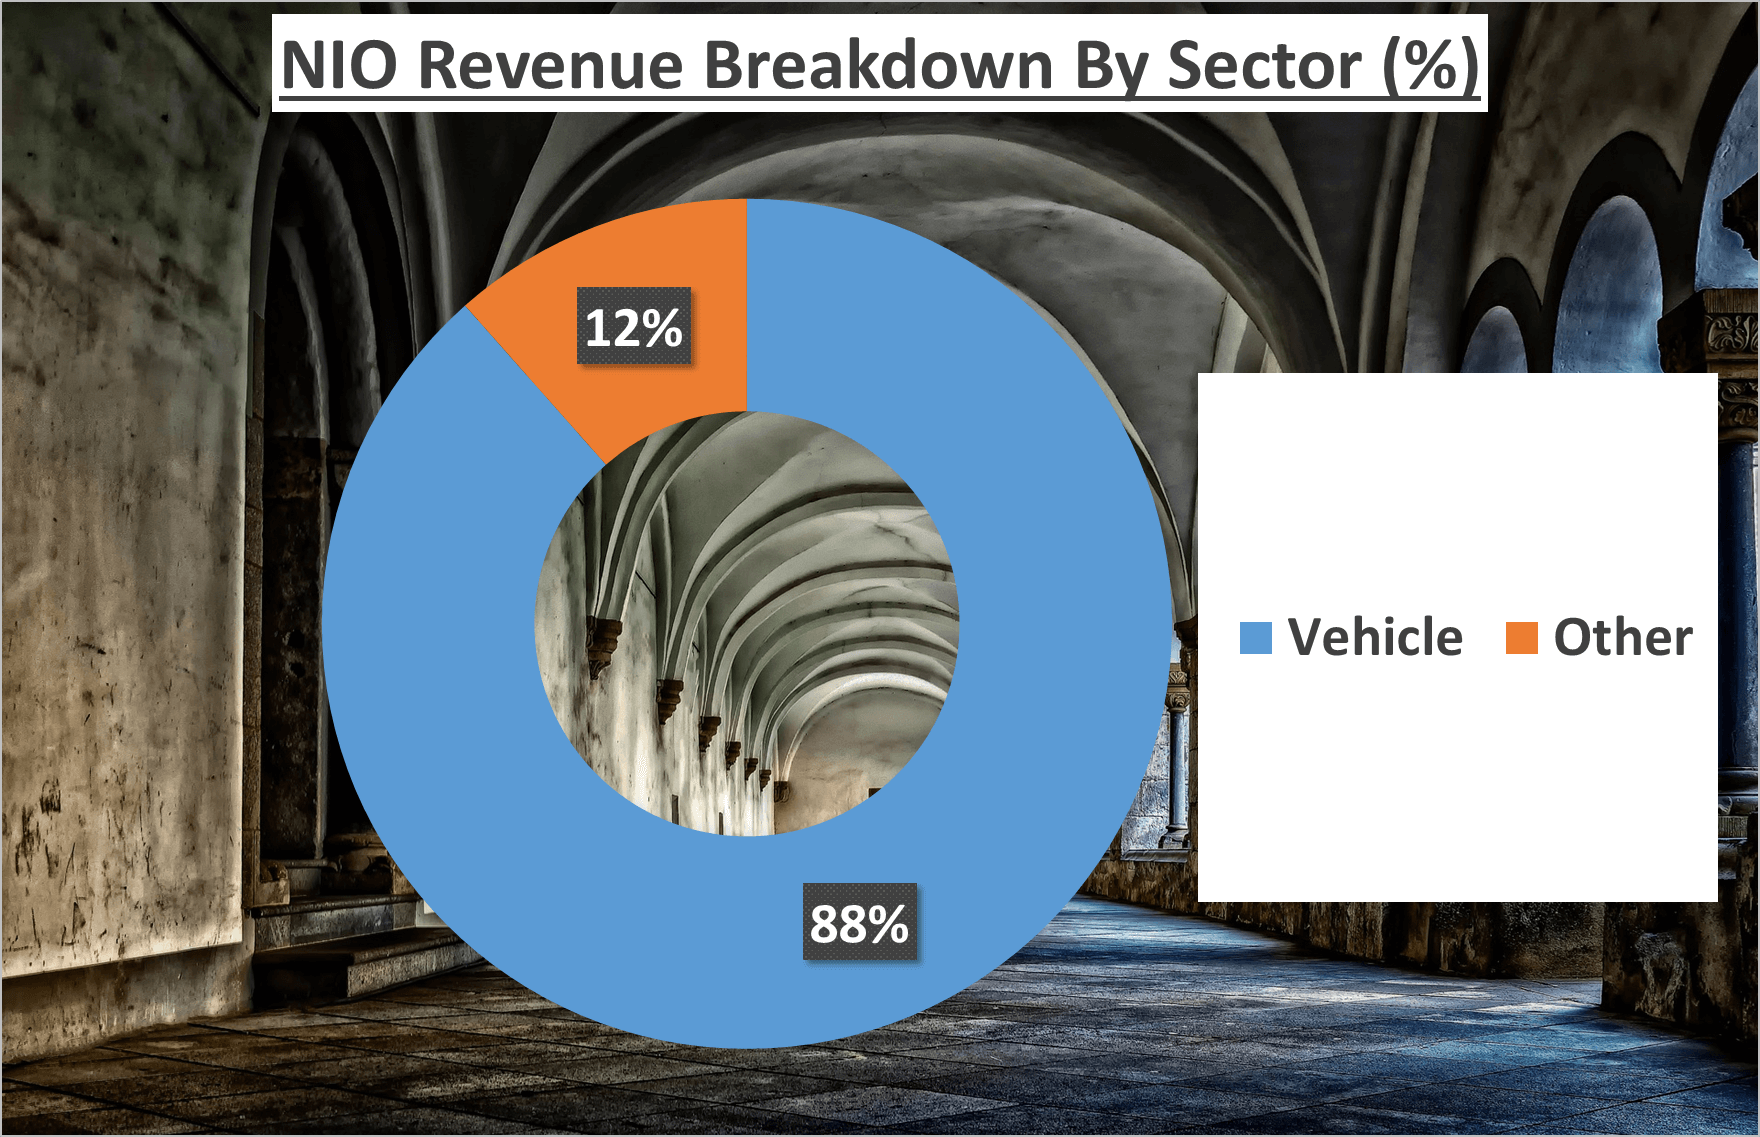
Now, let’s dissect the revenue breakdown. Vehicle sales contribute 88%, with the remaining 12% from other sources. This underscores NIO’s heavy reliance on vehicle sales, with limited revenue diversification.
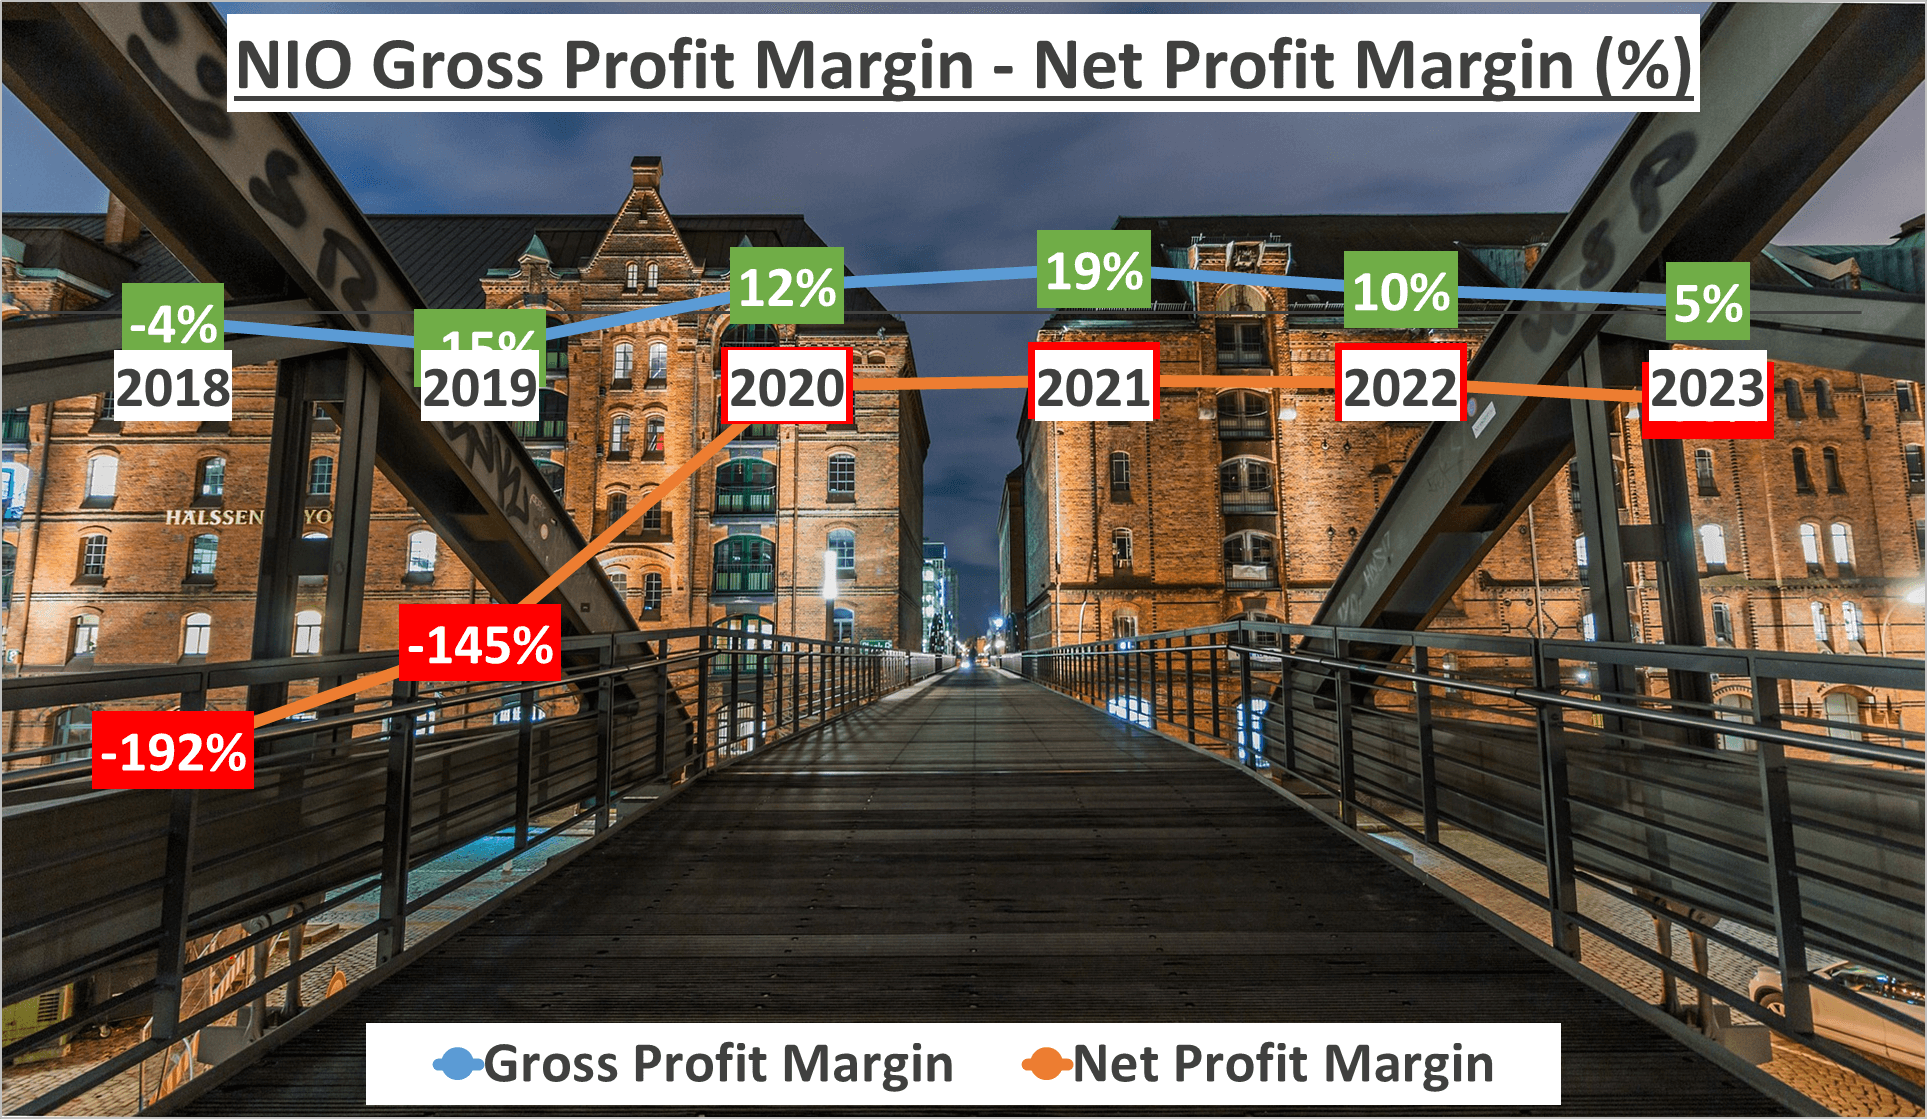
However, revenue is just part of the equation. It’s crucial to assess profit conversion. NIO’s Gross Profit Margin in 2023 stood at 5%, consistent with the five-year average. Yet, the Net Profit Margin plunges to a negative 38%, reflecting substantial costs.
Research and Development accounted for 23% of revenue, with Selling, General, and Administrative expenses comprising 24%.
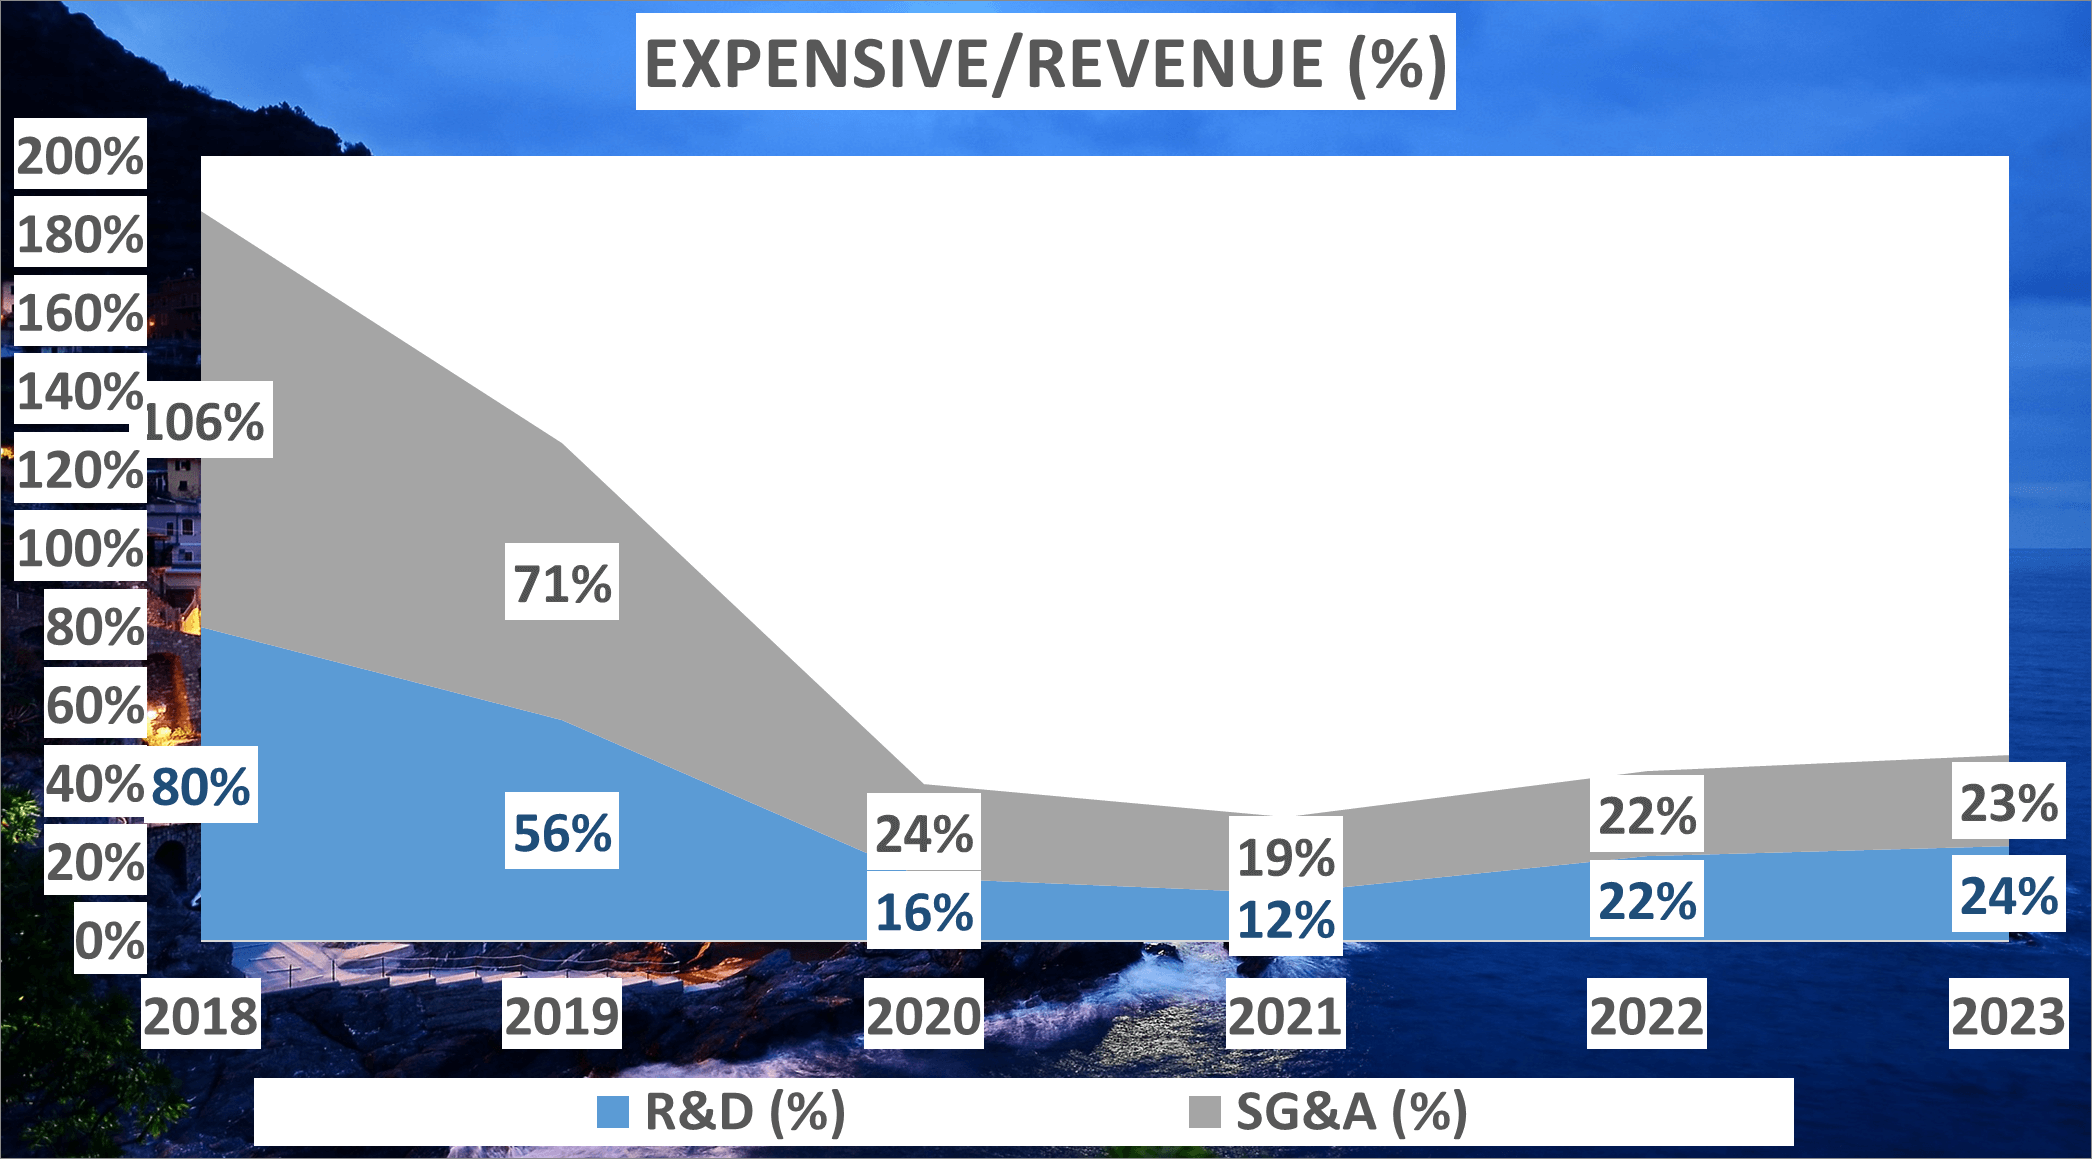
Although these expenses witnessed a downward trajectory from 2018 to 2023, the 5% Gross Profit Margin suggests potential product underpricing or elevated production costs due to low manufacturing volumes.
Now, let’s shift focus to NIO’s net profit. In 2023, NIO reported a staggering net loss of $3B. The trend from 2018 to 2023 has been increasingly negative, with losses mounting from $1.3B in 2018 to $3B in 2023.
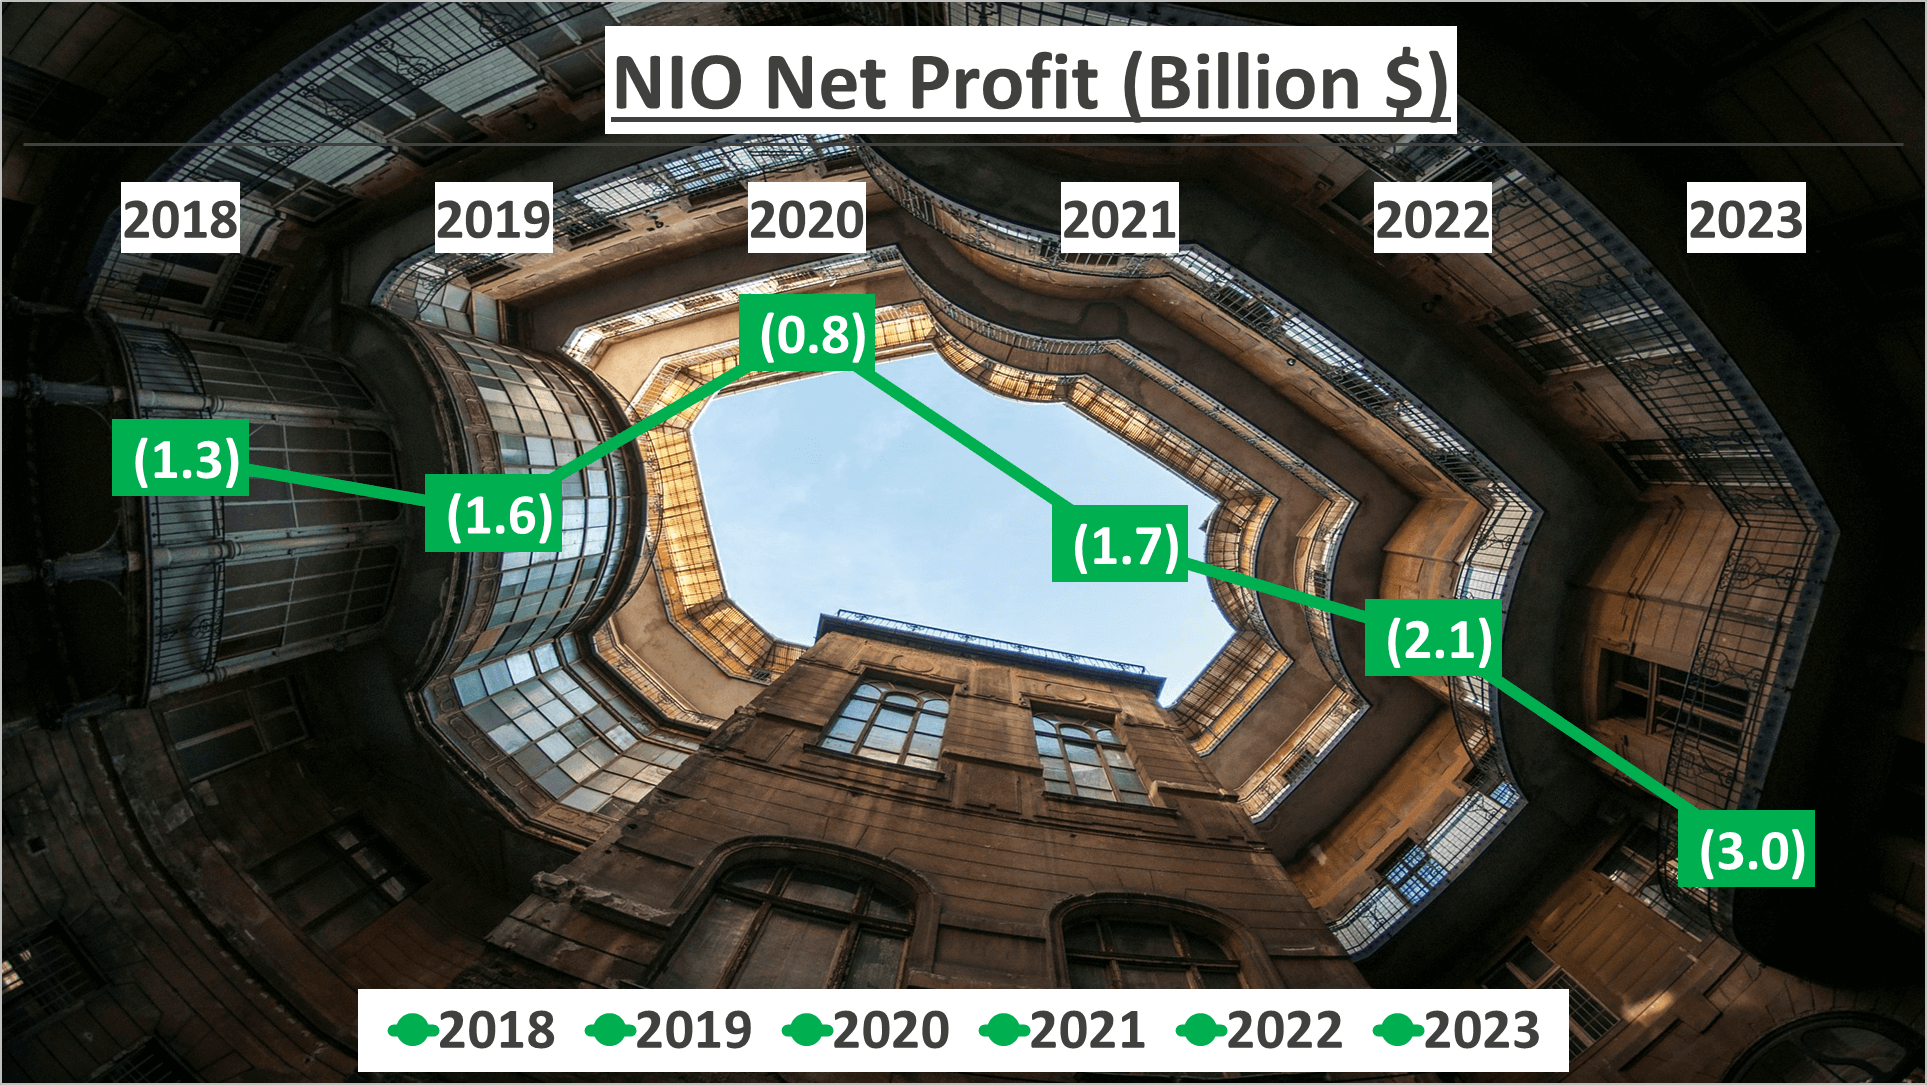
Despite revenue growth, NIO’s net profit paints a starkly different picture. Stay tuned as we explore NIO’s assets and ratios in the upcoming segment.
Assets and Ratios – NIO Stock Analysis
Let’s assess NIO’s assets and financial ratios.
In 2023, NIO’s total assets surged to $16.5B, a significant leap from the previous year’s $13.6B. Net assets for the same period amounted to $4.2B, slightly up from $3.9B in 2022. But what does this signify? These figures reflect NIO’s capacity to meet its obligations with owned assets.
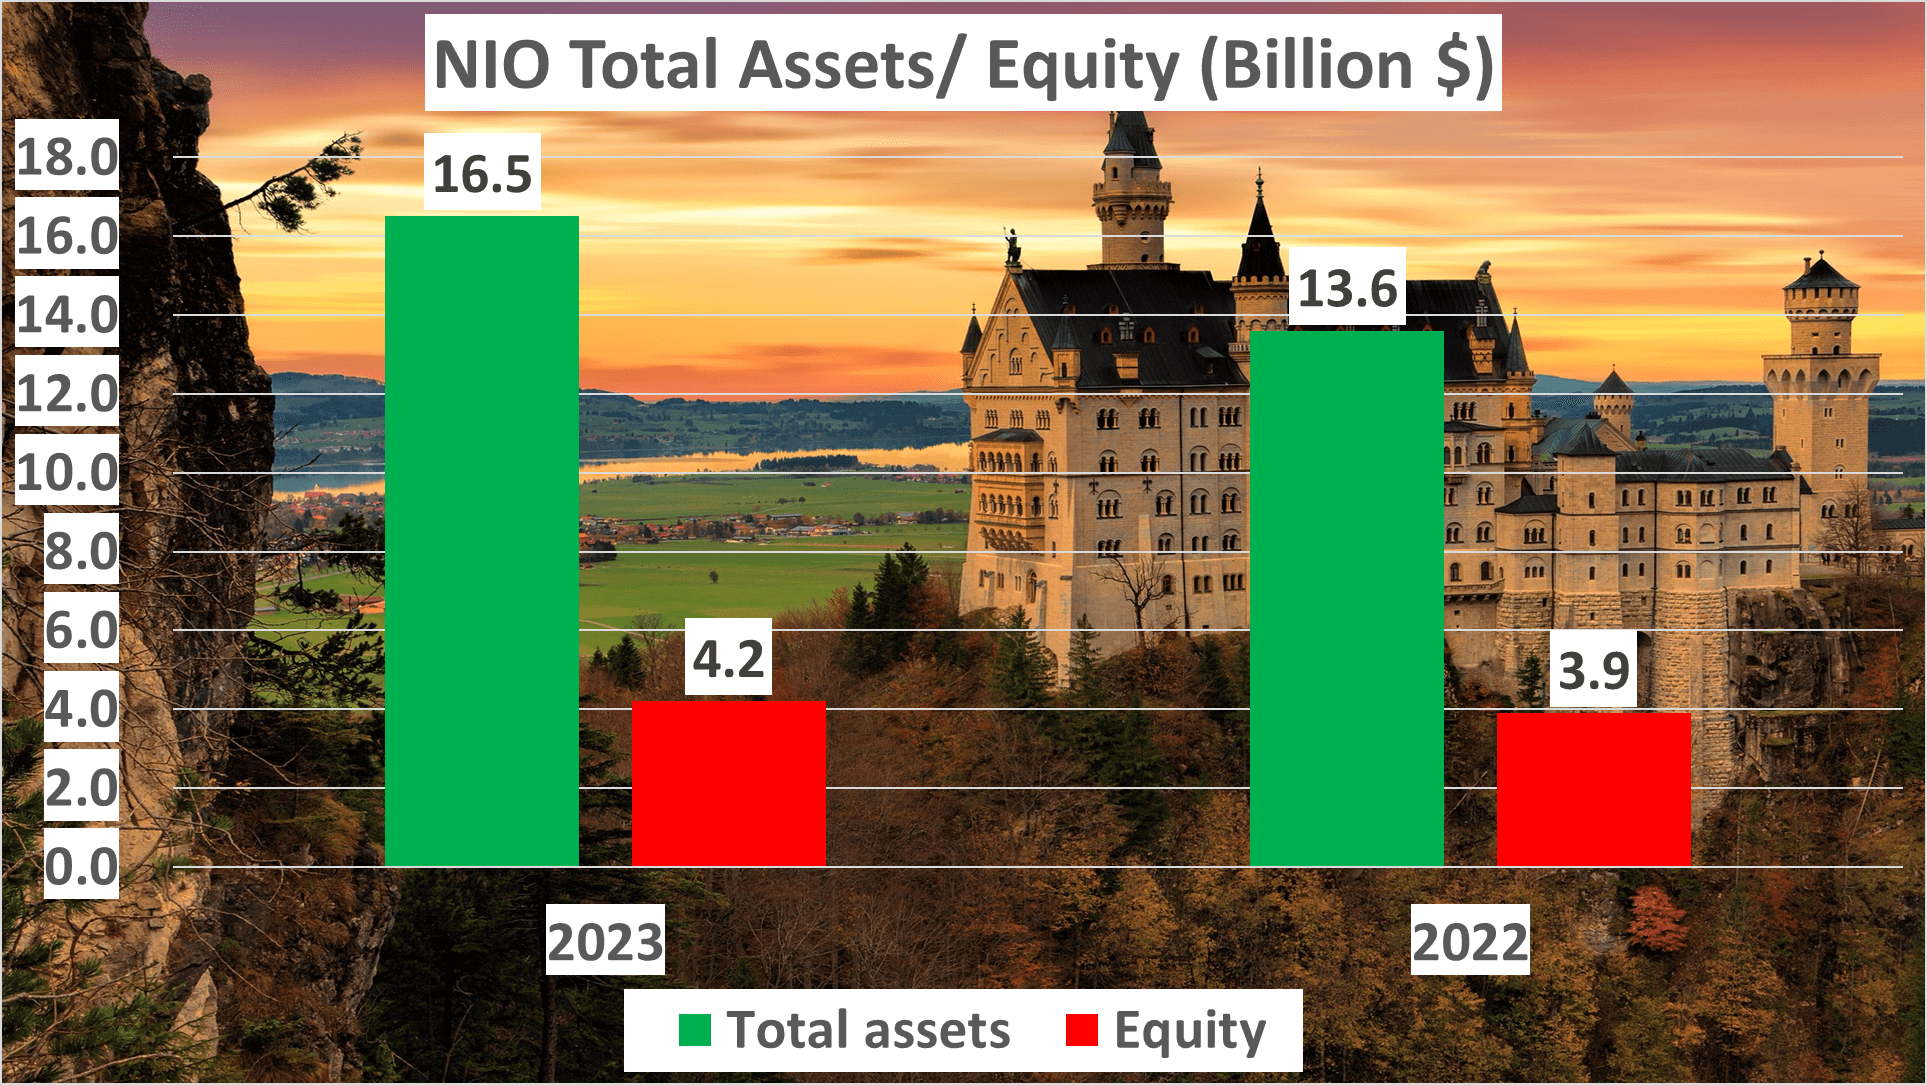
Now, let’s dig deeper into the equity to total assets ratio. In 2023, this ratio dipped to 25%, marginally lower than the 29% in 2022. This gauge of financial leverage suggests a slight uptick in financial risk for NIO.
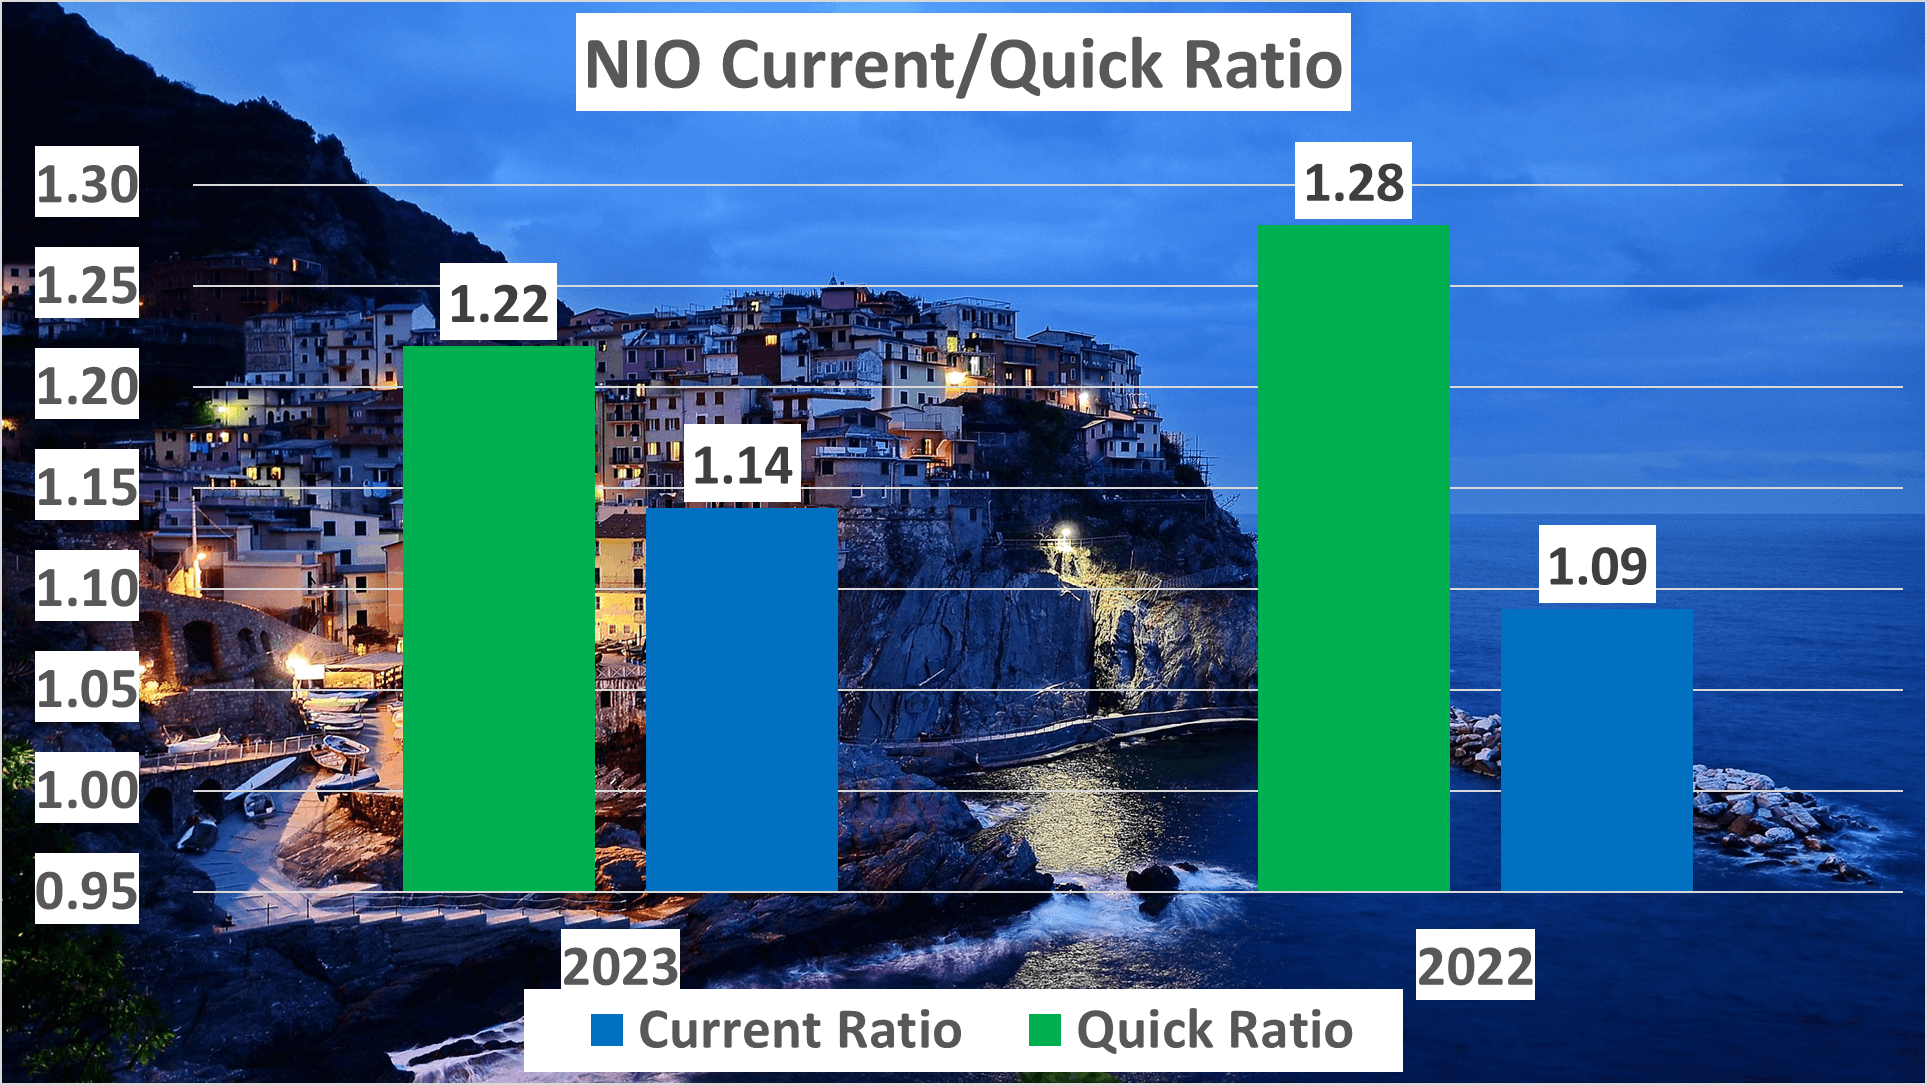
Moving on to liquidity ratios, the current ratio in 2023 was 1.22, down from 1.28 in 2022. Conversely, the quick ratio rose from 1.09 in 2022 to 1.14 in 2023. These ratios measure NIO’s ability to settle short-term obligations, with higher values indicating improved liquidity.
Lastly, let’s examine NIO’s inventory and receivable days. In 2023, inventory days plummeted to 47 from 71 the previous year, indicating enhanced inventory turnover. Conversely, receivable days dropped to 33 from 37 in 2022, suggesting expedited customer payment collection.
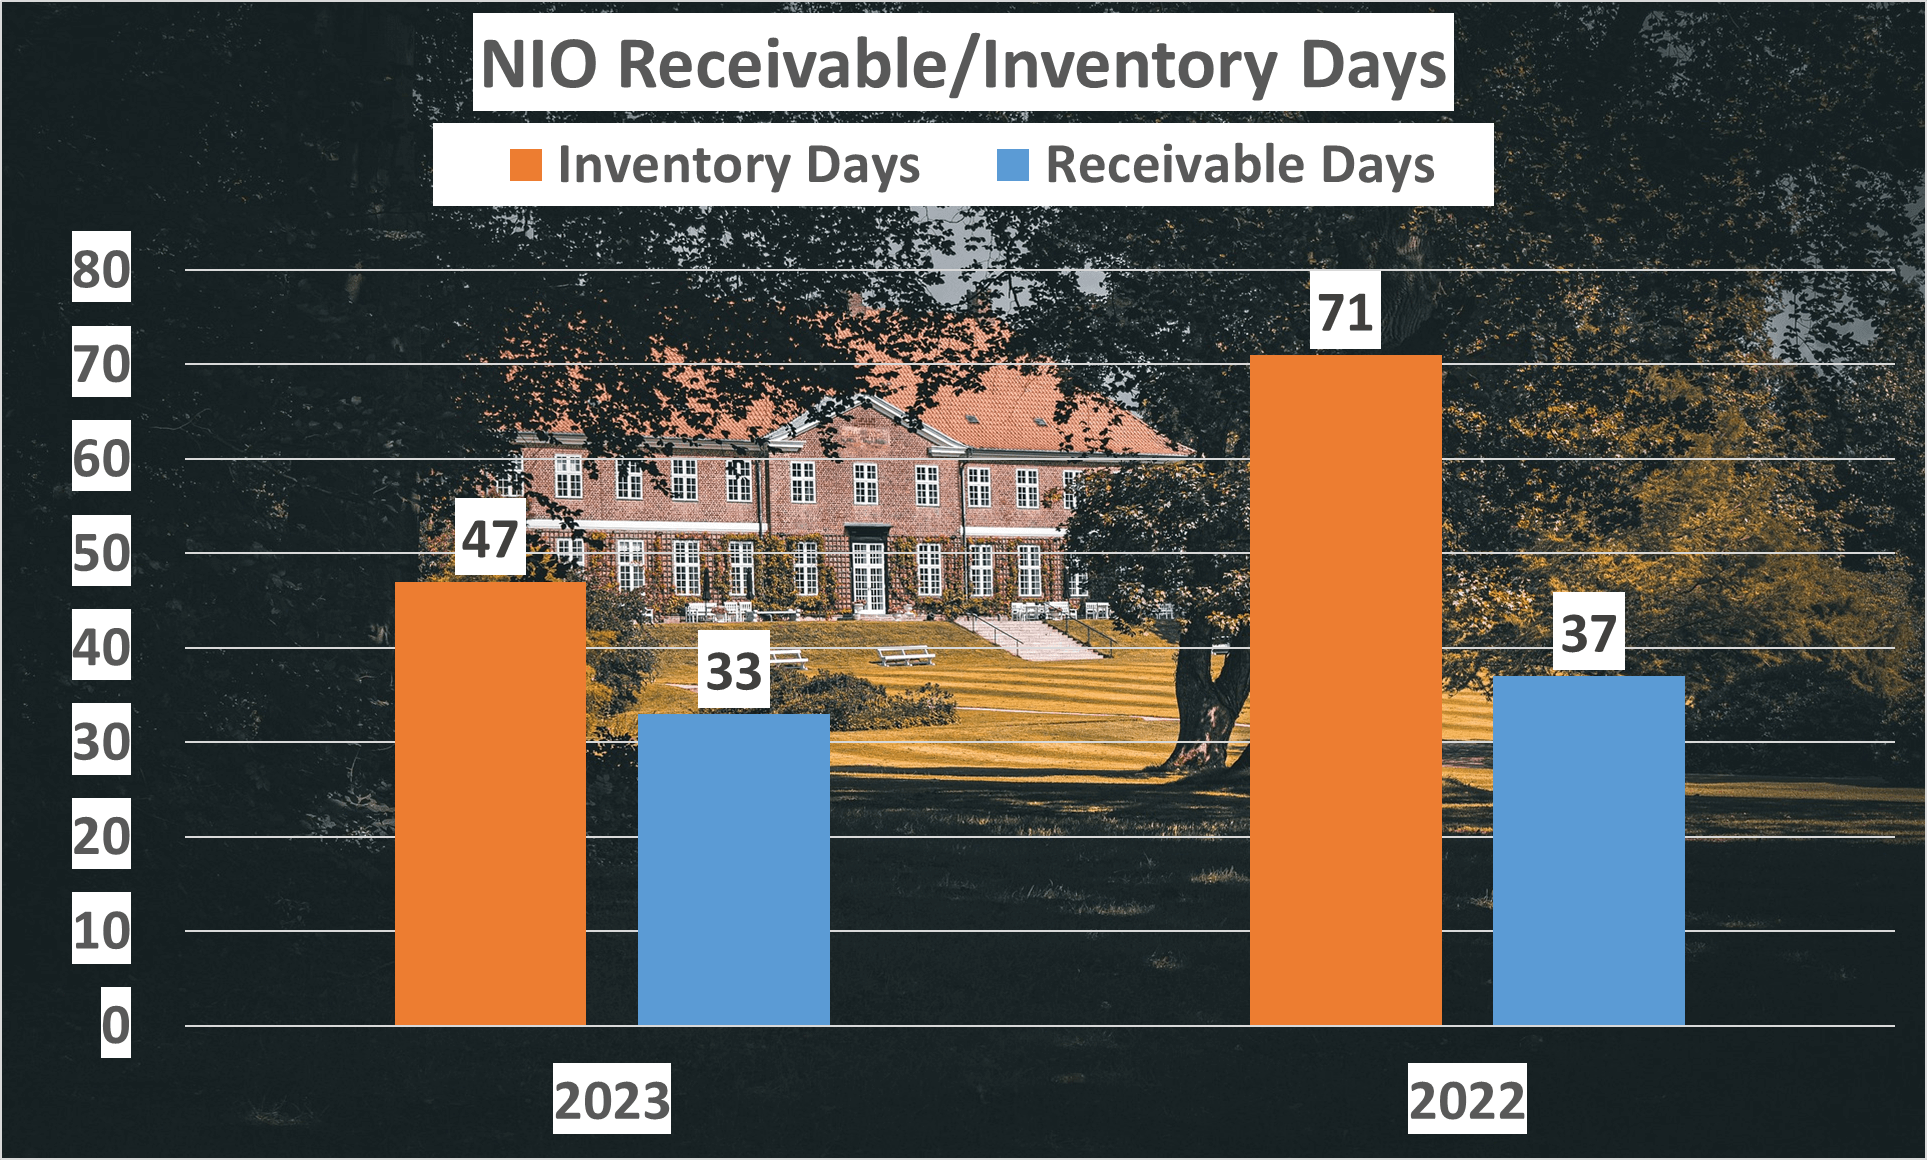
These metrics offer vital insights into NIO’s financial well-being, shedding light on its asset management, liability coverage, and liquidity maintenance—crucial considerations for investors.
Dupont Analysis and Conclusion – NIO Stock Analysis
For a comprehensive grasp, let’s delve into the Dupont analysis. This formula dissects Return on Equity (ROE) into three facets: Net Profit Margin, Asset Turnover, and Equity Multiplier, offering a nuanced view of a company’s financial stance.
In 2023, NIO’s ROE plummeted to -71%, a stark decline from -54% in 2022, indicating a year-on-year profitability downturn relative to invested equity.
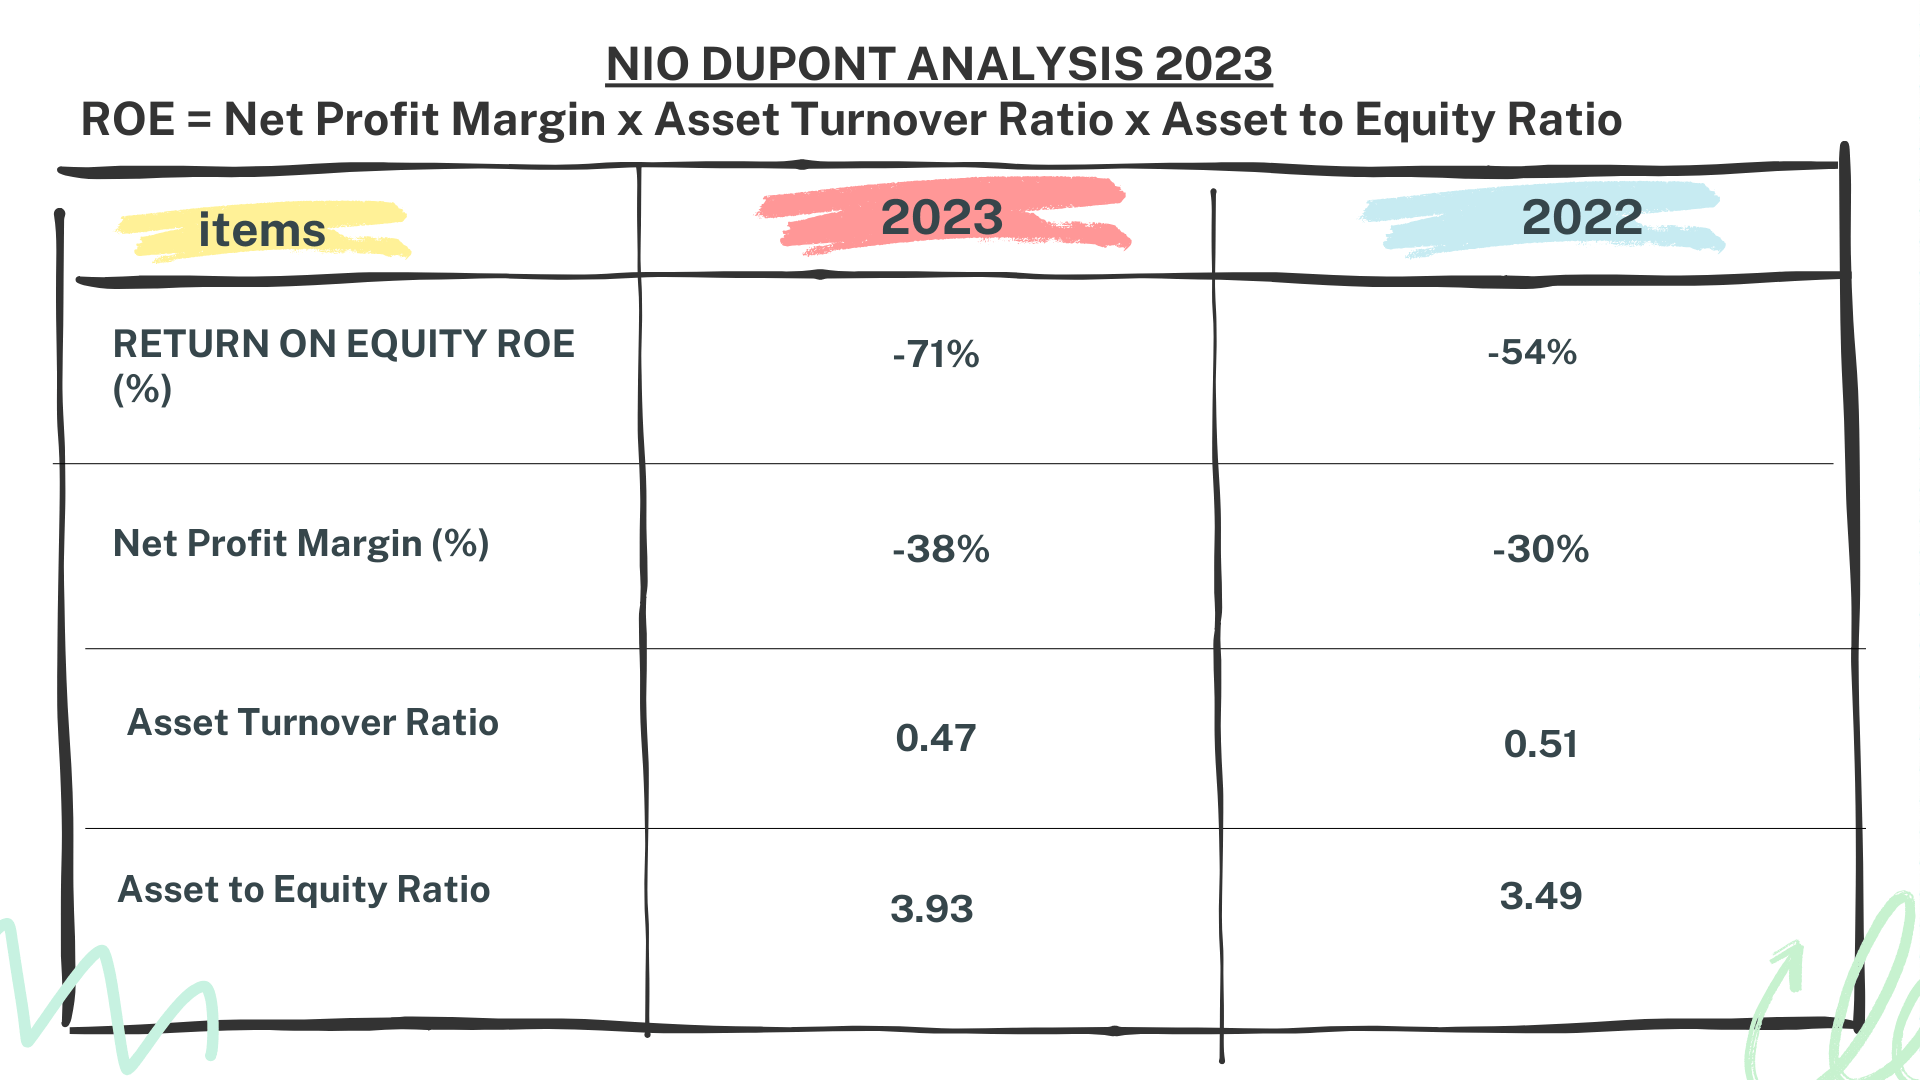
Now, let’s dissect further. The Net Profit Margin, reflecting profit per dollar of revenue, nosedived to -38% in 2023 from -30% in 2022, signaling reduced profitability per revenue dollar.
Asset Turnover, gauging asset efficiency in revenue generation, dipped marginally to 0.47 in 2023 from 0.51 in 2022, indicating diminished asset utility in revenue generation.
Lastly, the Equity Multiplier surged to 3.93 in 2023 from 3.49 in 2022, suggesting heightened debt reliance for asset financing.
So, what’s the takeaway? The dwindling ROE, Net Profit Margin, and Asset Turnover, alongside escalating Equity Multiplier, depict NIO’s challenging financial landscape. However, the crux lies in ameliorating the Net Profit Margin, potentially achieved through enhanced pricing strategies and sales volume—albeit easier said than done.
While NIO grapples with financial hurdles, enhancing the Net Profit Margin remains pivotal. Remember, investing entails risks and rewards.

Wrapping Up – NIO Stock Analysis
Let’s summarize our insights into NIO’s financial standing.
We’ve witnessed impressive revenue growth, yet profitability margins pose challenges. Despite revenue upticks, net profit remains negative—a worrisome aspect.
Delving into assets and ratios, NIO boasts healthy current and quick ratios. However, the declining equity to total assets ratio signals heightened financial risk.
Efficiency shines through in inventory and receivable days, reflecting operational prowess.
Conversely, Dupont analysis paints a bleak picture with a negative return on equity, underscoring the imperative for NIO to bolster its net profit margin for profitability.
Thank you for tuning in. Don’t miss out—subscribe for more insightful analyses, and drop a comment suggesting the next company you’d like us to dissect.
Author: investforcus.com
Follow us on Youtube: The Investors Community


