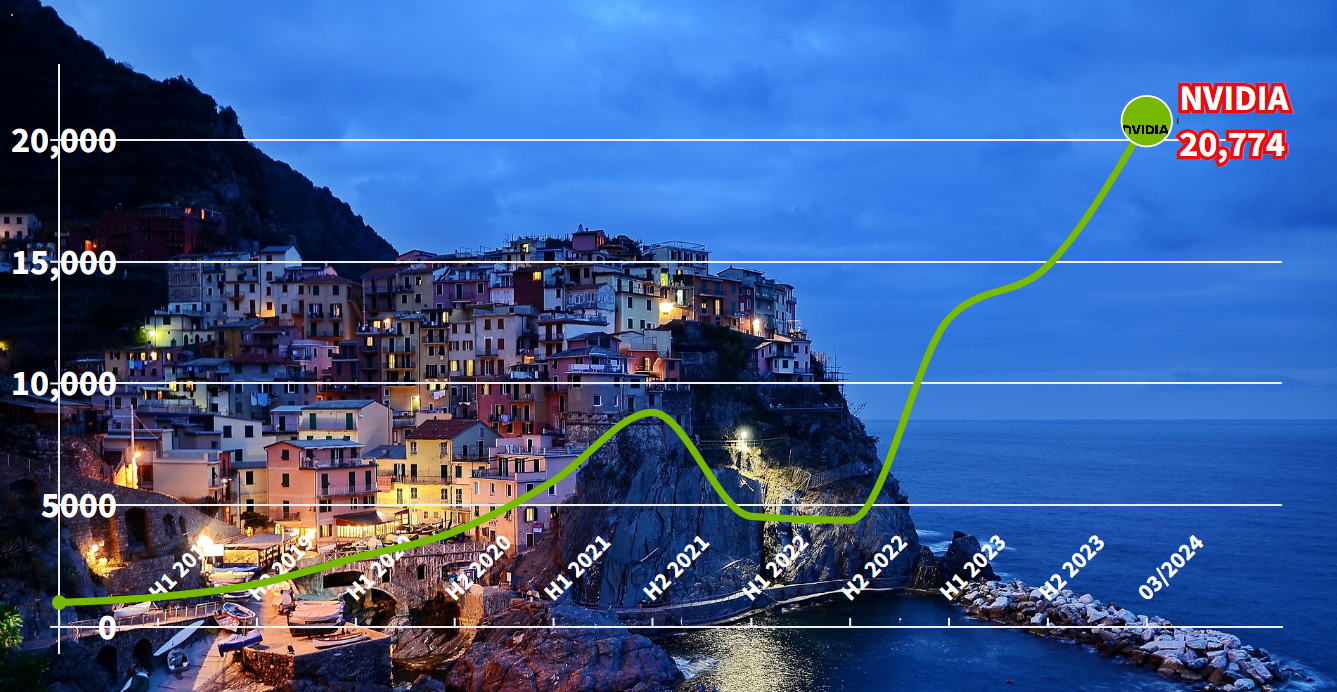
NVIDIA Stock Analysis – Imagine investing $1000 in NVIDIA back in 2018. Fast forward to March 2024, and that $1000 investment has grown to an impressive $20,774. That’s a remarkable 1977% increase, equivalent to a twenty-fold return on investment (ROI).
Yearly Growth and Insights
Annually, this translates to an average growth rate of 83%. To put it simply, it’s like doubling your money almost every year for six consecutive years.
Unveiling NVIDIA’s Success Factors
NVIDIA’s success story is multifaceted, driven by factors such as revenue growth, profit margins, and overall financial stability. Their strategic focus on burgeoning sectors like artificial intelligence and data centers has played a pivotal role.
Understanding the Momentum
Delving deeper, it’s crucial to understand what propelled NVIDIA to such heights and how they sustained this upward trajectory over six years.
Deciphering NVIDIA’s Phenomenal Growth
Exploring the reasons behind NVIDIA’s remarkable growth offers invaluable insights for investors. Let’s delve into why NVIDIA has experienced such substantial growth.
NVIDIA Stock Analysis: Unveiling Revenue Growth Trends
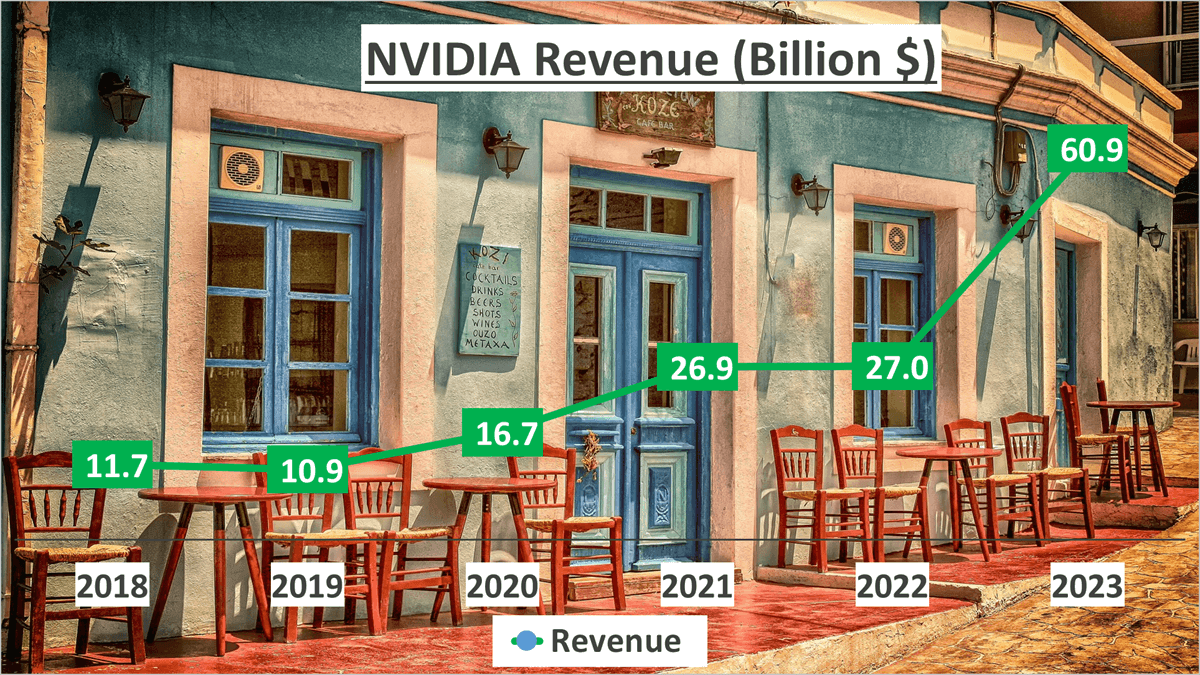
NVIDIA’s revenue trajectory has showcased remarkable consistency since 2018. By twenty twenty-three, the company’s revenue soared to an astounding $60.9B, reflecting a noteworthy compound annual growth rate of 39% since twenty eighteen.
Yearly Revenue Breakdown
Let’s delve into the annual revenue growth:
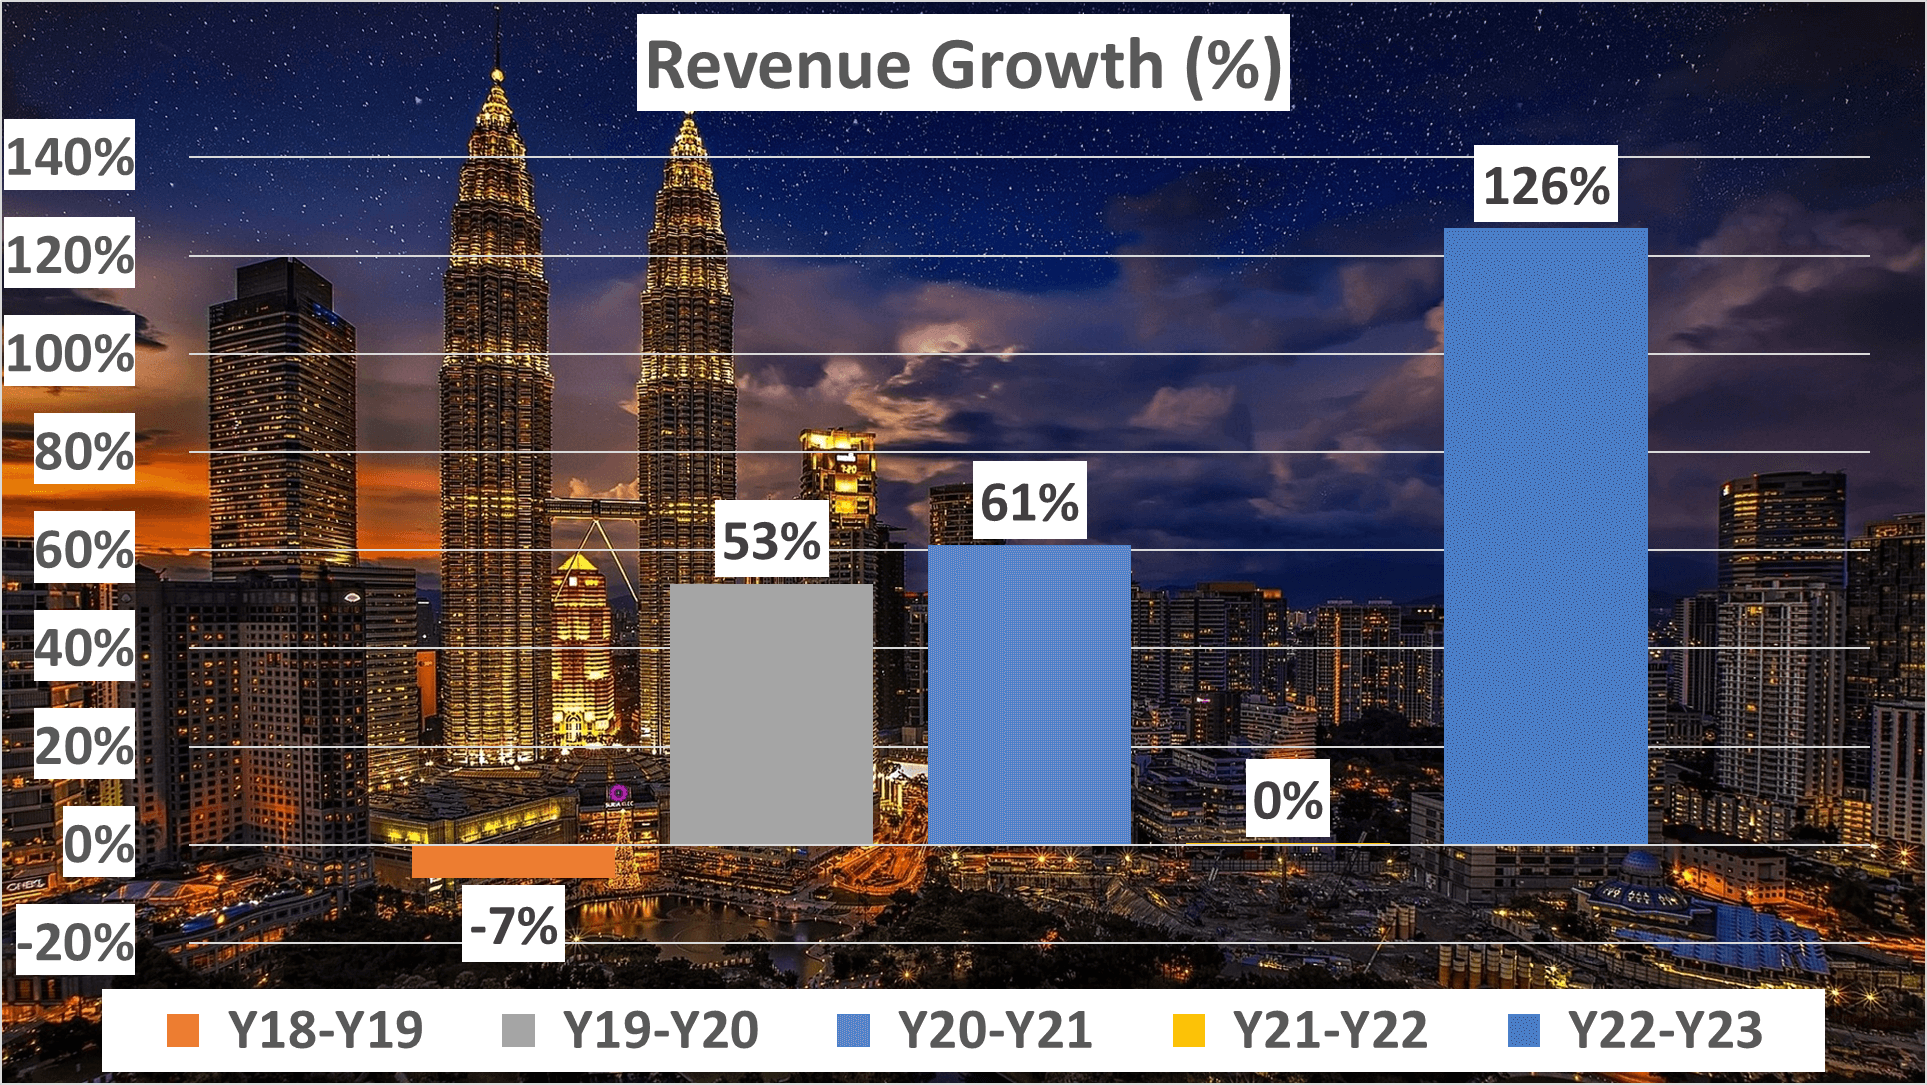
- From twenty eighteen to twenty nineteen, there was a slight downturn of -7%.
- However, NVIDIA swiftly rebounded, witnessing a robust 53% growth from twenty nineteen to twenty twenty, followed by an even more substantial 61% increase from twenty twenty to twenty twenty-one.
- After a stable performance in twenty twenty-two, the company surged ahead with an outstanding 126% growth in twenty twenty-three.
Key to Success: Consistent Revenue Growth
This consistent upward trend in revenue stands as a cornerstone of NVIDIA’s success story, underlining its resilience and strategic acumen in navigating market dynamics.
NVIDIA Stock Analysis: Delving into Profitability Metrics
NVIDIA’s profitability metrics have shown remarkable growth over time. Let’s delve into the specifics.
Gross Profit Margin
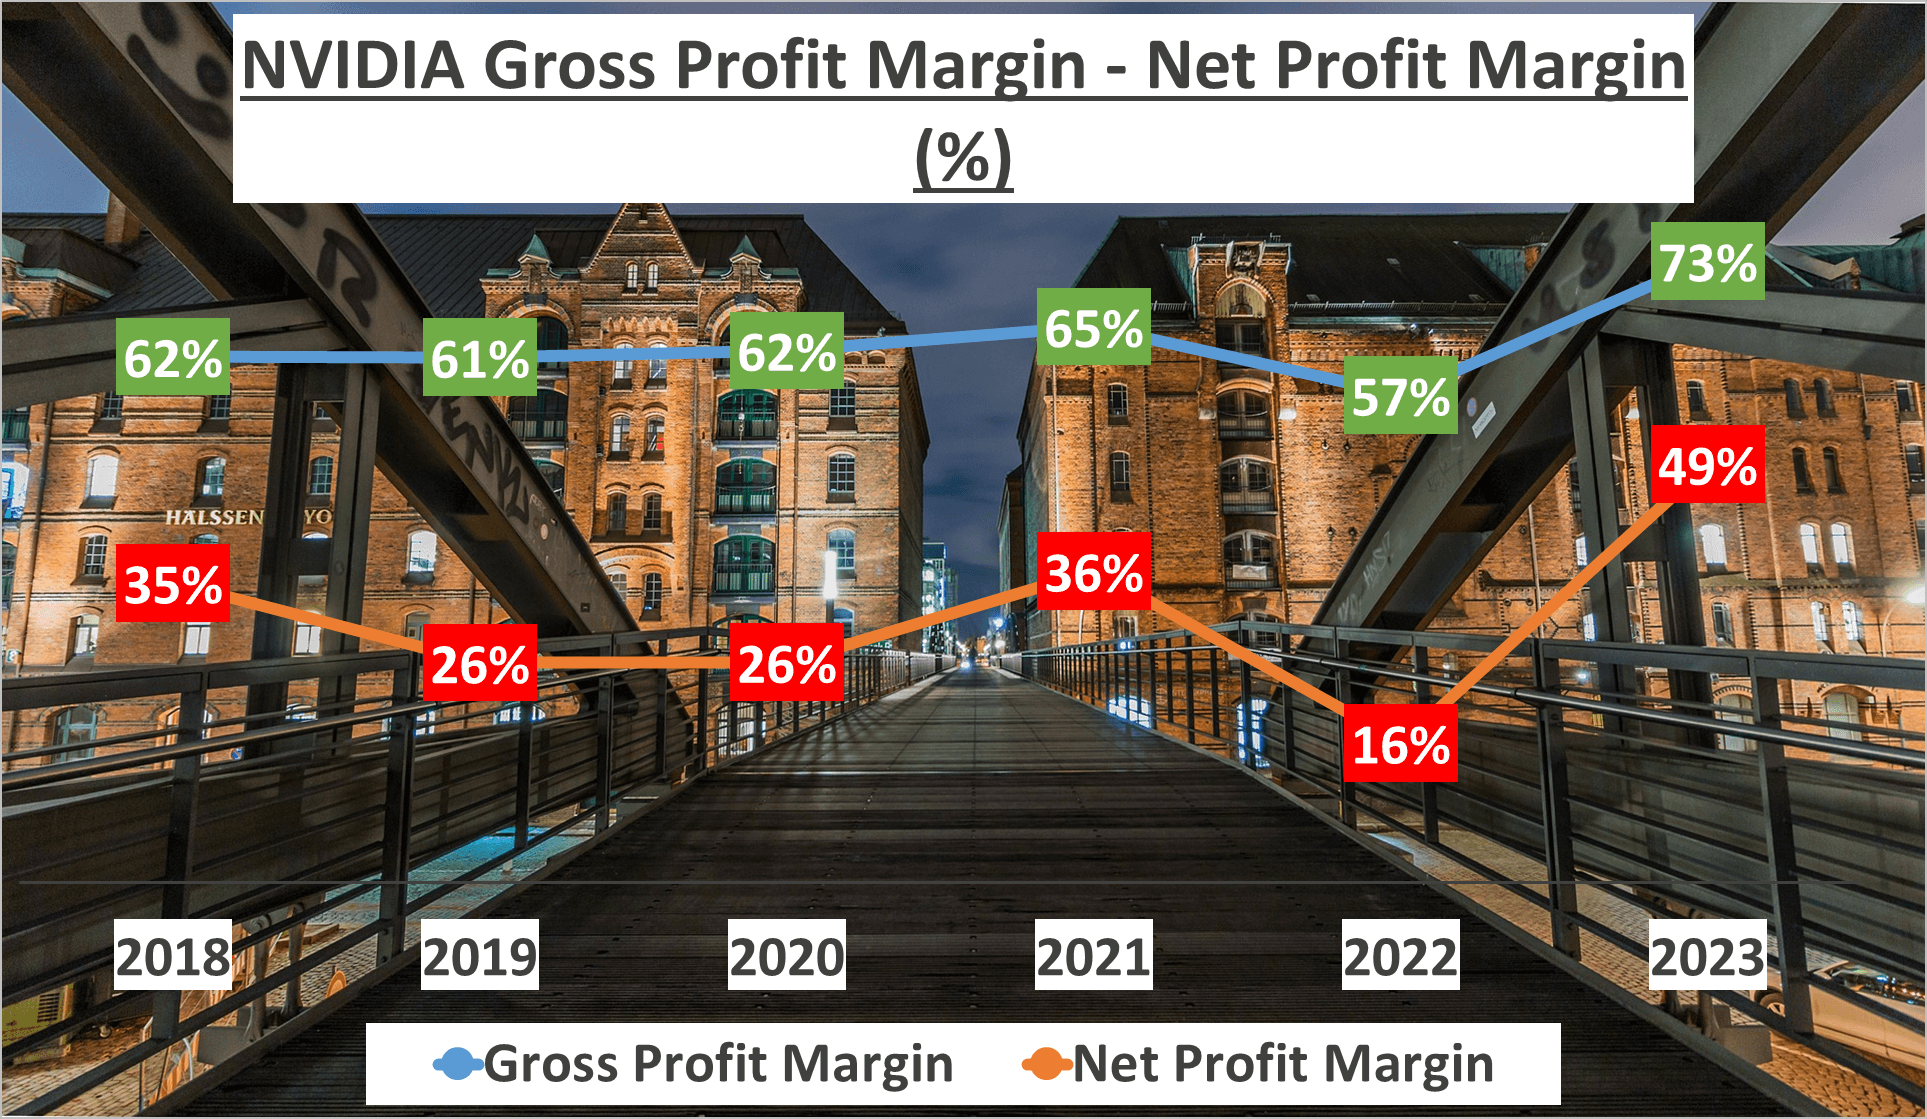
Beginning with the gross profit margin, in twenty twenty-three, NVIDIA’s gross profit margin surged to an impressive 73%. This marks a substantial increase from the five-year average of 63%, demonstrating a ten percent rise attributed to NVIDIA’s adept cost management and pricing strategies.
Net Profit Margin
Moving on to the net profit margin, a pivotal profitability metric, NVIDIA’s net profit margin stood at 49% in twenty twenty-three. This signifies a significant surge from the five-year average of 31%, indicating an eighteen percent increase. This uptick showcases NVIDIA’s enhanced ability to convert revenue into tangible profit, a favorable indicator for investors.
Overall Net Profit
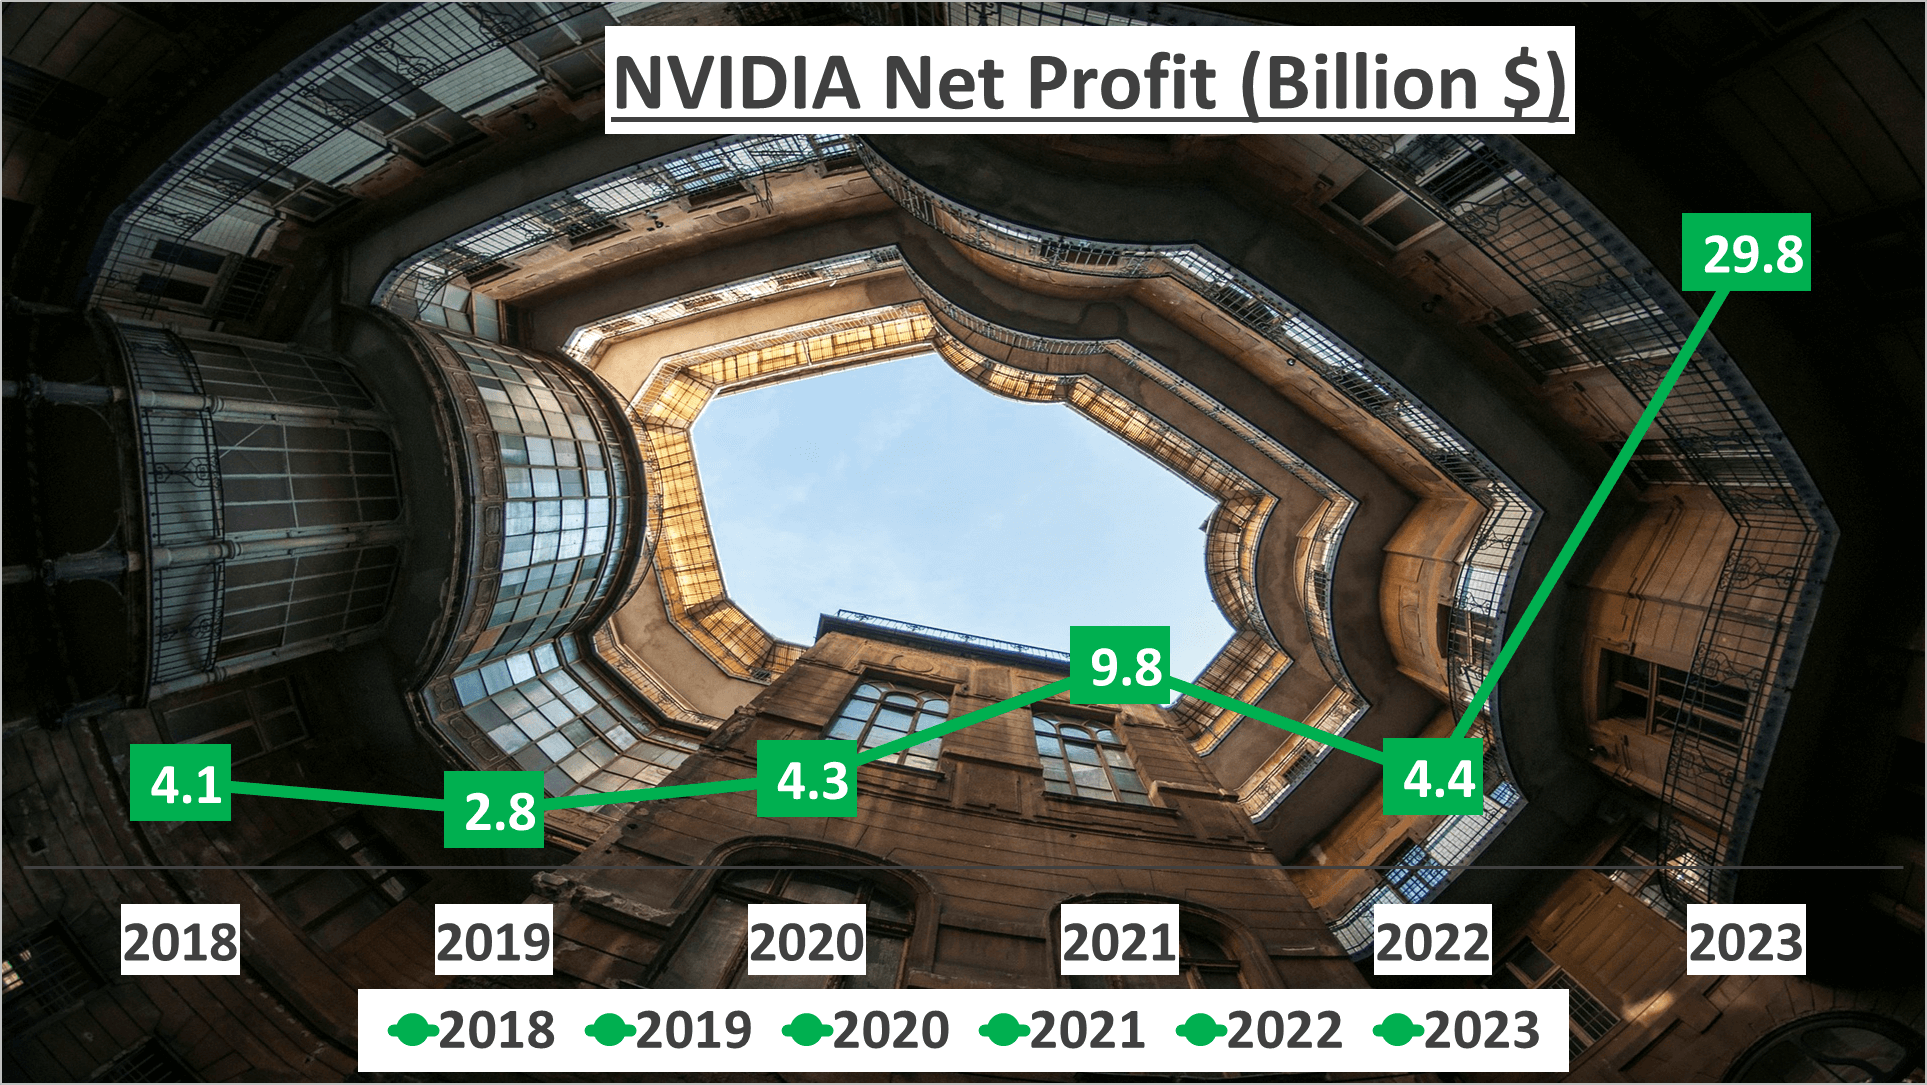
Beyond margins, NVIDIA’s overall net profit in twenty twenty-three amounted to a staggering $29.8B. This achievement is noteworthy, particularly amidst the challenging market conditions posed by the global pandemic. It underscores NVIDIA’s resilience and financial strength, even in adverse circumstances.
Conclusion: Driving Stock Value through Profitability
NVIDIA’s ascending profit margins, coupled with a substantial increase in net profit, highlight the company’s robust financial management and strategic prowess. These factors have significantly contributed to NVIDIA’s strong financial performance, consequently elevating the value of its stock.
NVIDIA Stock Analysis: Evaluating Financial Strength
NVIDIA’s financial position remains robust and continues to improve. In twenty twenty-three, the company’s total assets surged to $66B, a significant leap from the $41B recorded in twenty twenty-two. This substantial increase underscores NVIDIA’s successful operations and strategic investments.
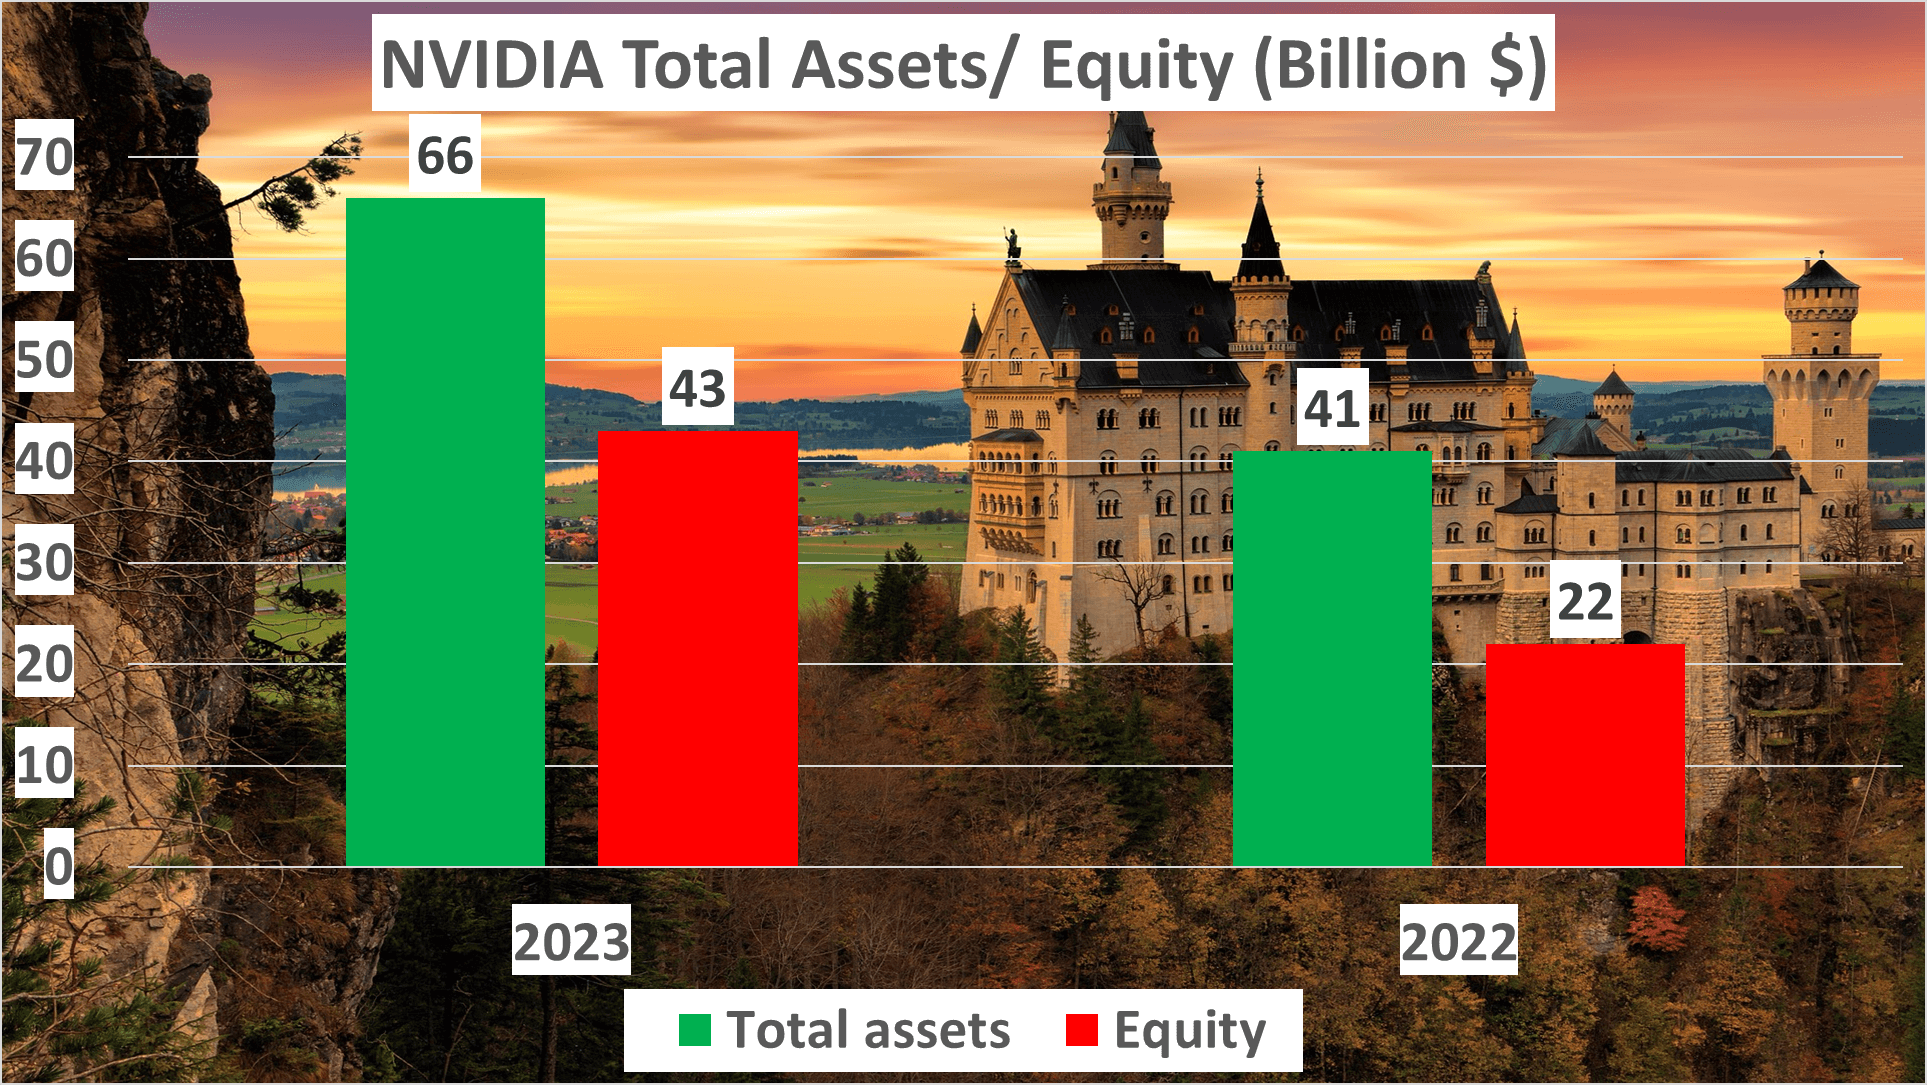
Similarly, the net assets for twenty twenty-three reached $43B, nearly doubling from the previous year’s $22B. This surge indicates the company’s profitability and financial stability.
Moreover, the equity to total assets ratio in twenty twenty-three stood at 65%, compared to 54% in twenty twenty-two. This improvement signifies NVIDIA’s ability to finance its assets with equity rather than debt, a positive indicator for investors.
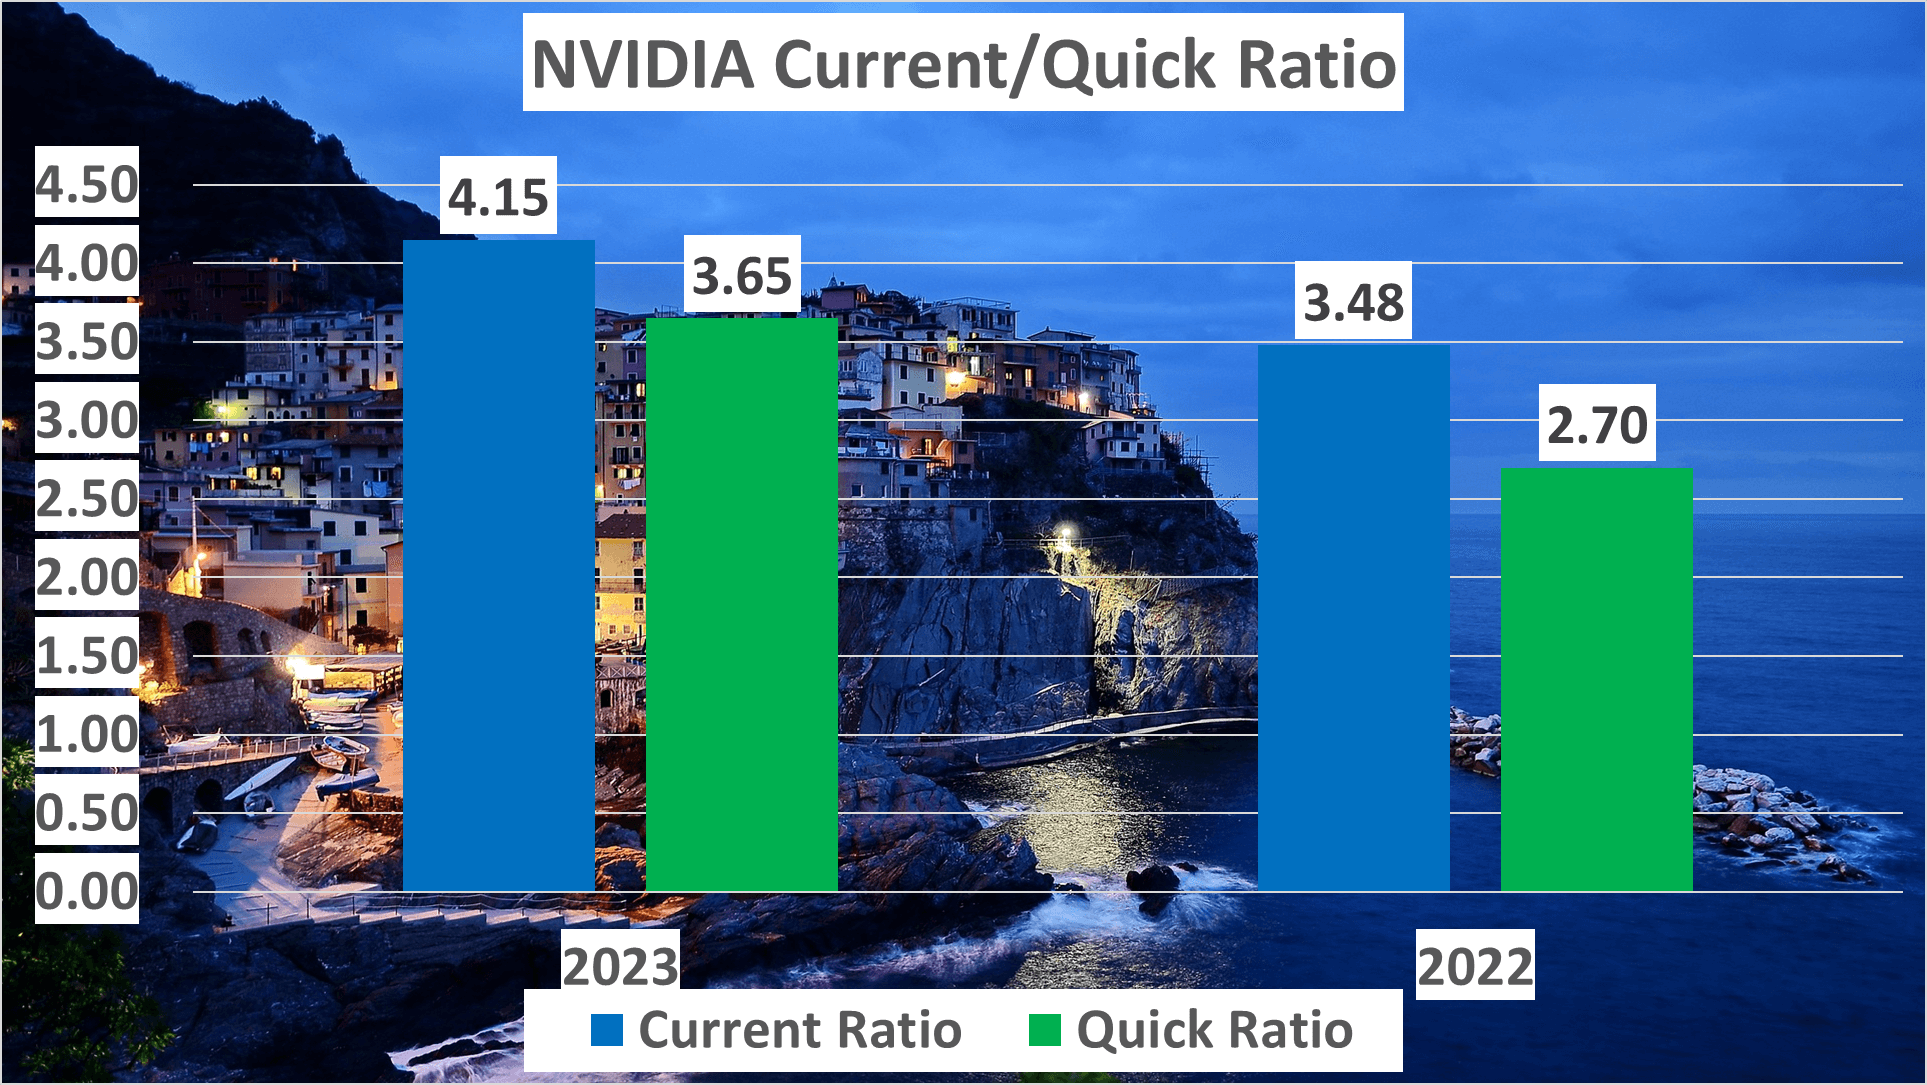
In terms of liquidity, the current ratio for twenty twenty-three was 4.15, up from 3.48 in twenty twenty-two. Likewise, the quick ratio increased to 3.65 in twenty twenty-three from 2.7 in twenty twenty-two. These ratios demonstrate NVIDIA’s strengthened liquidity position, ensuring prompt payment of liabilities.
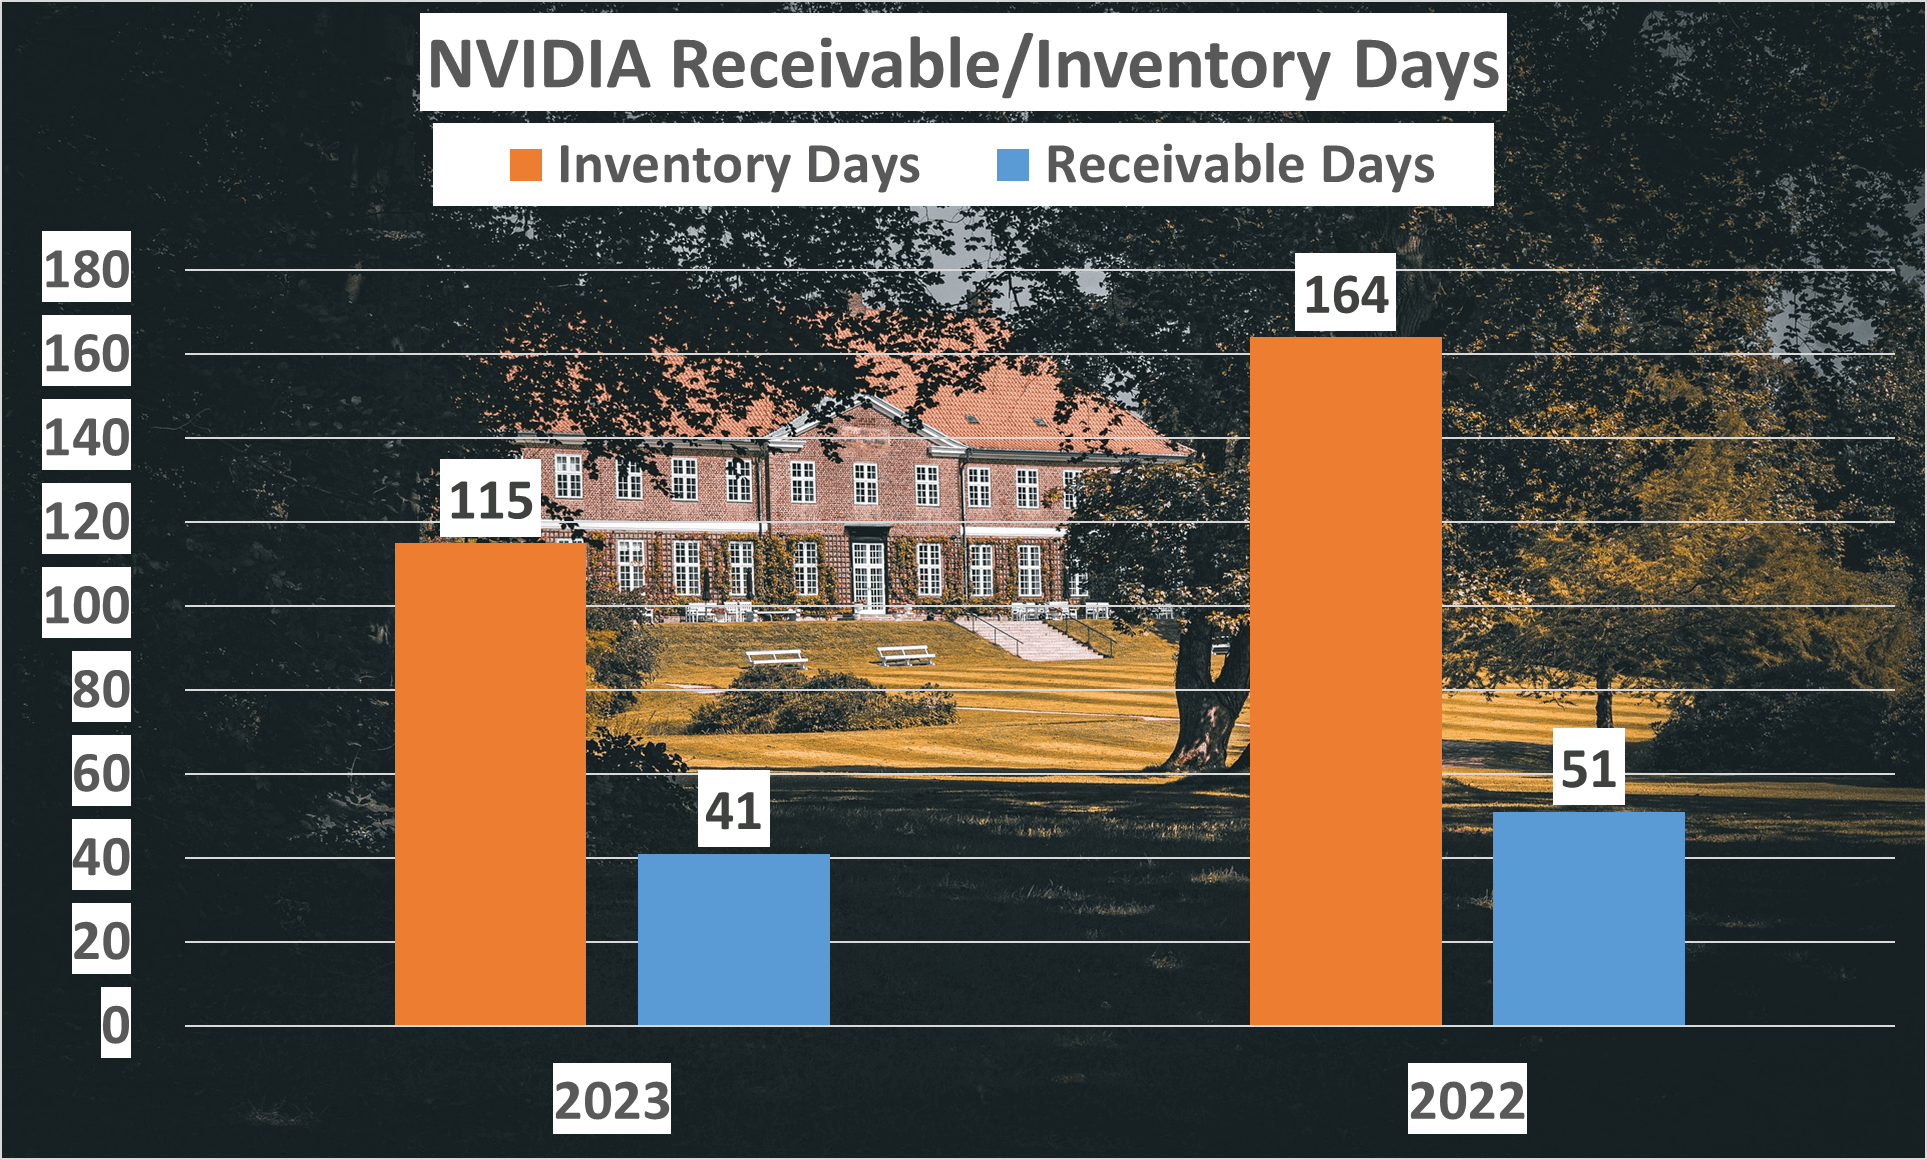
Examining inventory days, NVIDIA reduced its inventory days to 115 in twenty twenty-three, down from 164 in twenty twenty-two. Although this marks a decrease, there is still room for improvement. A lower number of days signifies faster inventory turnover, potentially leading to increased efficiency and profitability.
In conclusion, NVIDIA’s robust financial health serves as a solid foundation for its continued growth. The company’s ability to augment its assets, enhance its equity to total assets ratio, fortify its liquidity position, and reduce inventory days bode well for investors seeking financially sound opportunities.
NVIDIA Stock Analysis: Examining Cash Flow and Dupont Insights
NVIDIA’s cash flow has witnessed a notable surge, and Dupont analysis unveils deeper insights. Let’s delve into the details.
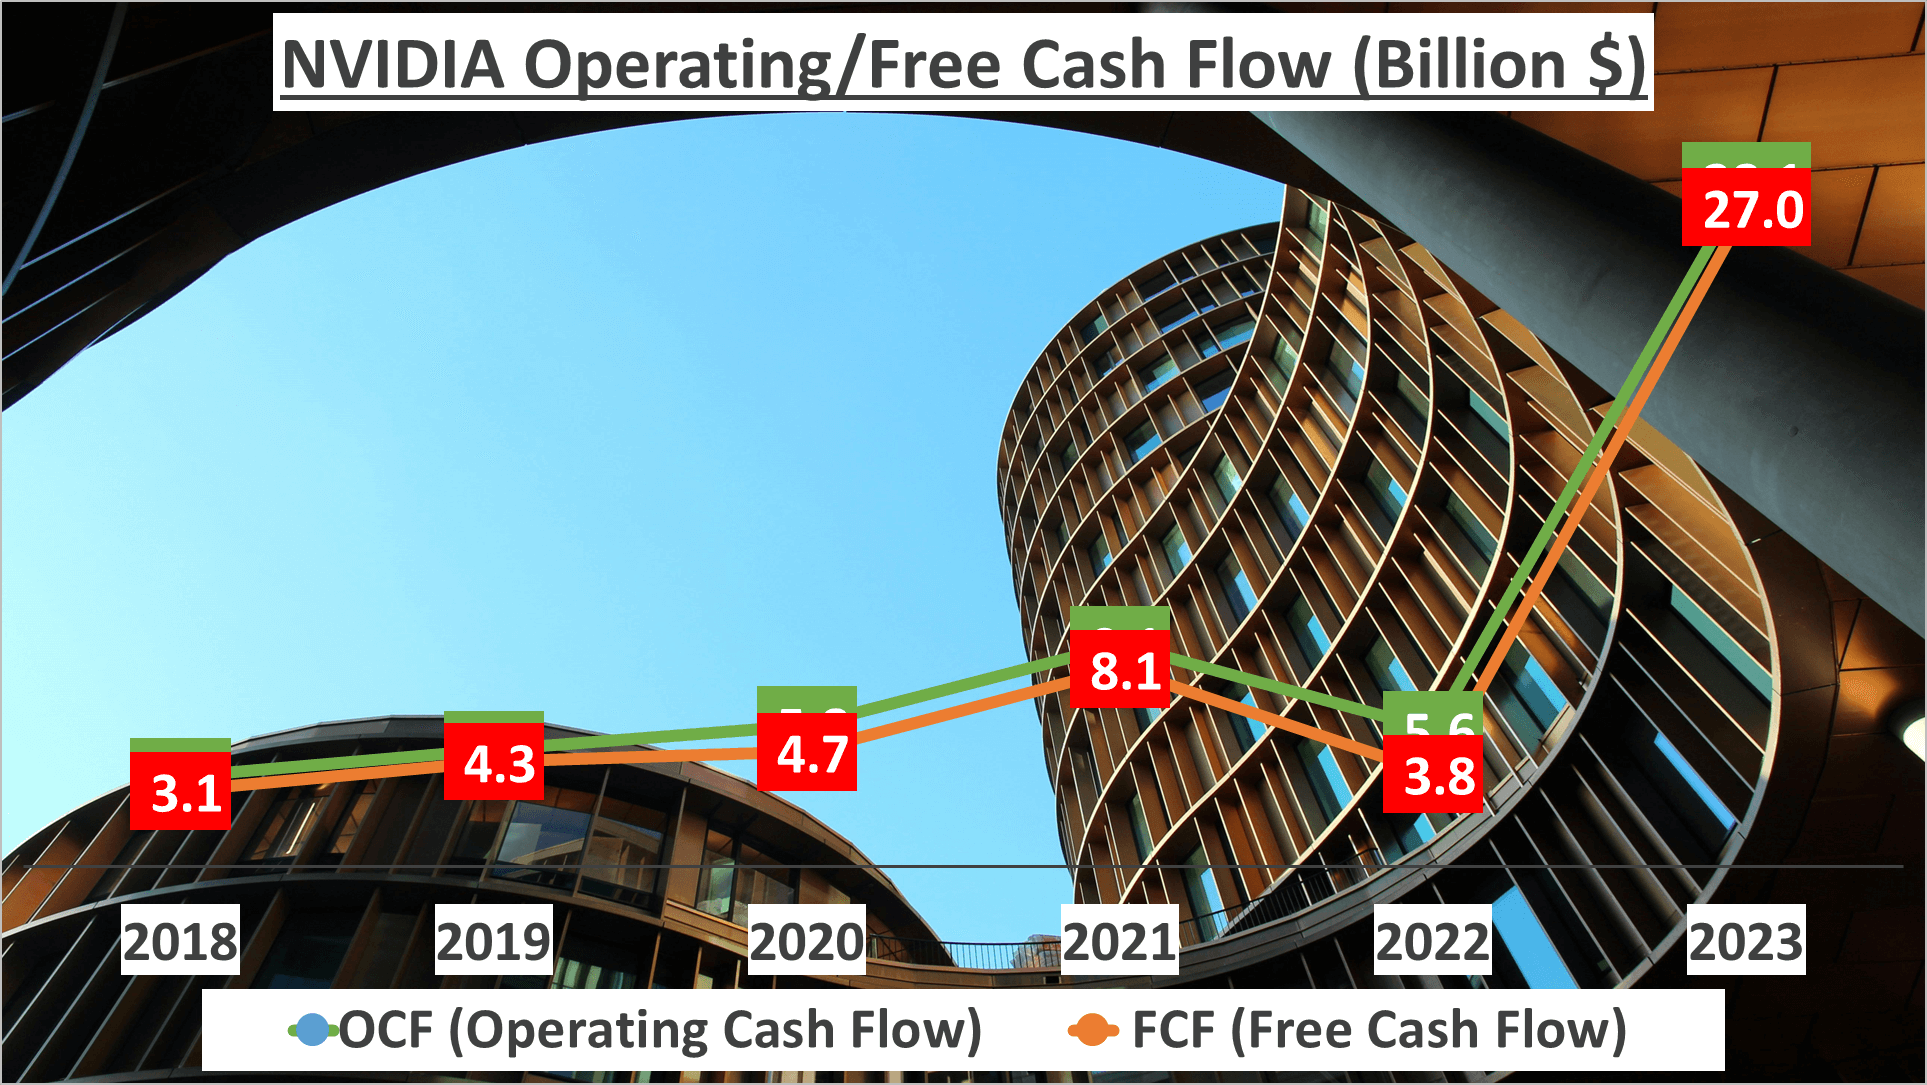
In twenty twenty-three, the operating cash flow surged to a substantial $28.1B, closely followed by a free cash flow of $27B. This robust cash flow growth signifies NVIDIA’s formidable financial health and its prowess in generating significant cash from operations.
Now, let’s shift focus to the Dupont analysis, a method dissecting Return on Equity (ROE) into three components: net profit margin, asset turnover, and equity to assets ratio. This analysis aids in comprehending the drivers behind a company’s ROE.
In twenty twenty-three, NVIDIA’s ROE soared to an impressive 69%. The net profit margin stood at 49%, with an asset turnover of 1.14 and an equity to assets ratio of 1.53.
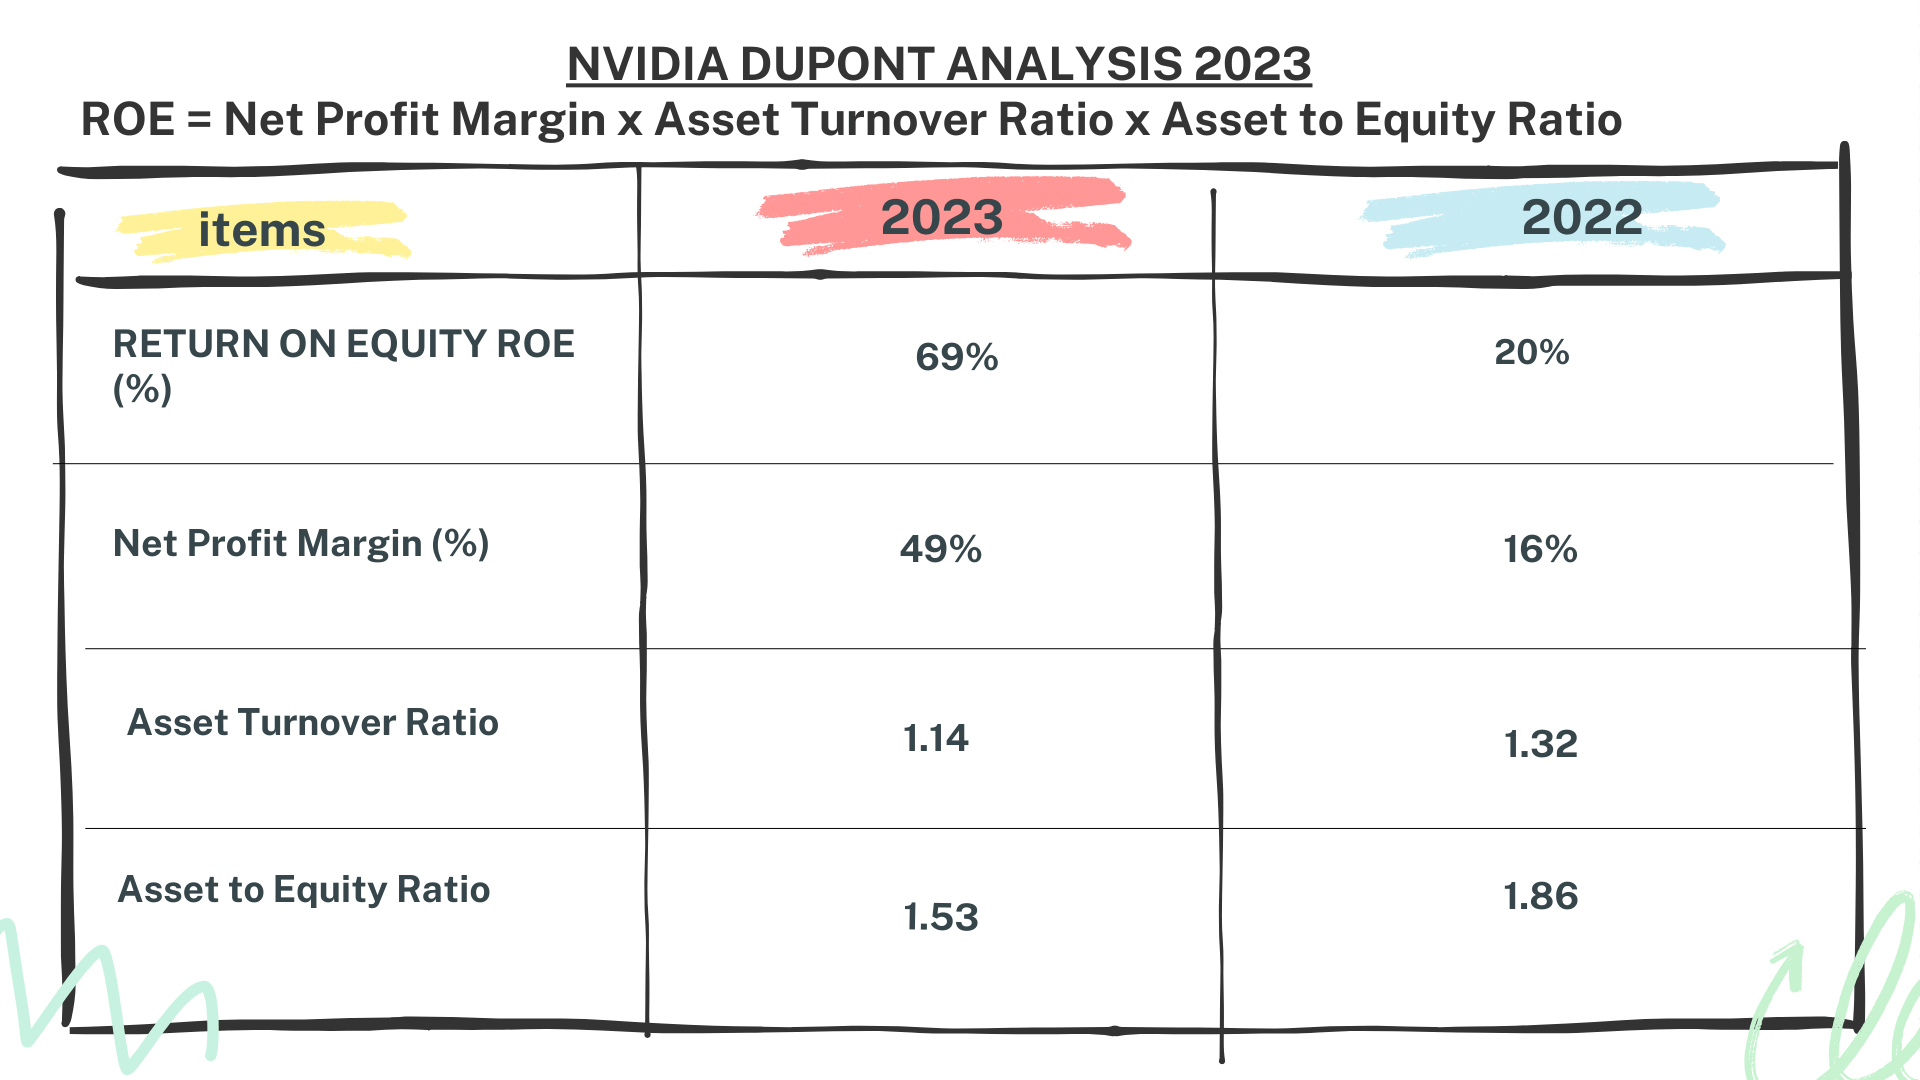
Comparatively, in twenty twenty-two, the ROE was 20%, with a net profit margin of 16%, an asset turnover of 1.32, and an equity to assets ratio of 1.86.
So, what does this reveal? The substantial leap in ROE from 20% to 69% within a year is predominantly propelled by the soaring net profit margin. This indicates NVIDIA’s enhanced profitability and efficiency in utilizing assets to generate earnings.
In conclusion, the robust cash flow and impressive Dupont analysis underscore NVIDIA’s formidable financial health and promising growth potential, rendering it an appealing prospect for investors.
Stay tuned for our final segment where we conclude our assessment of NVIDIA’s financial performance. Remember, grasping a company’s financials is pivotal for making informed investment decisions, and NVIDIA’s strong cash flow and Dupont analysis further affirm its financial prowess and growth trajectory.
Author: investforcus.com
Follow us on Youtube: The Investors Community

