NVIDIA vs AMD Stock Analysis – Are you seeking insights as an investor into which holds more promise: NVIDIA or AMD?
In the realm of tech investment, these two giants stand tall.
On one front, NVIDIA commands the domain of graphics processing units and AI technologies with authority.
On the opposing end, AMD asserts its dominance in microprocessors, motherboards, and graphic processors.
Today, our focus is on comparing these formidable contenders, dissecting their financial prowess to enlighten potential investors.
Let’s delve into the financial performance of these tech titans.
Revenue Comparison – NVIDIA vs AMD Stock Analysis
Let’s kick things off by examining revenues.
In the last three quarters of 2023, NVIDIA reported total revenues of $39B, whereas AMD garnered $17B.
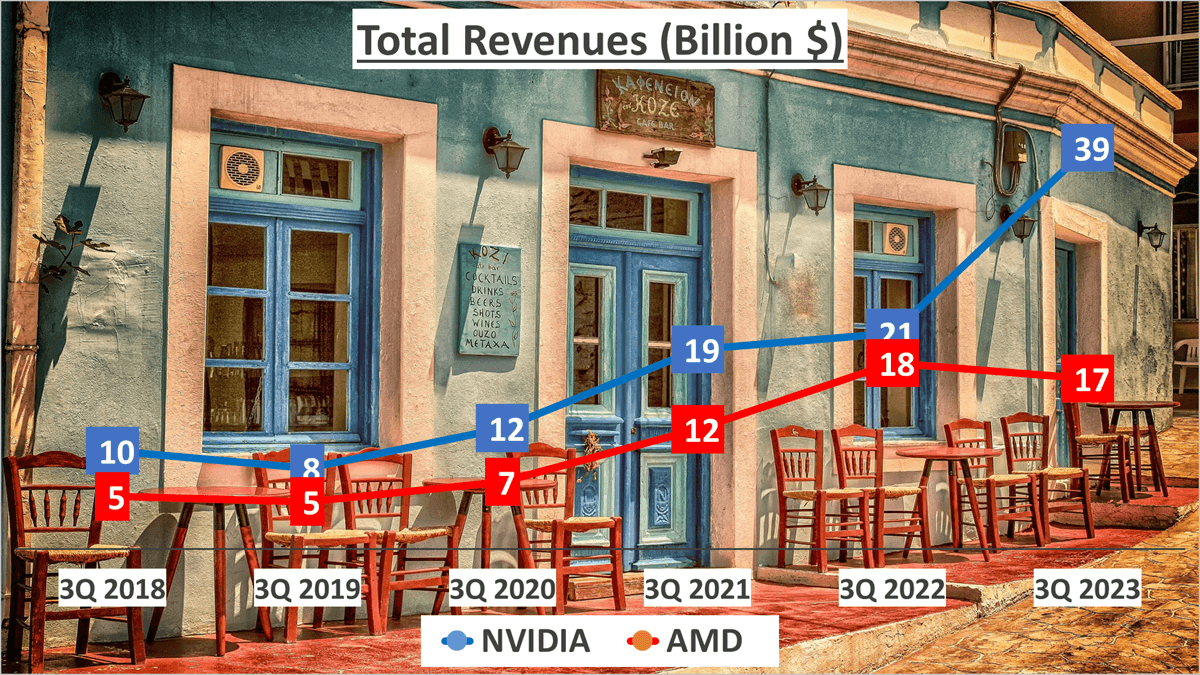
These figures are undeniably impressive, but what’s truly intriguing is their evolution over time. Over the past five years, NVIDIA has demonstrated a Compound Annual Growth Rate (CAGR) of 33% in revenues, while AMD has achieved a growth rate of 26%.
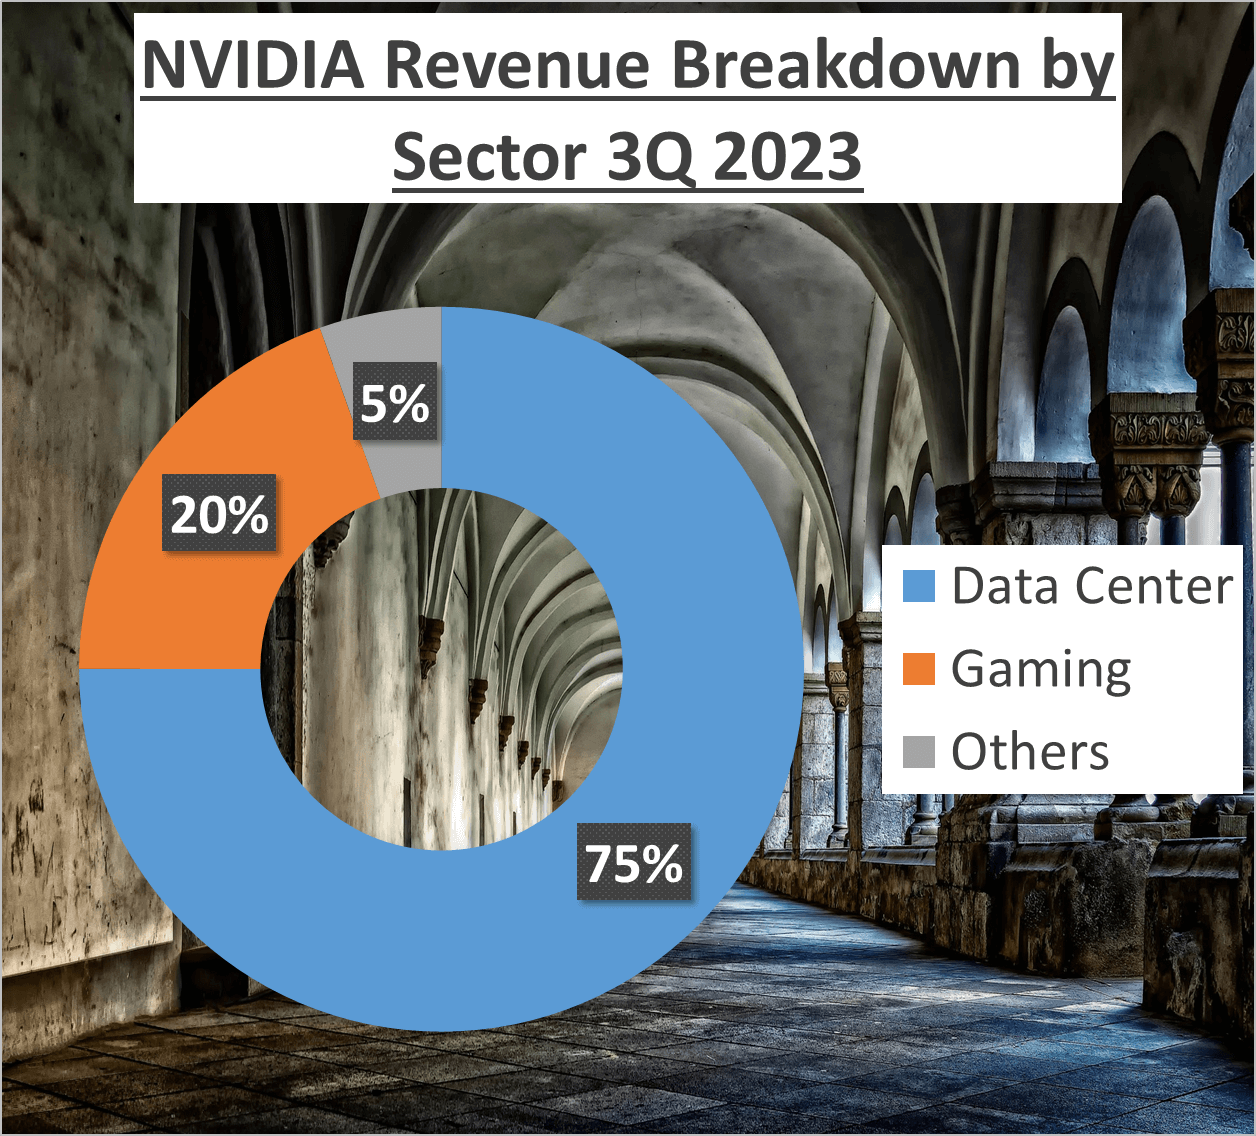
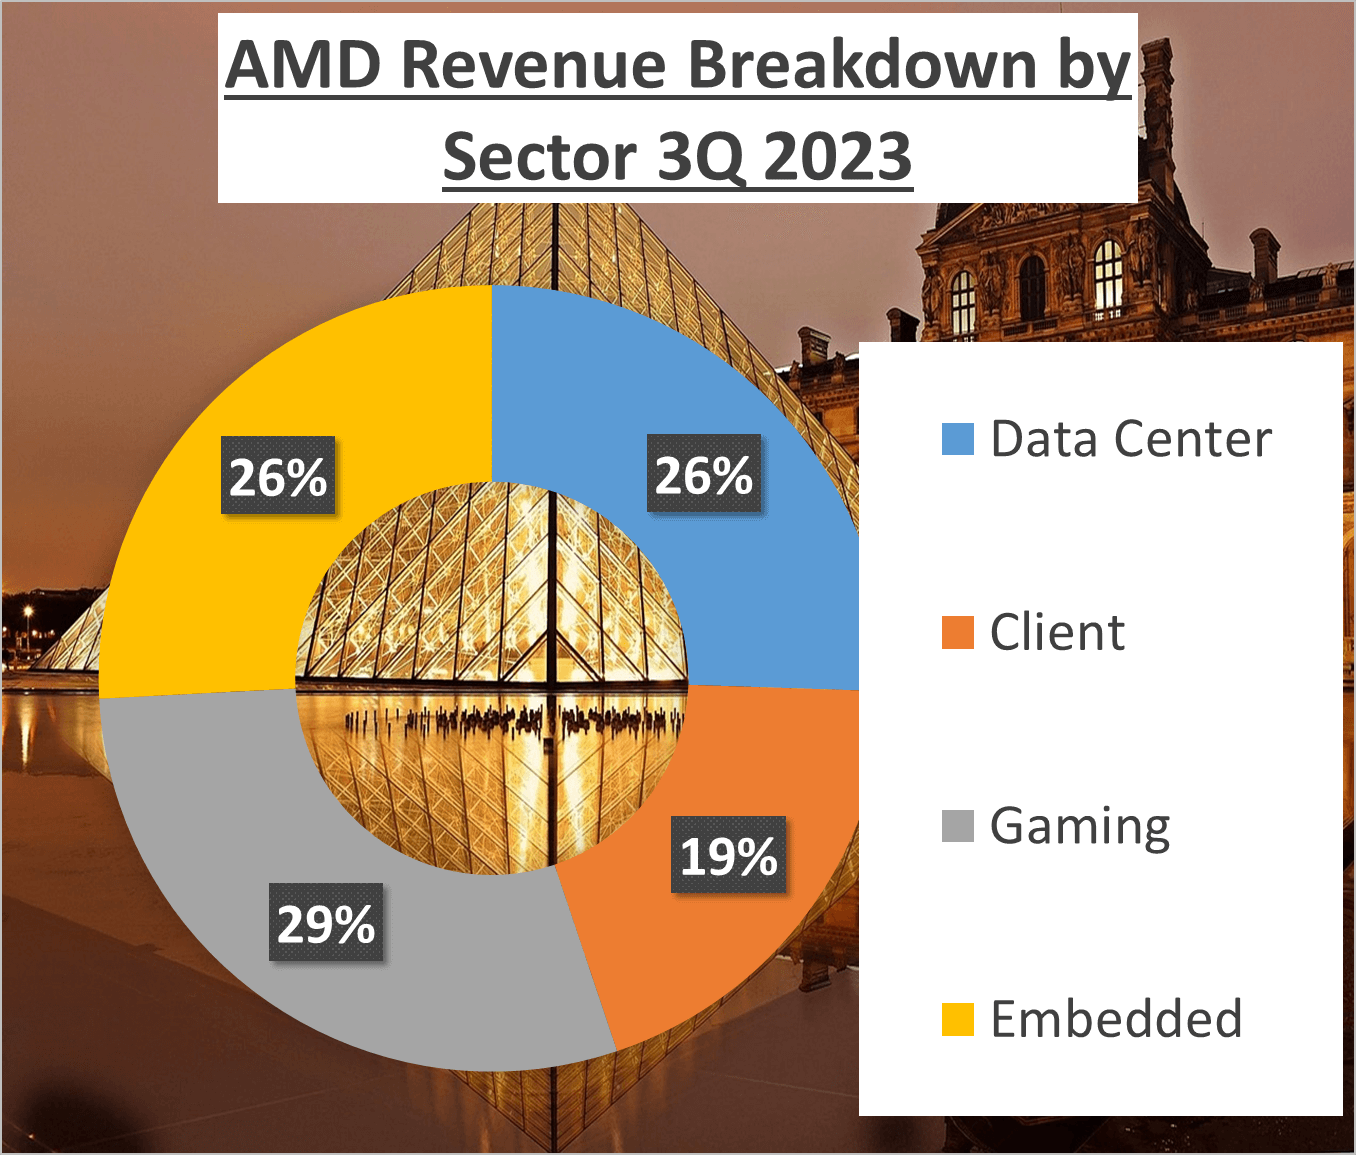
However, revenue analysis isn’t just about the bottom line; it’s also about understanding its sources. NVIDIA’s revenue breakdown reveals that 75% of its income is derived from the Data Center sector, 20% from Gaming, and the remaining 5% from other avenues. In contrast, AMD’s revenue is more evenly spread, with 26% each coming from Data Center and Embedded sectors, 29% from Gaming, and the remaining 19% from Client services.
Furthermore, considering the geographical distribution of revenue provides additional insights. For NVIDIA, 38% of its revenue originates from the United States, 23% from Taiwan, 22% from China, 12% from Singapore, and the remaining 6% from other regions. On the flip side, AMD derives 33% of its revenue from the United States, 22% from China, 18% from Japan, 10% from Taiwan, and the remaining 17% from other areas.
Both companies exhibit notable strengths in revenue generation. NVIDIA capitalizes on the burgeoning Data Center sector, whereas AMD boasts a more diversified revenue structure. Moreover, while NVIDIA boasts a broader global presence, AMD holds a significant stronghold in Japan, a market yet to be extensively tapped by NVIDIA. These dynamics will undoubtedly continue to influence the future performance of these tech giants.
Profit Analysis – NVIDIA vs AMD Stock Analysis
Let’s now turn our attention to profitability.
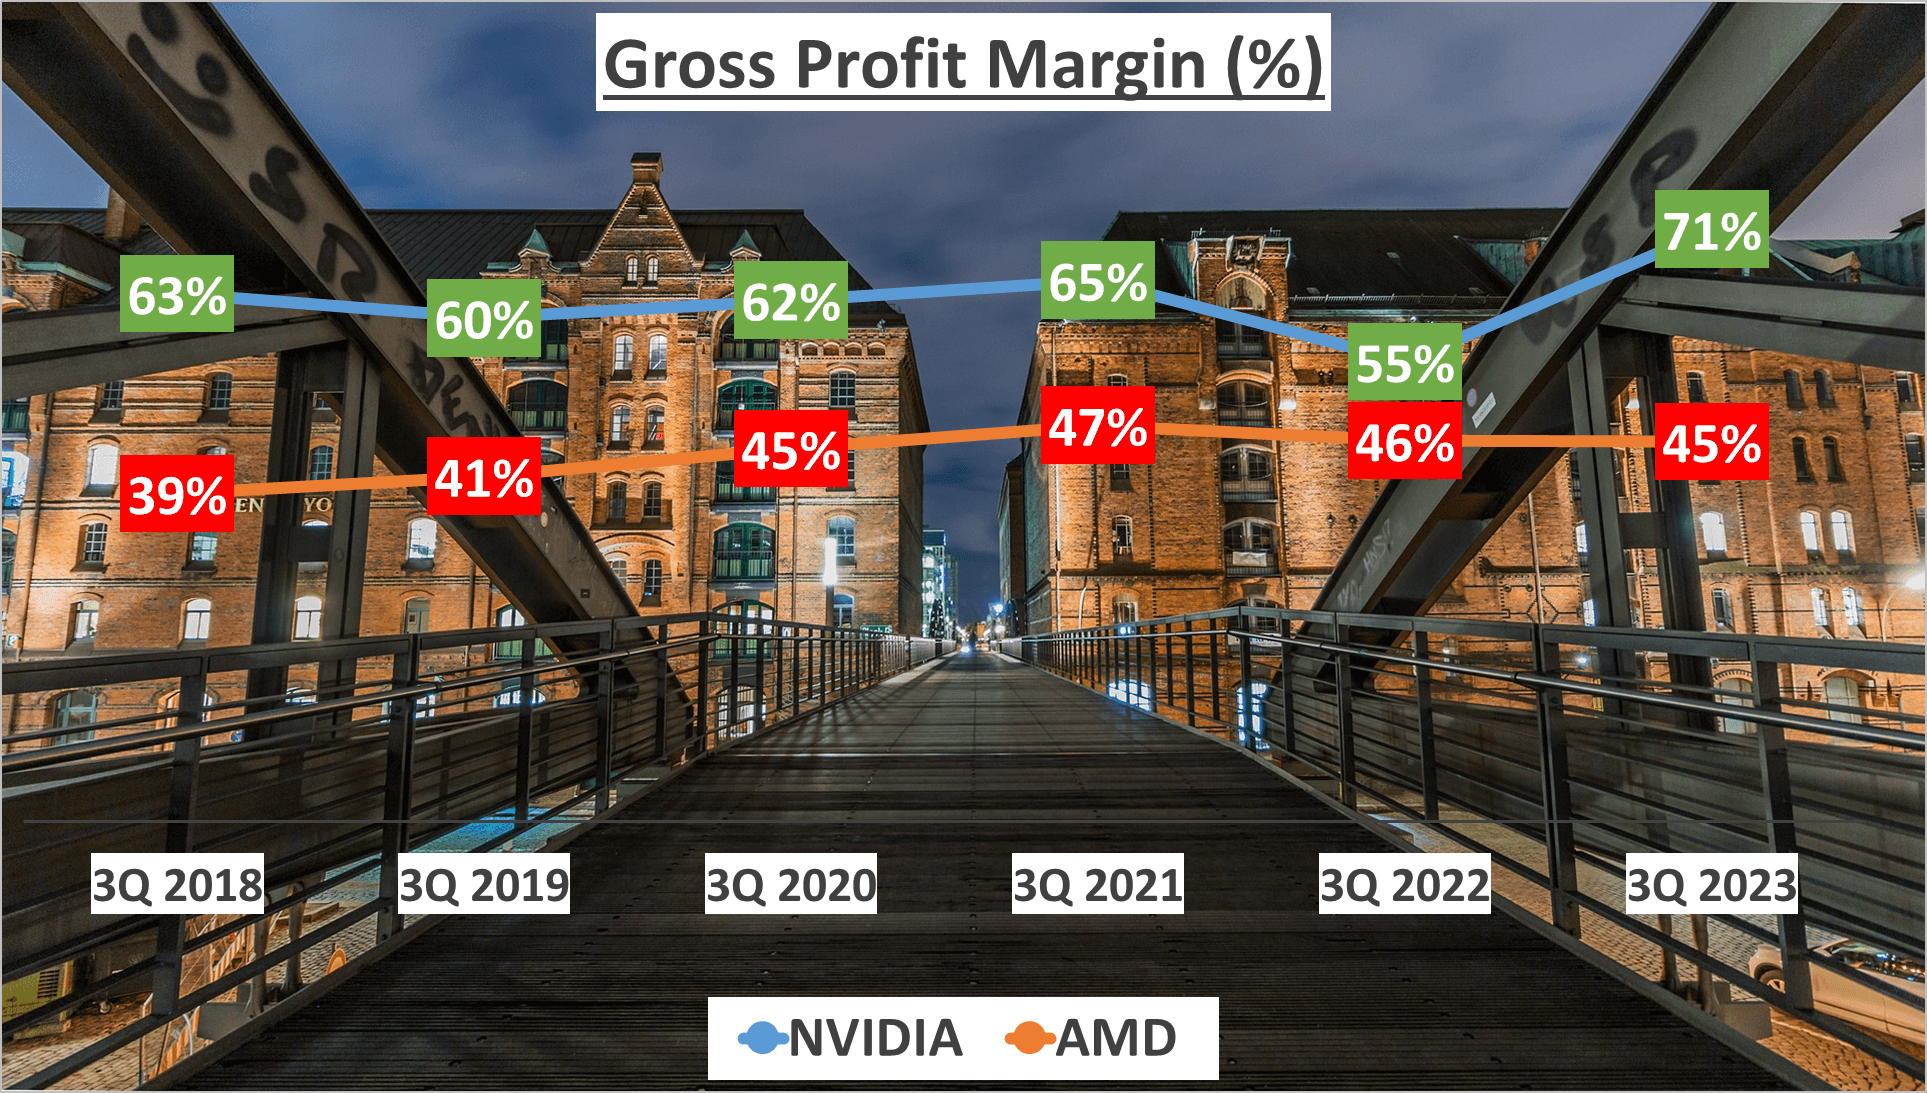
In the past three quarters of 2023, NVIDIA has demonstrated a gross profit margin of 71%, marking a significant increase from their five-year average of 63%. On the contrary, AMD has maintained a steady gross profit margin of 45%, slightly above their five-year average of 44%.
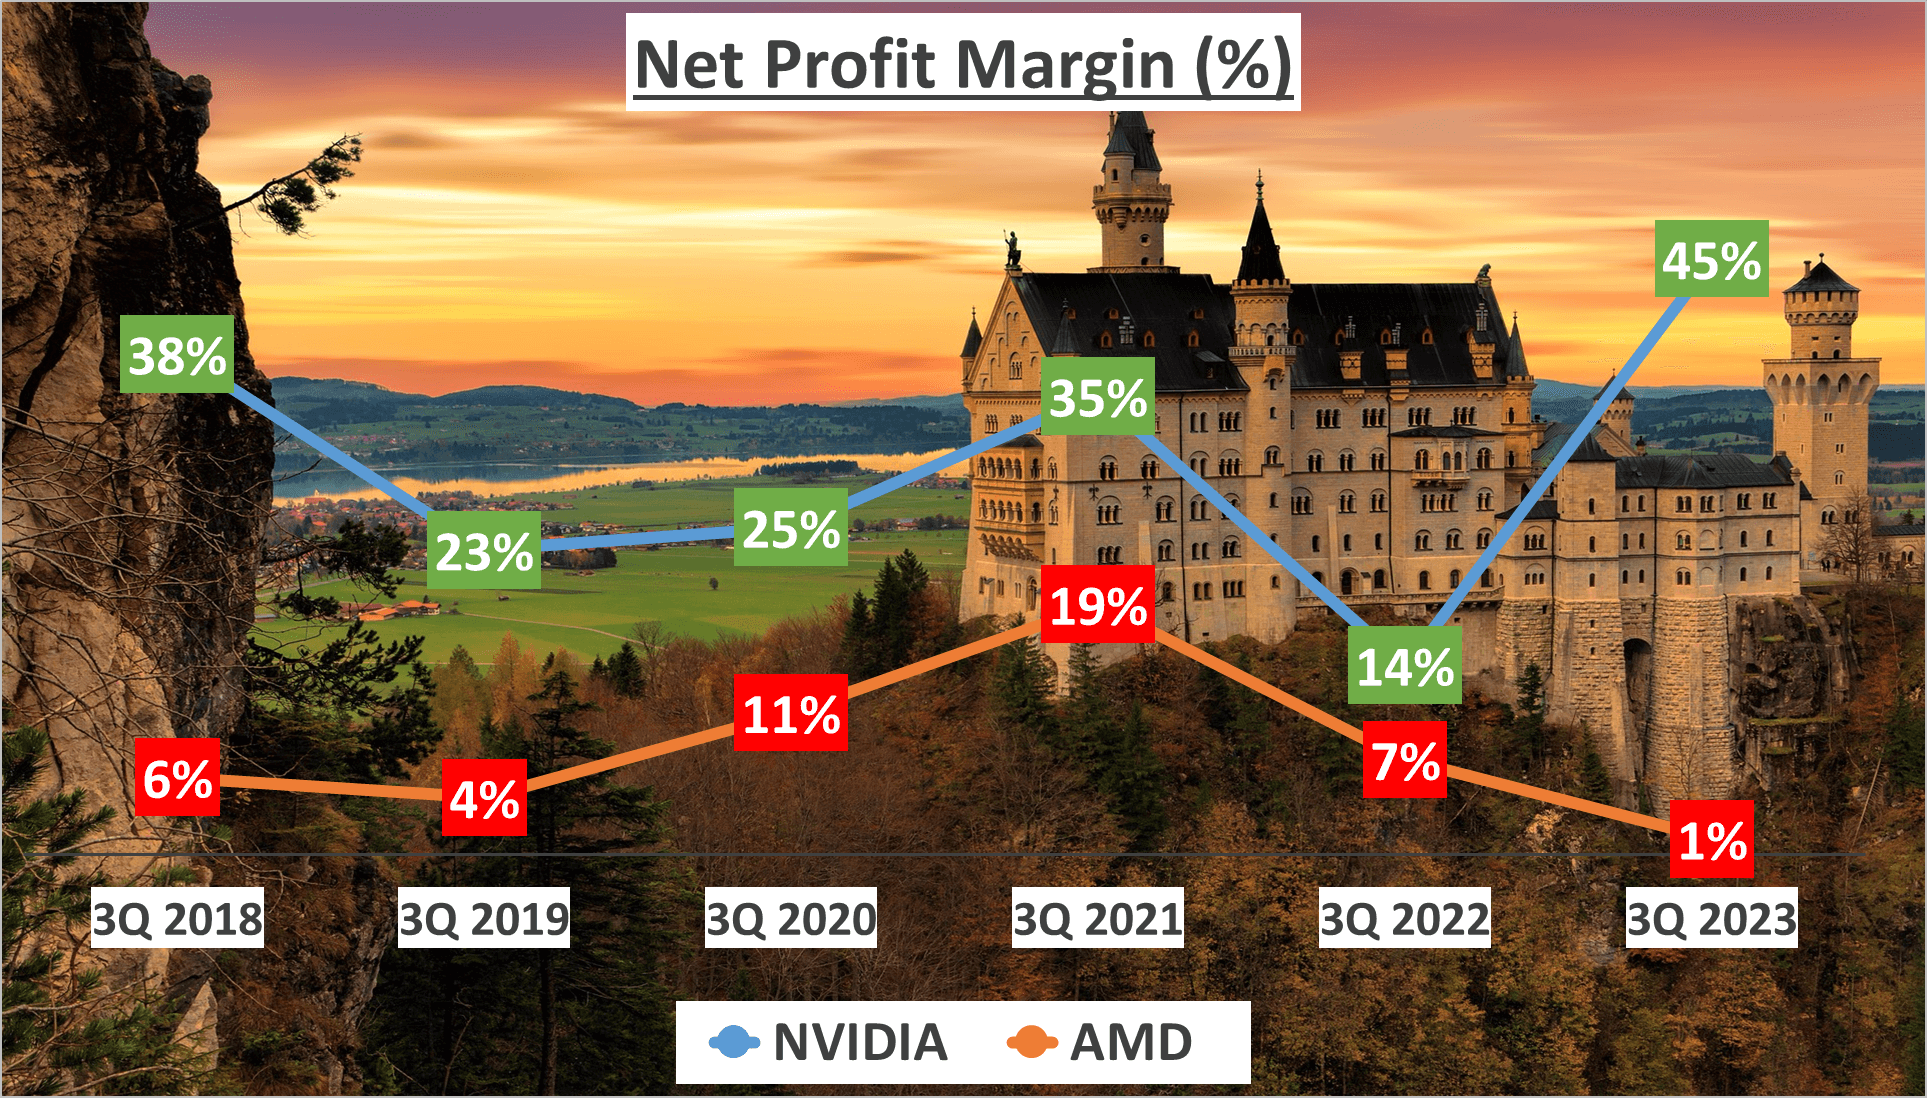
However, the real narrative unfolds when we scrutinize the net profit margins. NVIDIA boasts an impressive net profit margin of 45%, a notable surge from their five-year average of 30%.
This surge is largely attributed to the global AI technology boom, which has greatly benefited NVIDIA in 2023. Conversely, AMD’s net profit margin stands at a modest 1%, a decline from their five-year average of 8%.
The net profits for the past three quarters of 2023 paint an even starker contrast. NVIDIA reported a net profit of $17.5B, while AMD managed only $187M. This reflects a Compound Annual Growth Rate (CAGR) of 37% for NVIDIA over the past five years. In contrast, AMD has experienced a negative CAGR of -8% during the same period.
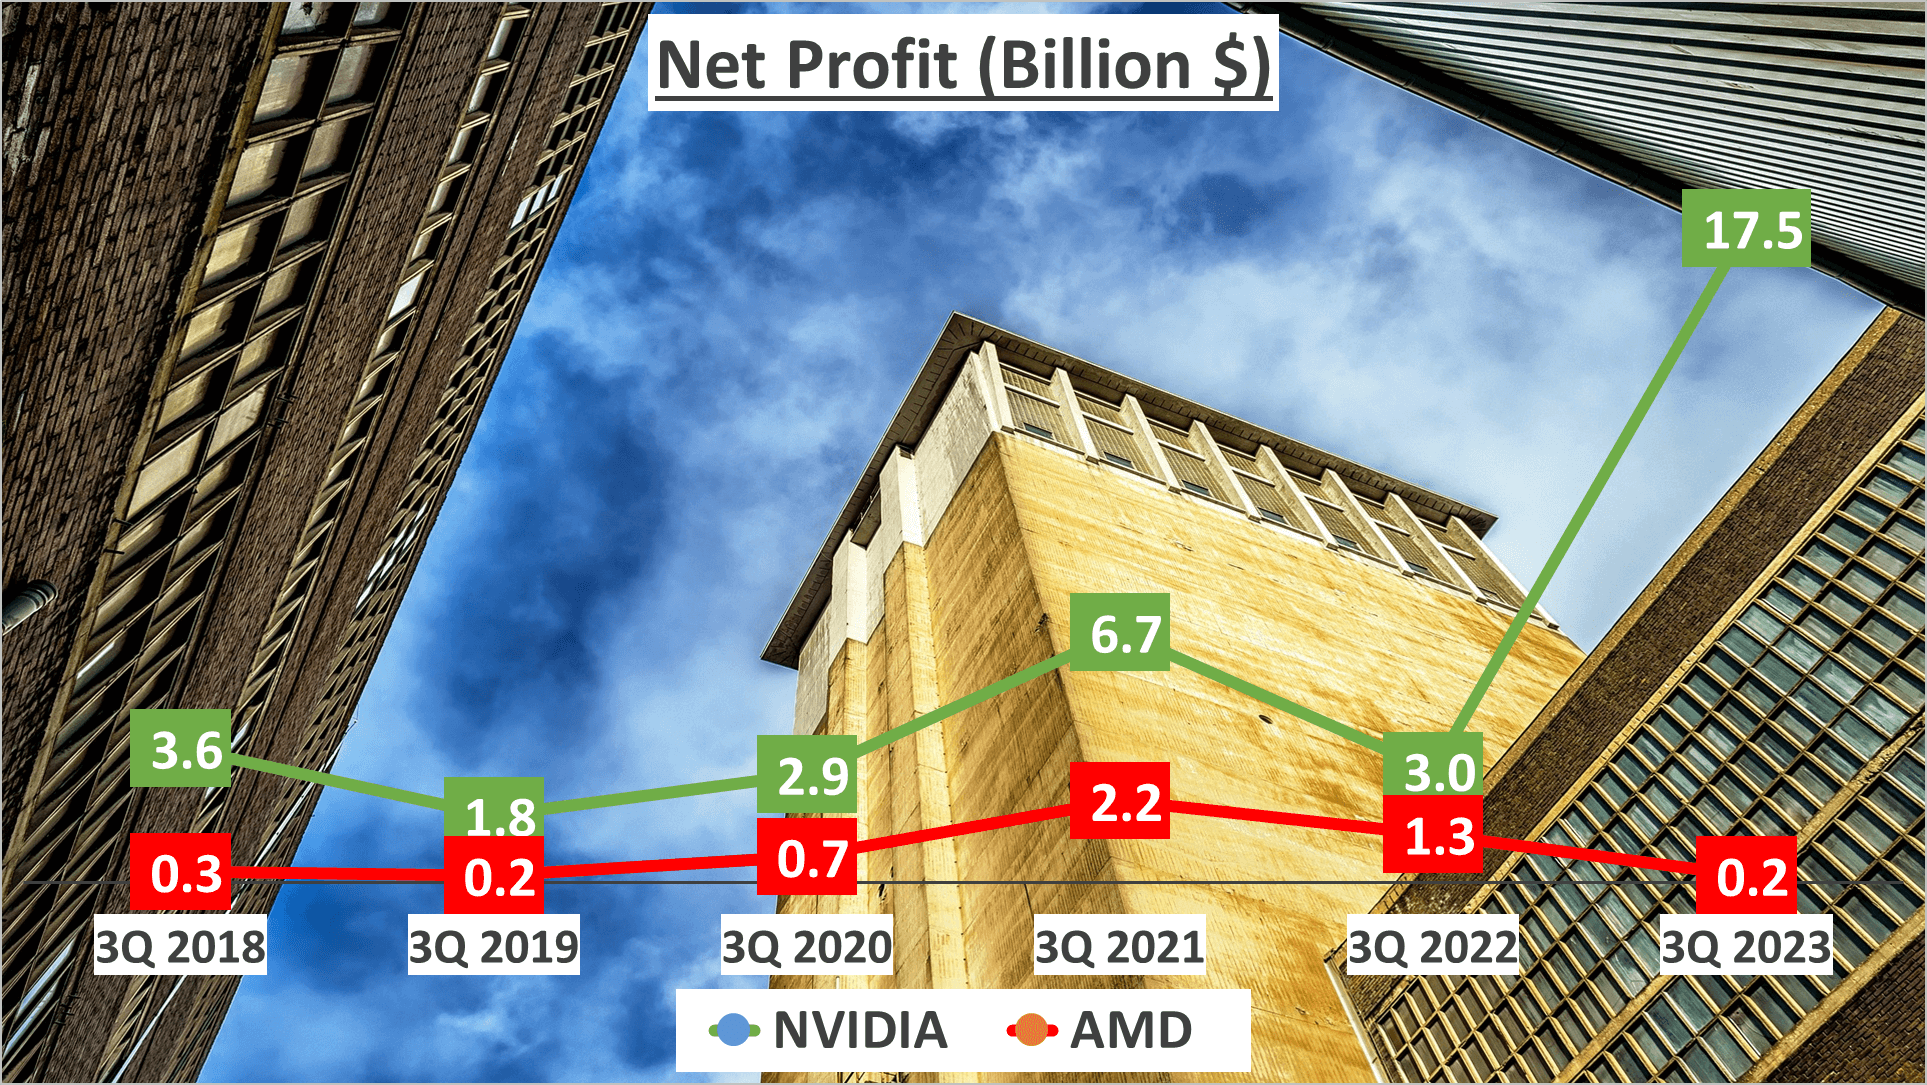
In the 2023 race, NVIDIA has clearly taken the lead, while AMD has struggled with a significant decline in net profit. NVIDIA’s superior performance underscores their efficient utilization of assets to generate substantial profits. Despite having a total asset base smaller than that of AMD, NVIDIA has managed to yield larger profits, indicating efficient asset utilization.
In terms of liquidity, both companies have exhibited commendable performance. NVIDIA boasts a current ratio of 3.59 and a quick ratio of 3.06. AMD trails slightly with a current ratio of 2.19 and a quick ratio of 1.61. Despite the lead, both companies demonstrate robust liquidity, with NVIDIA showcasing a stronger position.
Evidently, NVIDIA maintains an edge when it comes to profitability.
Asset Management – NVIDIA vs AMD Stock Analysis
Let’s delve into how these companies manage their assets.
Examining the financial records of NVIDIA and AMD for the third quarter of 2023, we notice a distinct contrast in their total assets. NVIDIA boasts $54B in assets, while AMD surpasses that with $68B.
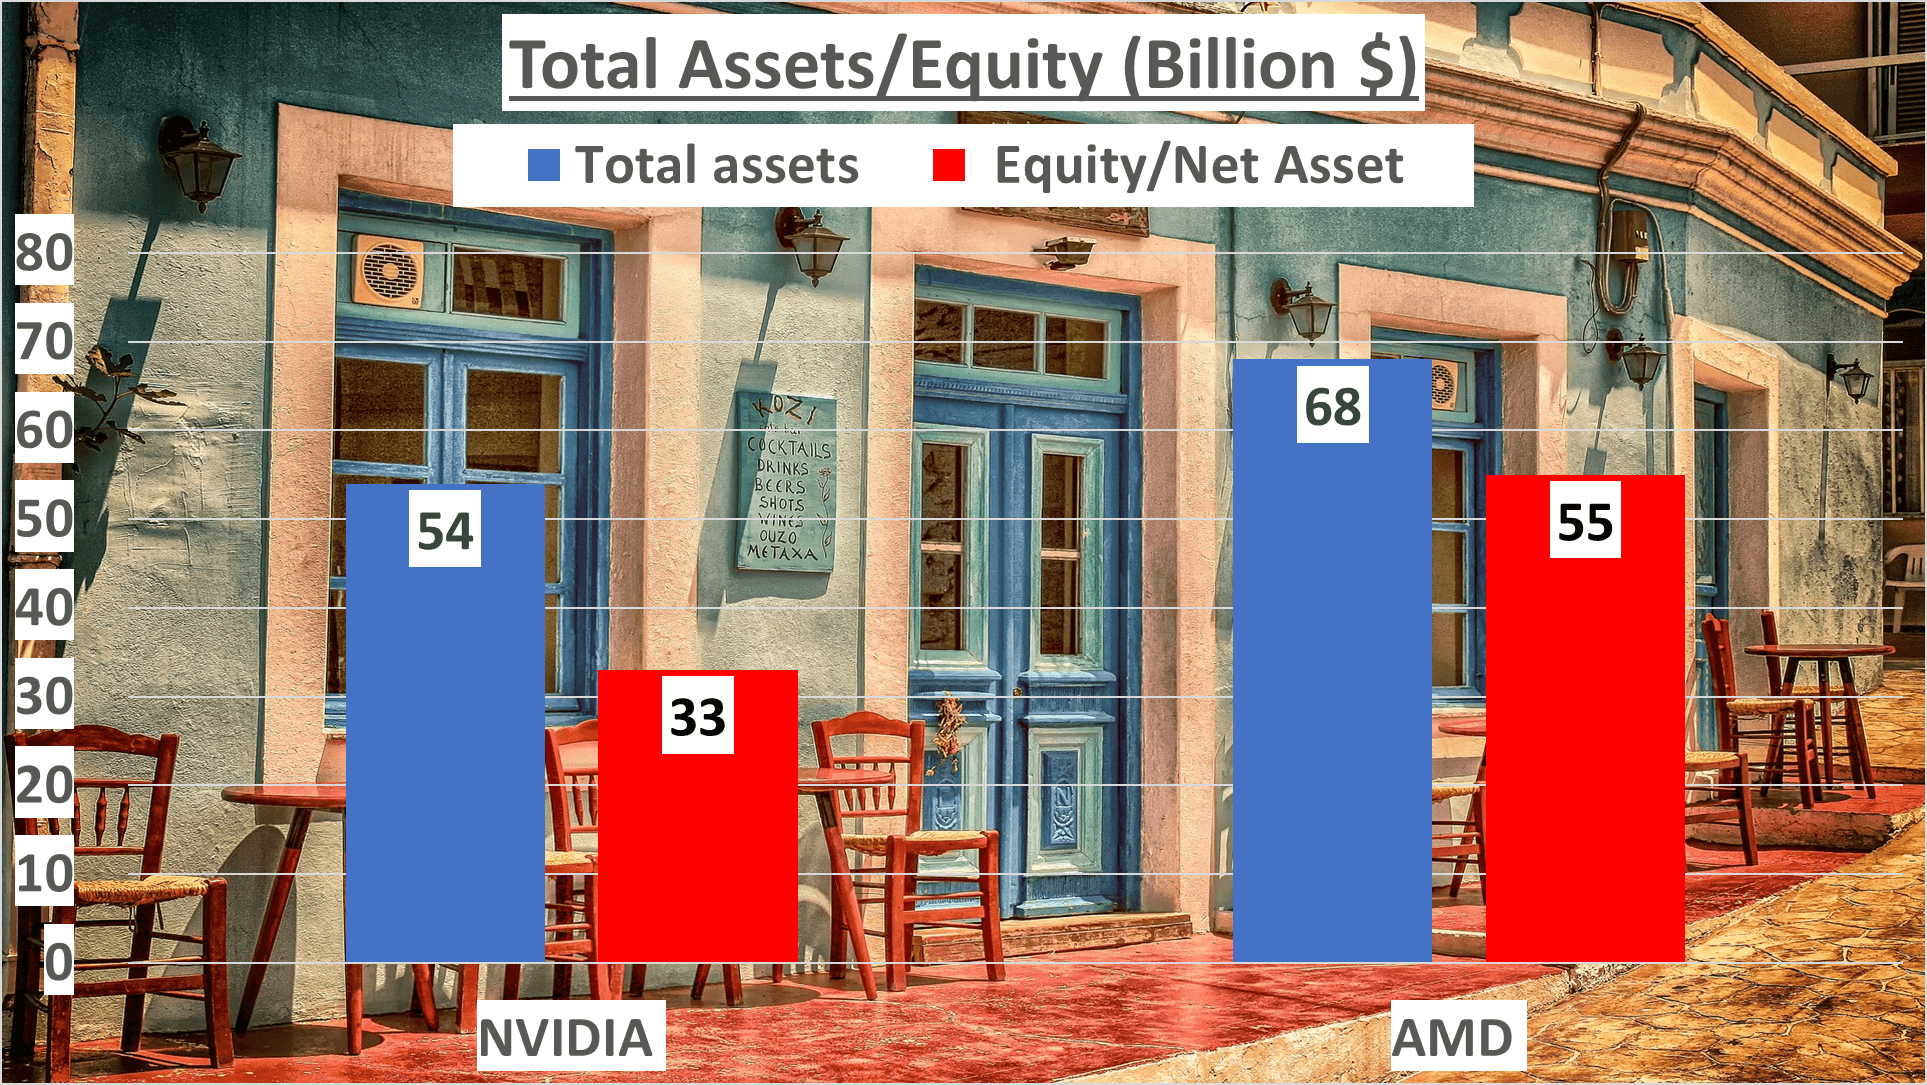
However, the net assets paint a different picture. NVIDIA reports $33B, whereas AMD records a higher $55B. Yet, this isn’t merely about numbers; it’s about the efficiency with which these companies utilize their assets to generate profits.
Now, let’s discuss ratios. NVIDIA’s Equity to Total Assets ratio stands at 61%, whereas AMD’s is 81%. This ratio signifies the proportion of a company’s assets financed by stockholders, not creditors. A higher ratio is generally preferred as it denotes lower financial risk.
Despite the smaller ratio, NVIDIA is yielding greater profits, suggesting its superior efficiency in leveraging assets for profit generation.
Now, shifting our focus to liquidity. The Current Ratio, indicating a company’s ability to meet short-term obligations, is 3.59 for NVIDIA and 2.19 for AMD.
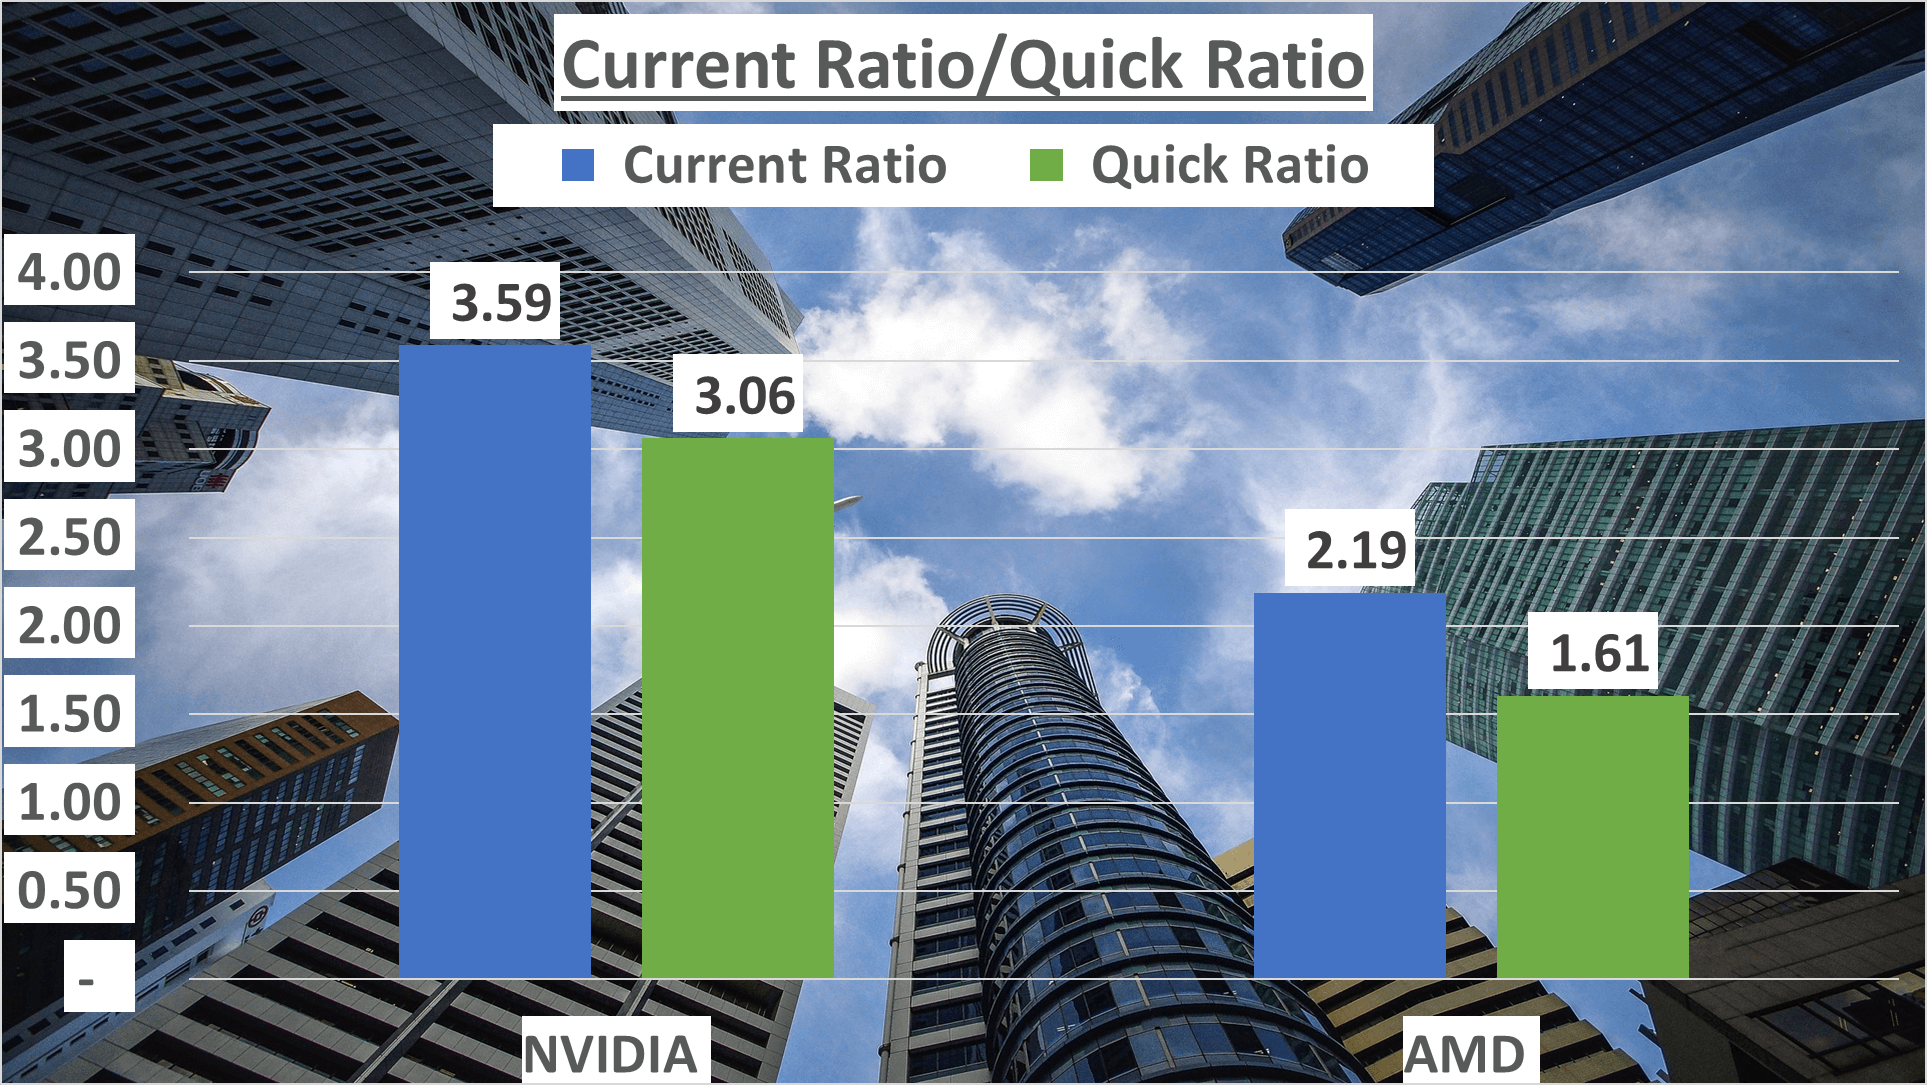
Additionally, the Quick Ratio, a stricter measure excluding inventory from current assets, favors NVIDIA with a ratio of 3.06, while AMD lags with 1.61.
Both companies exhibit commendable liquidity, ensuring smooth fulfillment of short-term obligations. Yet, NVIDIA eclipses AMD in this aspect, boasting higher ratios indicative of stronger liquidity.
To conclude, although AMD possesses more assets, NVIDIA demonstrates superior efficiency in asset utilization for profit generation. This efficiency in asset management serves as a significant indicator of financial robustness and operational efficacy, crucial for investors’ considerations.
NVIDIA’s proficiency in asset utilization positions it favorably for investors seeking promising investment opportunities.
Operational Efficiency and Cash Flow – NVIDIA vs AMD Stock Analysis
Let’s delve into operational efficiency and cash flow, crucial metrics offering insights into a company’s resource management and liquidity.
Firstly, inventory days – the average number of days items linger in inventory before sale. NVIDIA stands at 119 days, while AMD lingers slightly longer at 124 days. Though close, NVIDIA demonstrates a marginally superior grip on inventory management.
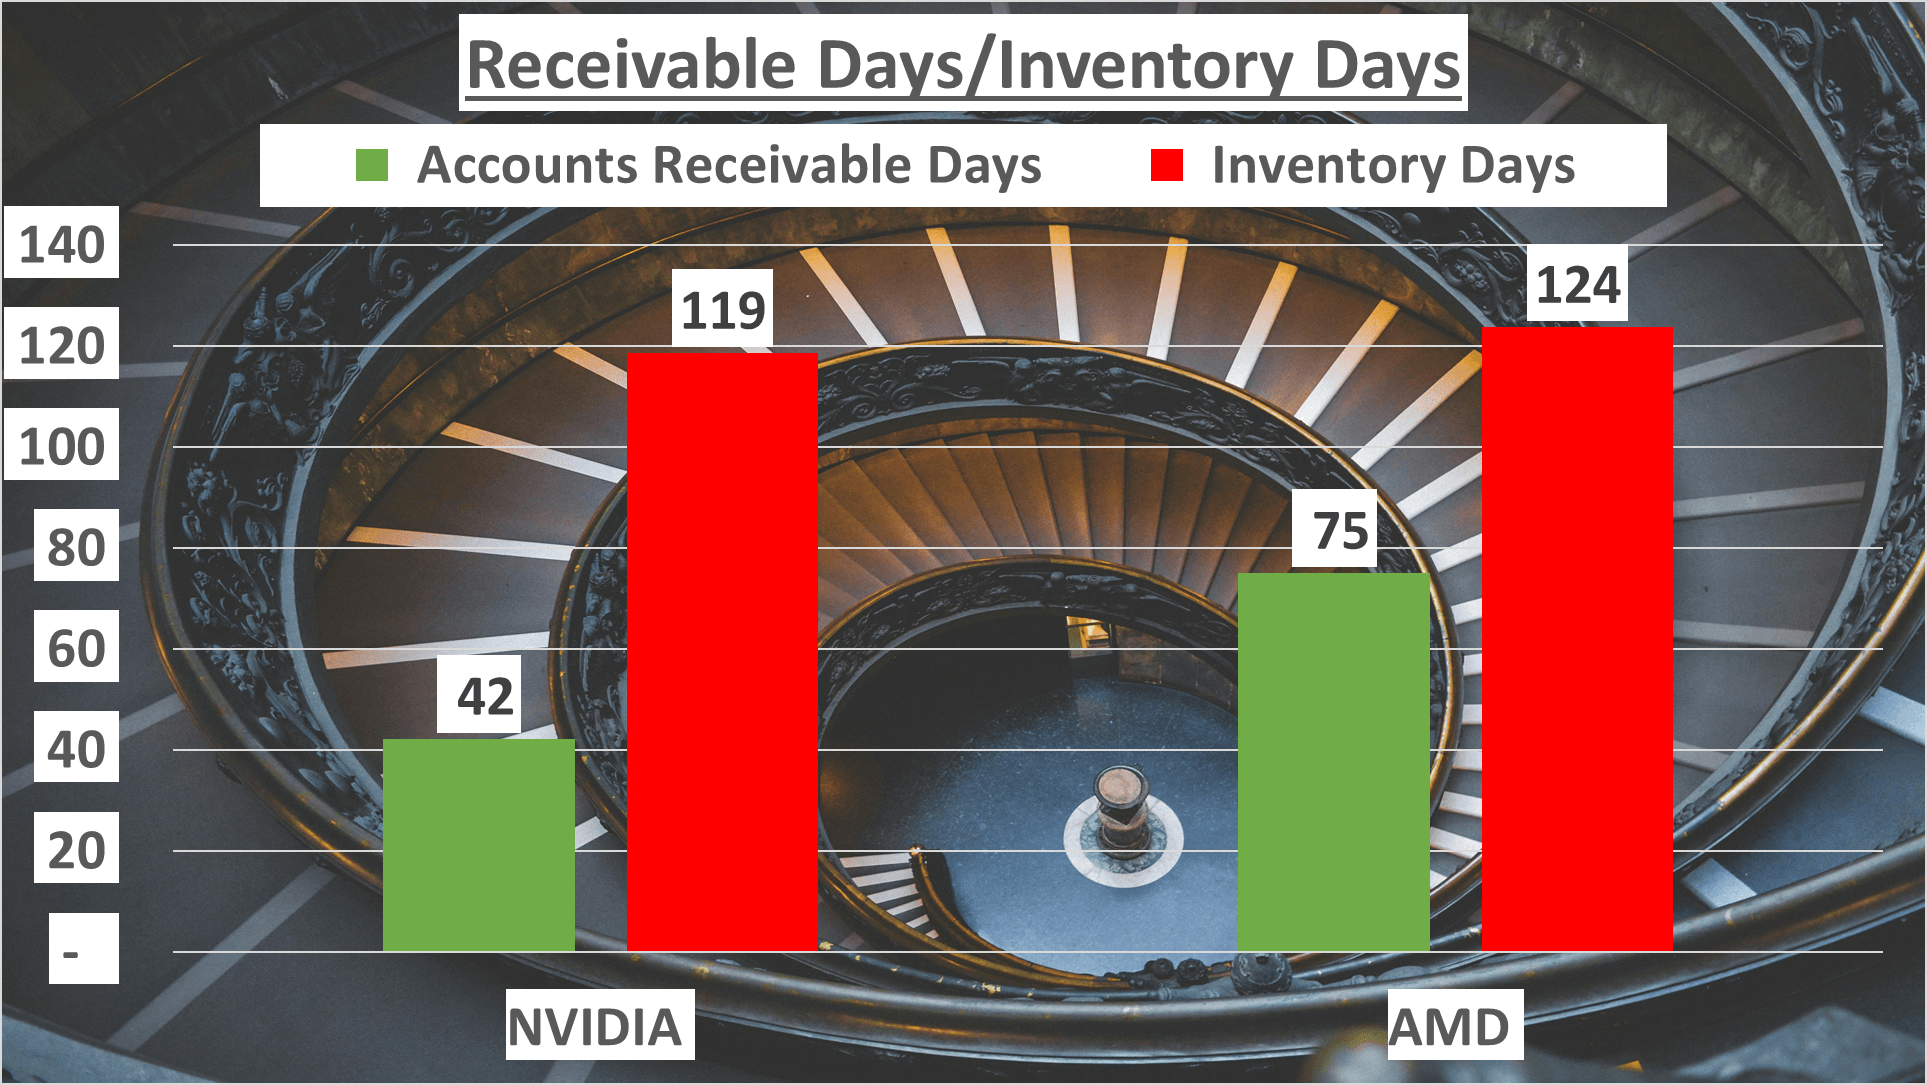
Moving on to Accounts Receivable Days – the average duration to collect payment post-sale. NVIDIA’s average spans 42 days, whereas AMD’s extends significantly to 75 days. Here, NVIDIA unmistakably outshines AMD, swiftly collecting payments.
Now, onto cash flow, particularly Operating Cash Flow (OCF) and Free Cash Flow (FCF). OCF represents cash from regular operations. In the first three quarters of 2023, NVIDIA recorded $16.6B, towering over AMD’s $1.3B.
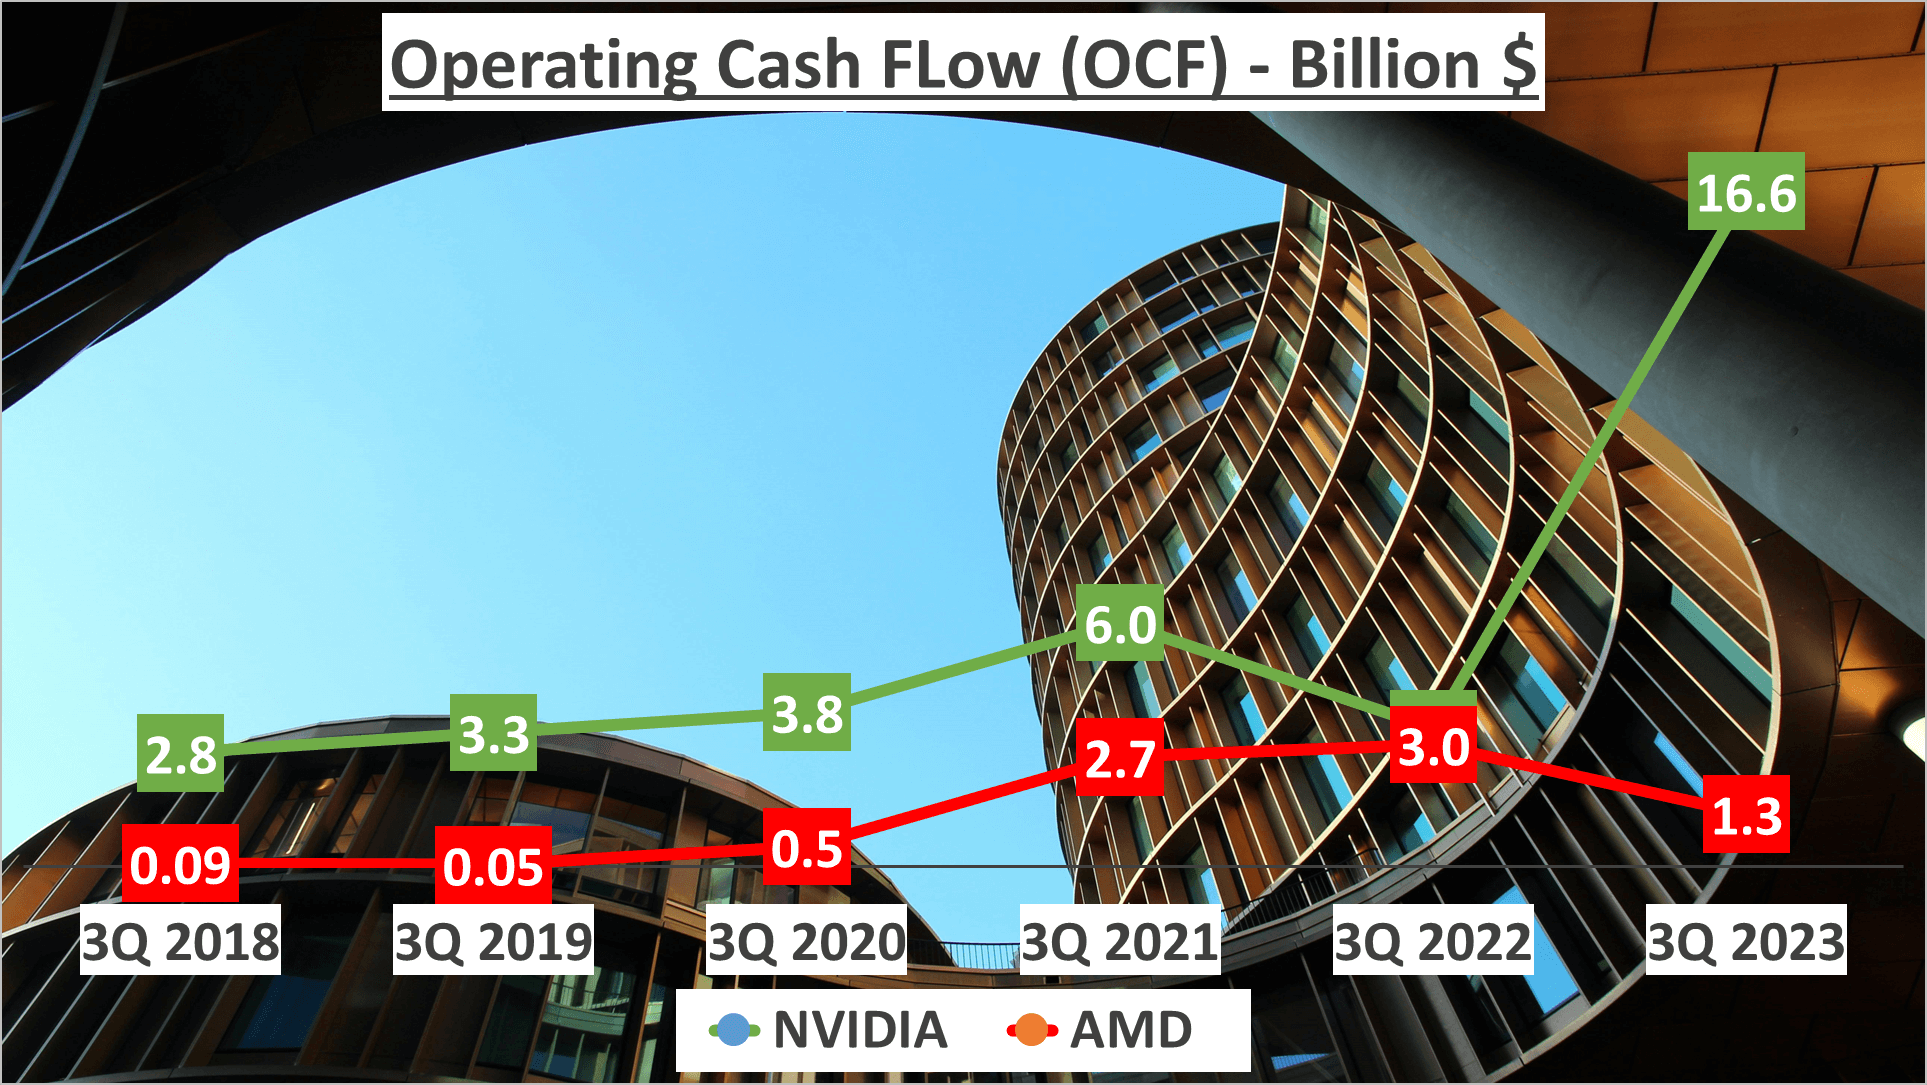
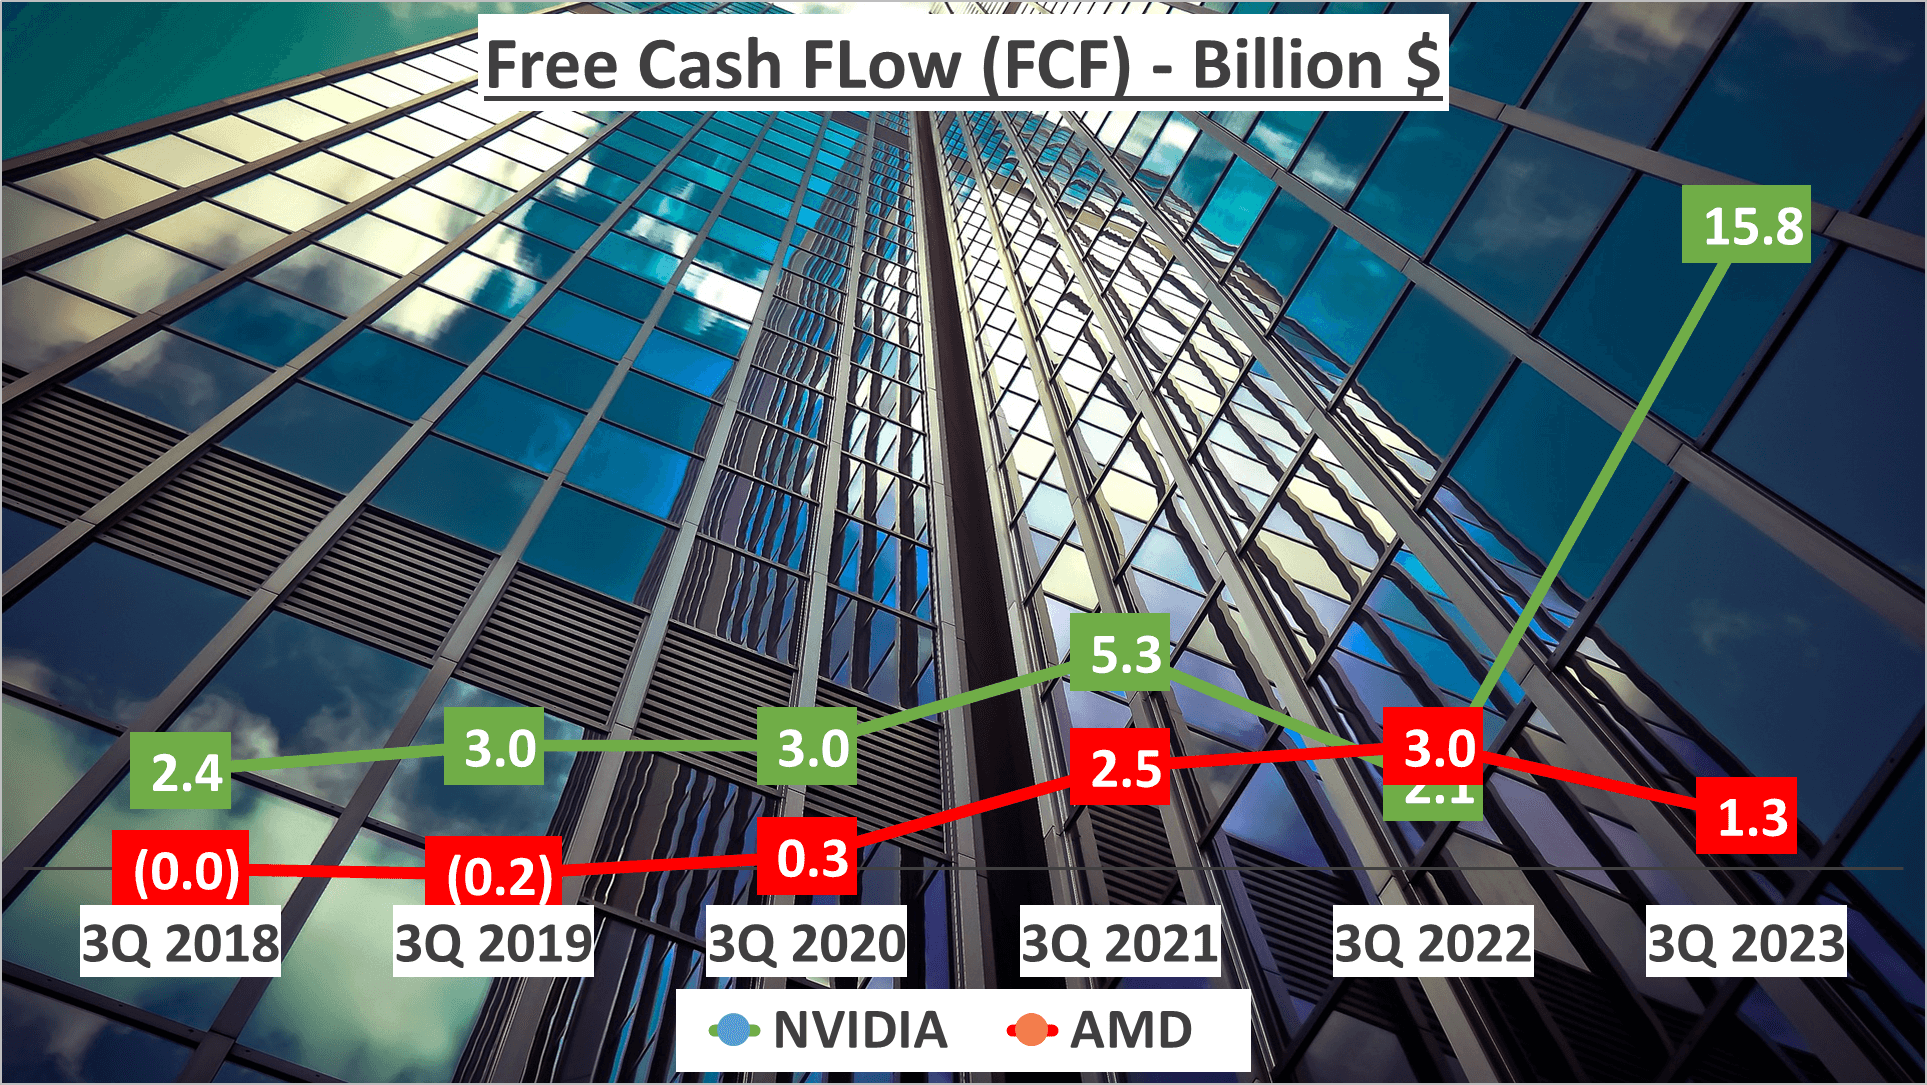
FCF, residual cash after operating and capital expenses, reflects NVIDIA’s dominance with $15.8B, far surpassing AMD’s $1.3B.
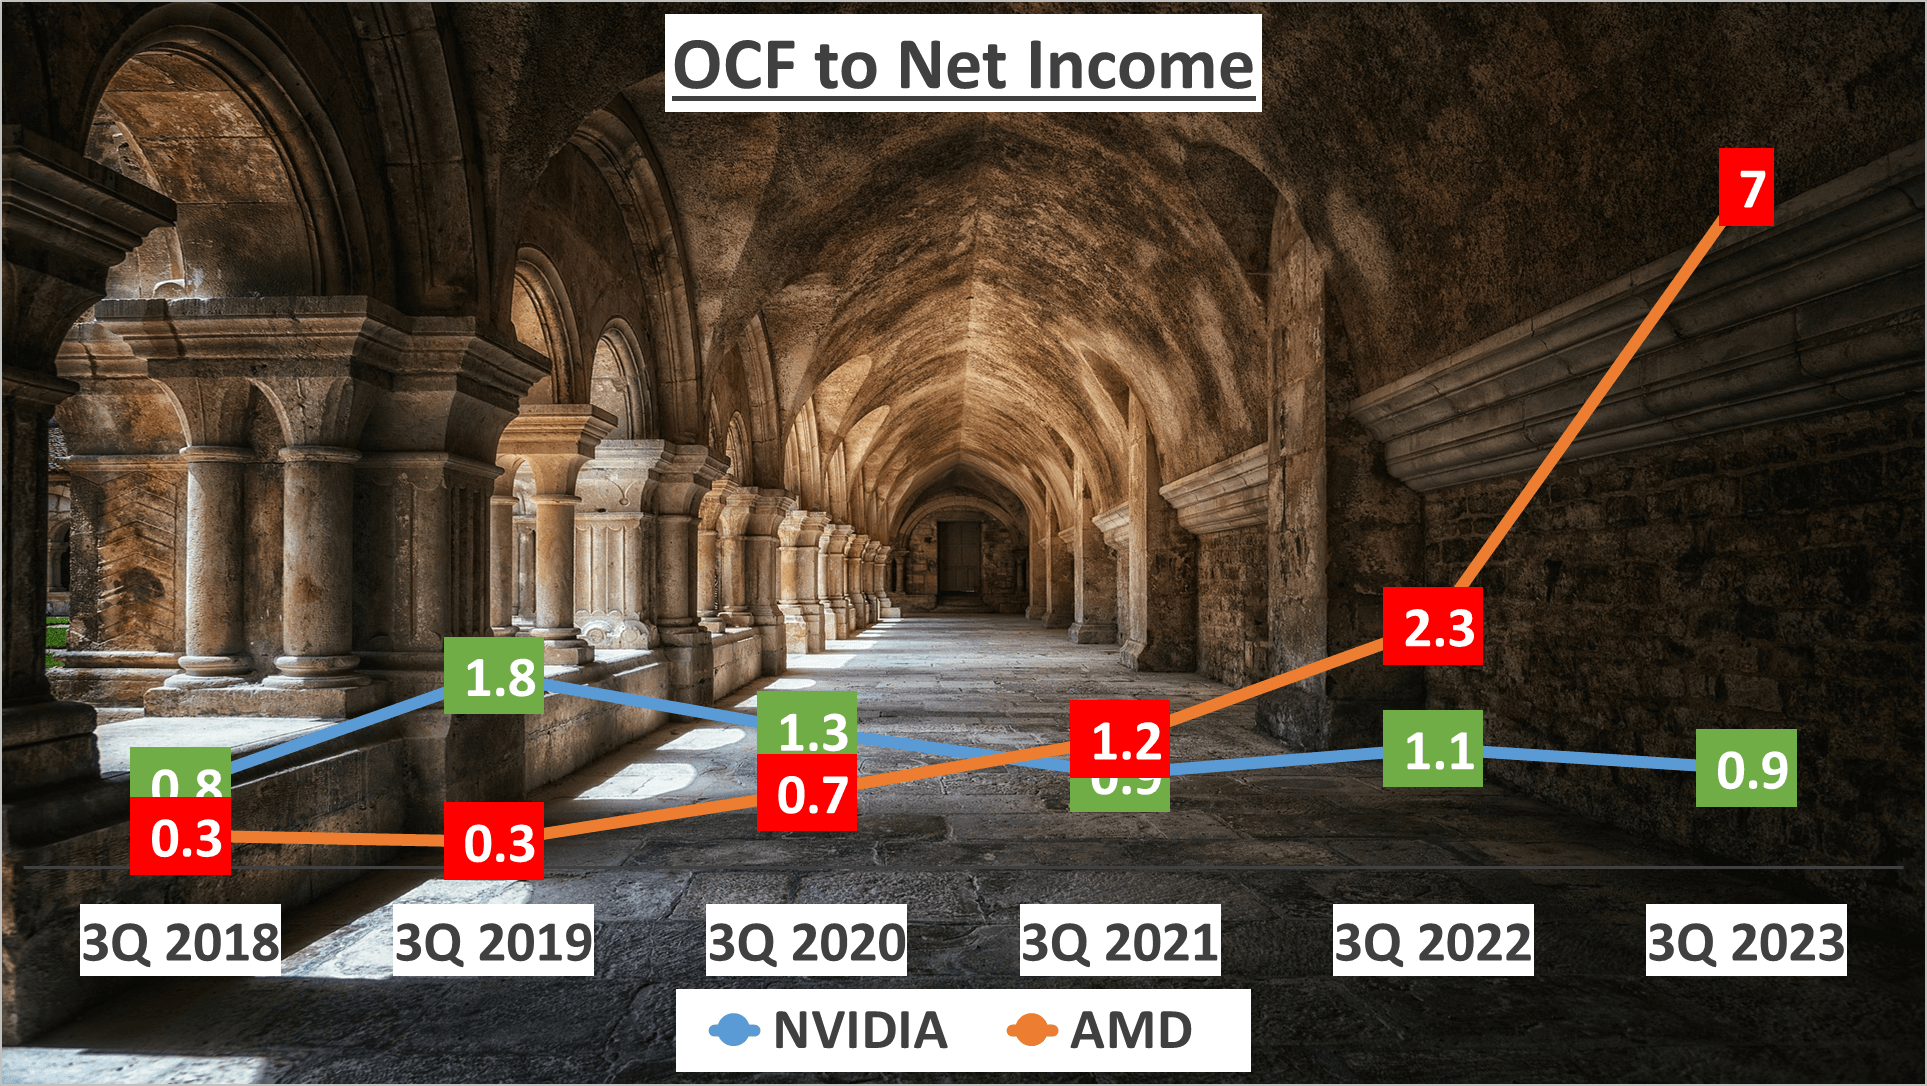
Finally, the OCF to Net Income ratio, comparing operating cash flow to net income, showcases NVIDIA at 0.9 and AMD at 6.9.
In conclusion, while both exhibit robust liquidity, NVIDIA excels in cash flow management. These factors merit consideration for potential investors eyeing either tech giant.
Dupont Analysis – NVIDIA vs AMD Stock Analysis
Let’s scrutinize the ROE (Return on Equity) of these tech giants through Dupont Analysis. ROE, a pivotal financial gauge, divides net income by shareholders’ equity, offering insight into profitability within the sector.
In the third quarter of 2023, NVIDIA boasted a staggering 70% ROE, propelled by its impressive 45% Net Profit Margin. Conversely, AMD lagged far behind with a mere 0.5% ROE and a paltry 1% Net Profit Margin.
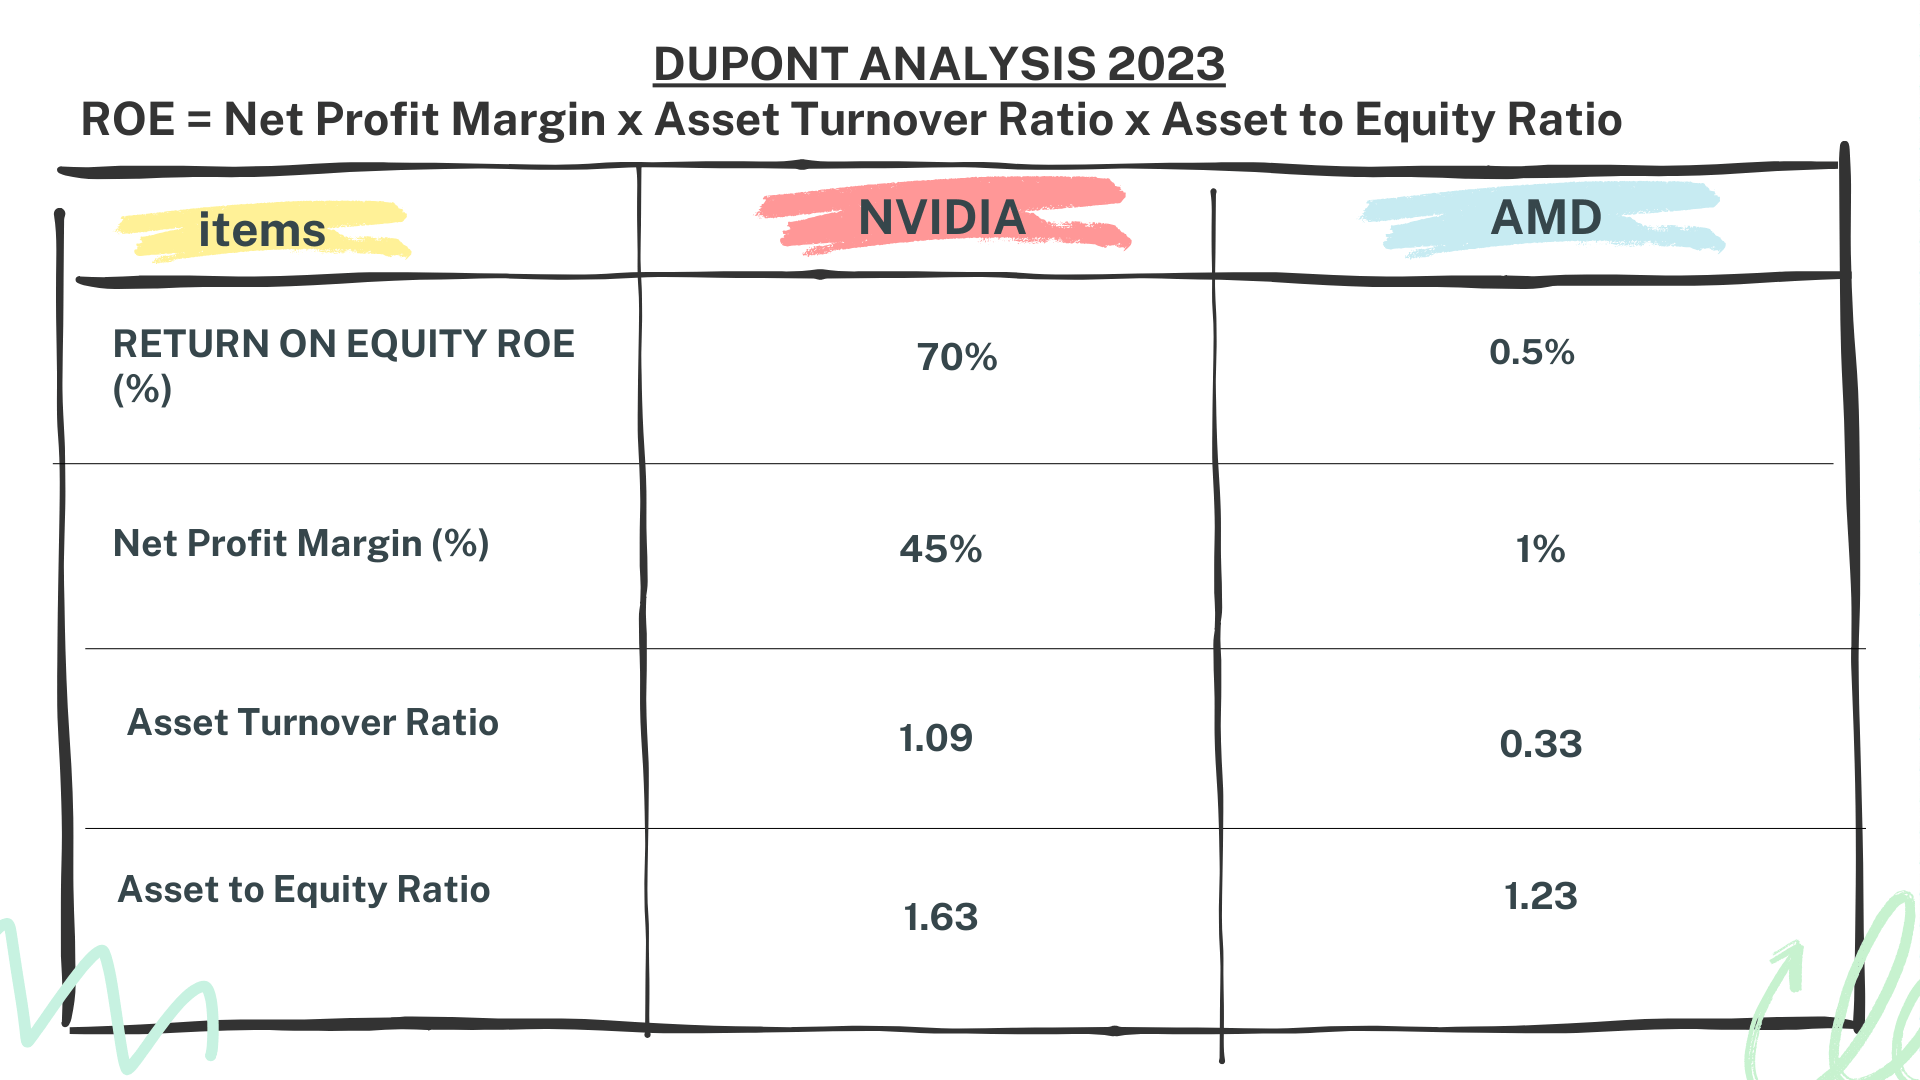
The Asset Turnover, gauging asset efficiency in sales generation, favored NVIDIA at 1.09 compared to AMD’s 0.33.
Furthermore, the Asset to Equity ratio, indicating the proportion of assets financed by equity, stood at 1.63 for NVIDIA and 1.23 for AMD.
NVIDIA’s robust ROE primarily stems from its substantial Net Profit Margin, underscoring its profitability prowess.
Conclusion – NVIDIA vs AMD Stock Analysis

In the NVIDIA vs AMD showdown, which emerges as the winner? In essence, NVIDIA exhibits remarkable growth, boasting superior profit margins and adept asset management. Leveraging the AI surge, NVIDIA garners substantial profits with fewer assets.
On the flip side, AMD demonstrates resilience, sporting a diverse revenue structure and a higher net asset value. In summary, while both contenders possess commendable strengths, NVIDIA appears to hold an advantage across several fronts. Nonetheless, the ultimate choice should align with your investment objectives and risk appetite.
Author: investforcus.com
Follow us on Youtube: The Investors Community

