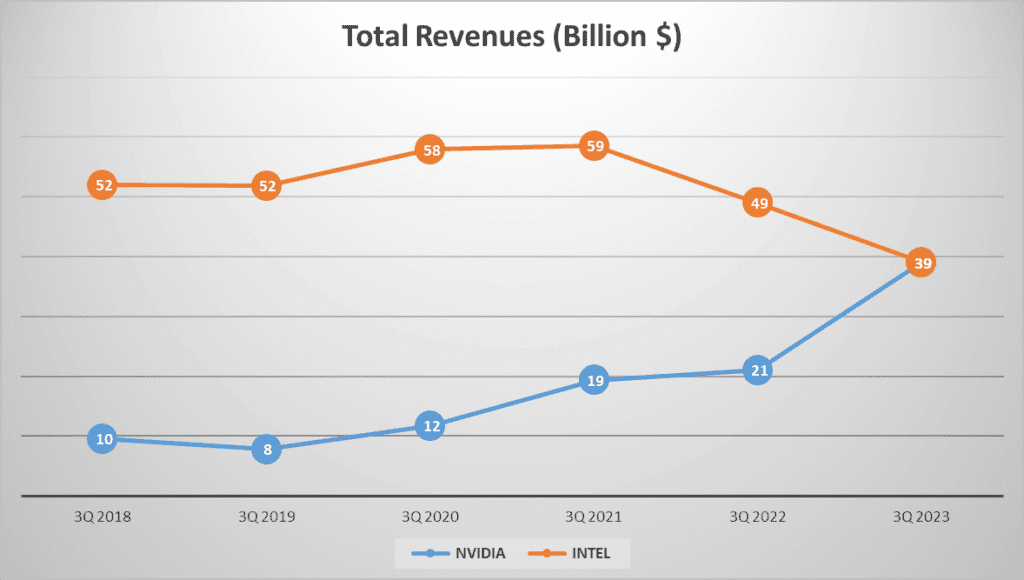
In the realm of the US semiconductor industry, NVIDIA vs. INTEL Stock Analysis stand as two colossal giants. But how do their financial performances stack up against each other?” To answer this, we delve deep into the financial labyrinth of these tech titans, beginning with their total revenues. By the end of the third quarter of 2023, both NVIDIA vs. INTEL Stock Analysis posted total revenues of 39 billion dollars. A striking revelation when we look back five years to the same period in twenty eighteen. Back then, NVIDIA’s revenue stood at a modest 9.5 billion dollars, while INTEL boasted a whopping fifty-two billion.
This translates to a Compound Annual Growth Rate, or CAGR, of an impressive 33% for NVIDIA. On the flip side, INTEL’s CAGR over the same period slumped by 6%. The revenue composition of these companies also paints an intriguing picture. NVIDIA’s revenues are largely driven by its Data Center segment, which contributes 75% to the total, while INTEL’s primary revenue spinner is their Client Computing segment, accounting for 55% of their total revenue.
Over the years, NVIDIA’s financial journey has been marked by remarkable growth, while INTEL has experienced a downturn. But what’s behind these trends?” Stay tuned as we unearth the dynamics that have shaped the financial trajectories of these semiconductor powerhouses in the scenes to follow.
Revenue Breakdown and Profit Margins – NVIDIA vs. INTEL Stock Analysis
Diving deeper into the numbers, we find intriguing patterns in the revenue streams of both companies. By the end of the third quarter of 2023, NVIDIA’s total revenue hit 39 billion dollars, a substantial increase from the 10 billion reported five years ago in 2018. This represents a commendable compound annual growth rate of 33%.
A closer look reveals that 75% of NVIDIA’s revenue comes from the Data Center segment, 20% from Gaming, and the remaining 5% is split between Professional Visualization and others. This suggests that NVIDIA’s growth is largely driven by the global surge in AI technologies, which has significantly increased demand for their chips.
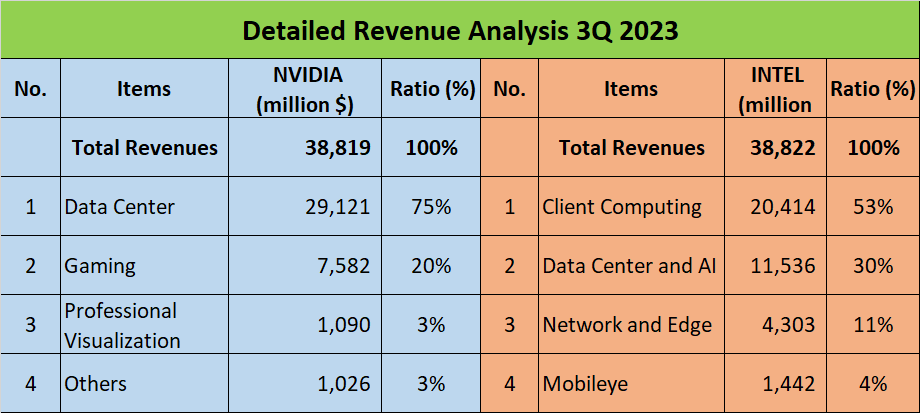
On the other side, INTEL also reported a total revenue of 39 billion dollars in the same period. However, this is a decline from the 52 billion dollars reported in 2018, marking a -6% compound annual growth rate over five years. The revenue breakdown shows that 53% comes from Client Computing, 30% from Data Center and AI, 11% from Network and Edge, and the remaining 6% is from Mobileye and other segments. It seems INTEL’s diversified portfolio is not faring as well as NVIDIA’s focused approach.
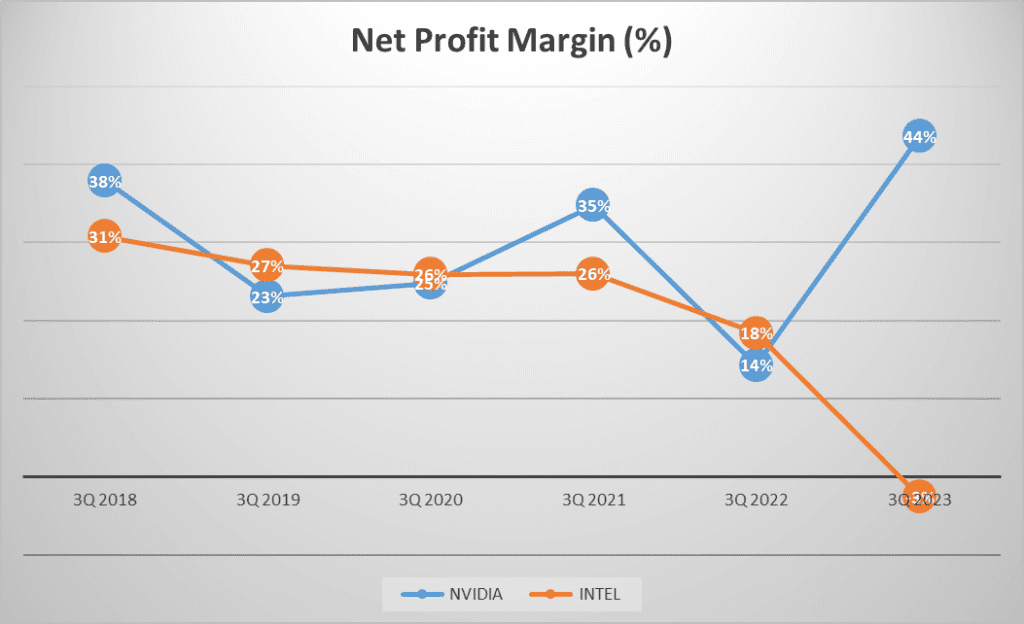
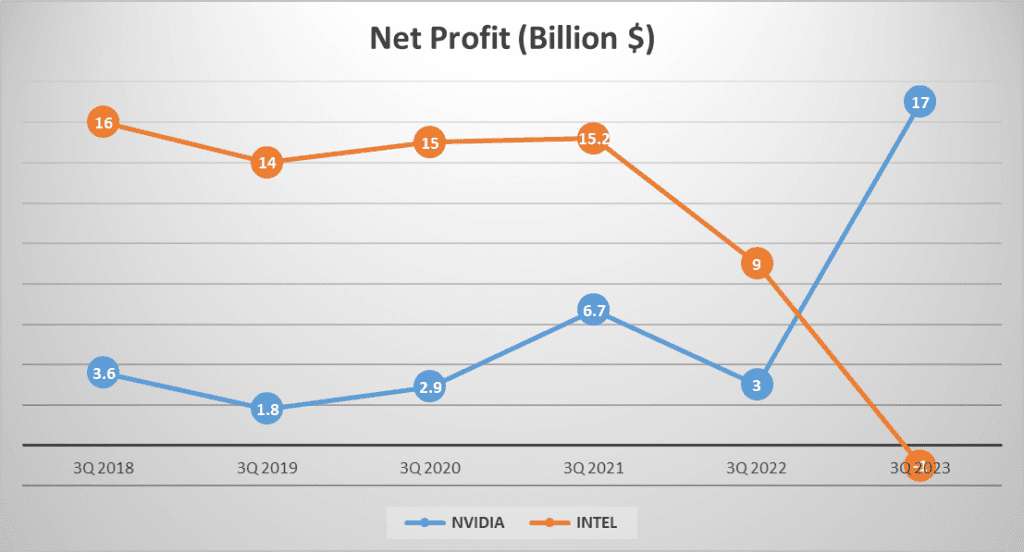
Now, let’s talk about profit margins. NVIDIA’s gross profit margin stands at an impressive 71%, with a net profit of 17 billion dollars. This shows a significant increase from the 3.6 billion dollars reported in twenty eighteen, marking a strong compound annual growth rate of 36%. INTEL, on the other hand, has a gross profit margin of 38% and reported a net loss of -1 billion dollars. This is a steep decline from the 16 billion dollars net profit reported in twenty eighteen, marking a negative compound annual growth rate of one hundred 57%.
Clearly, NVIDIA’s focus on AI chips has given it a significant edge, while INTEL’s diversified portfolio seems to be struggling. But, how does this reflect in their assets?
Assets and Equity – NVIDIA vs. INTEL Stock Analysis
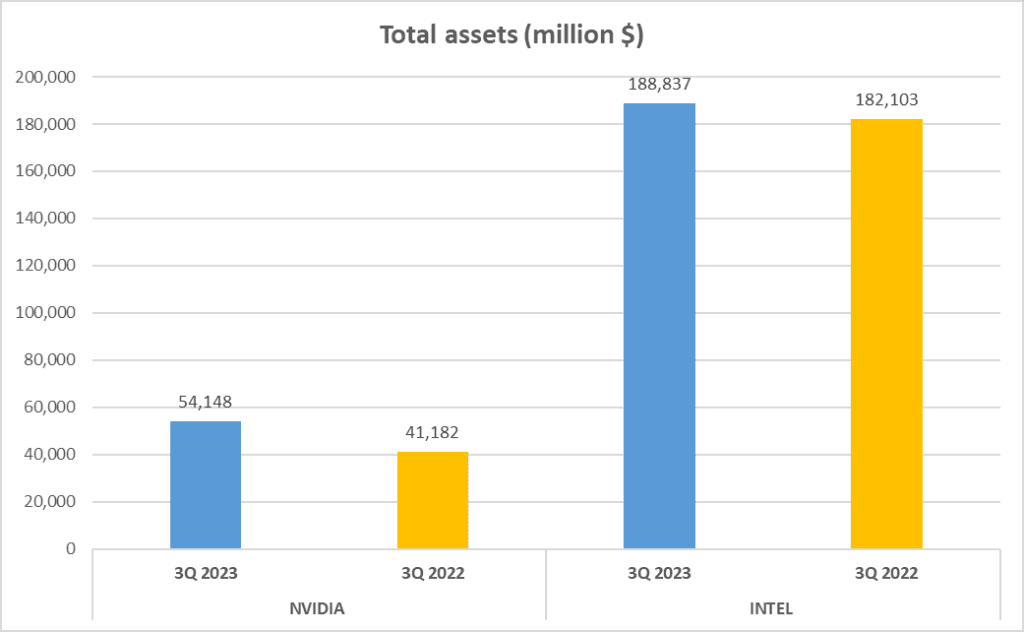
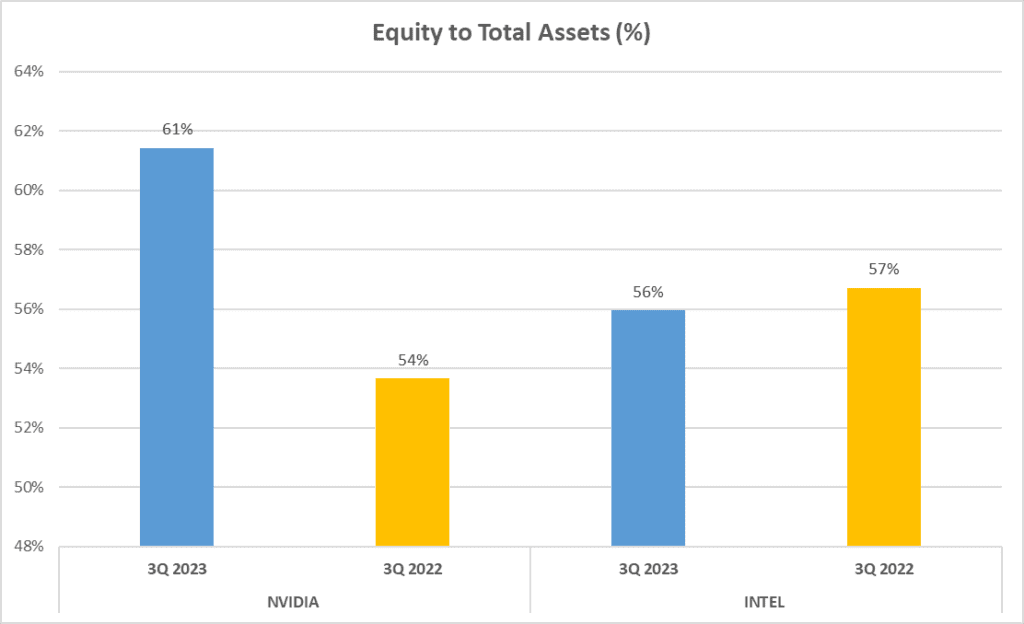
A company’s assets and equity provide valuable insights into its financial health. So, let’s take a look at NVIDIA vs. INTEL Stock Analysis. NVIDIA’s total assets amount to 54 billion dollars, while INTEL boasts a staggering one hundred 89 billion dollars. On the equity front, NVIDIA has 33 billion dollars of net assets, while INTEL has a massive 106 billion dollars. This gives NVIDIA an Equity to Total Assets ratio of 61%, slightly higher than INTEL’s 56%.
Now, let’s delve a little deeper and examine the distribution of fixed assets and short-term investments. INTEL’s fixed assets account for forty-nine % of their total assets, while NVIDIA’s fixed assets make up a mere 7%. This is a stark contrast, indicating INTEL’s heavy reliance on physical infrastructure, while NVIDIA appears to have a lighter asset base.
On the other hand, when we look at short-term investments, NVIDIA clearly takes the lead. These investments make up 24% of NVIDIA’s total assets, compared to INTEL’s 9%. This suggests that NVIDIA is a more agile player, ready to pivot and seize emerging opportunities.
In summary, while INTEL’s assets far outweigh those of NVIDIA, the distribution of these assets paints a different picture. INTEL’s wealth lies in its vast physical infrastructure, a testament to its long-standing dominance in the industry. NVIDIA, however, focuses more on short-term investments, indicating a dynamic strategy that adapts to the rapidly changing tech landscape.
These figures show a clear contrast between NVIDIA’s flexibility and INTEL’s size. How does this impact their liquidity?
Liquidity and Operational Efficiency – NVIDIA vs. INTEL Stock Analysis
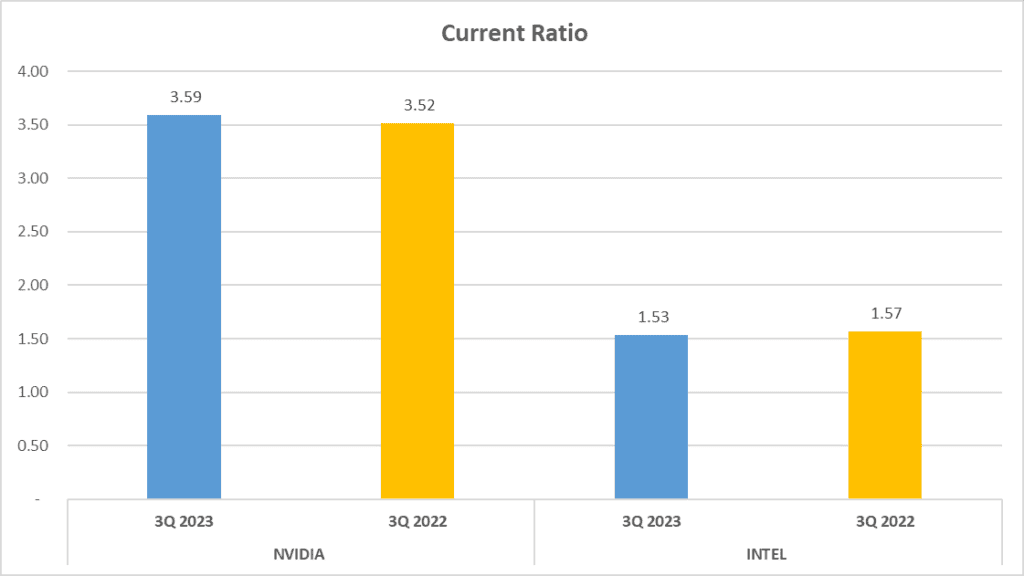
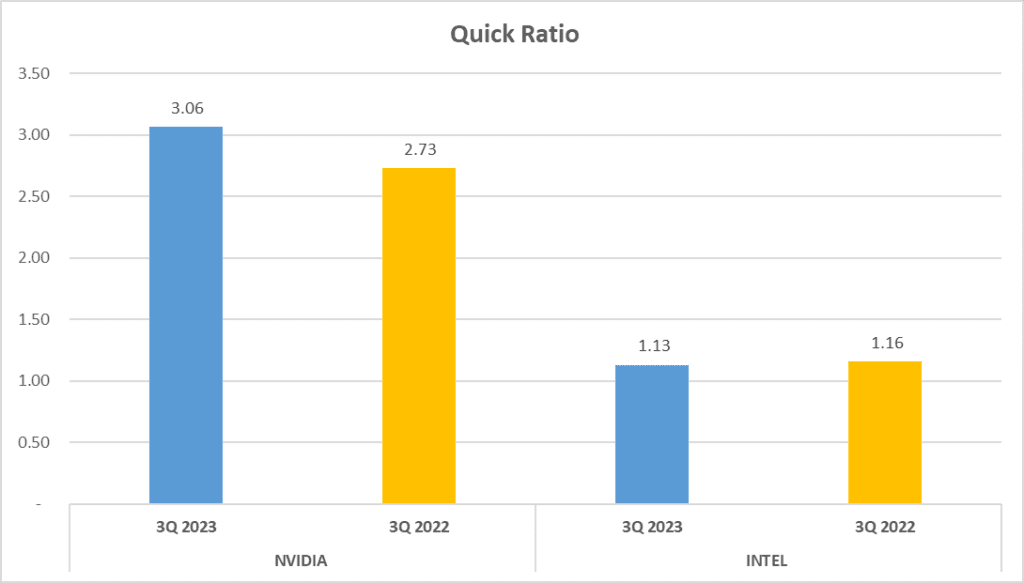
When it comes to liquidity and operational efficiency, NVIDIA vs. INTEL Stock Analysis tell two different tales. In the realm of liquidity, the Current Ratio and Quick Ratio are key indicators. NVIDIA’s Current Ratio stands at a robust 3.59, while INTEL trails behind at 1.53. The Quick Ratio tells a similar story, with NVIDIA leading the pack at 3.06 and INTEL following at 1.13.
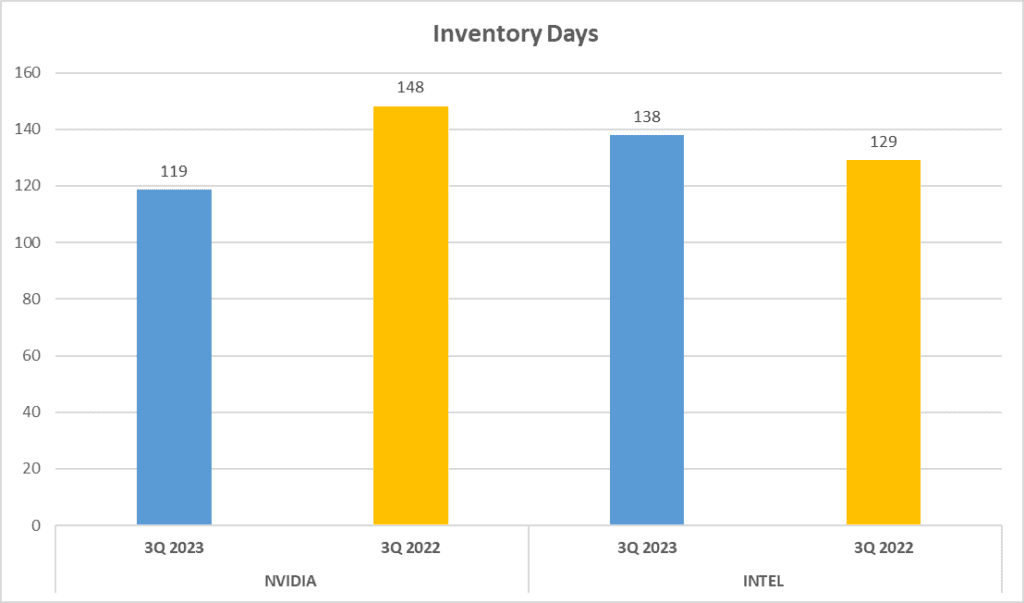
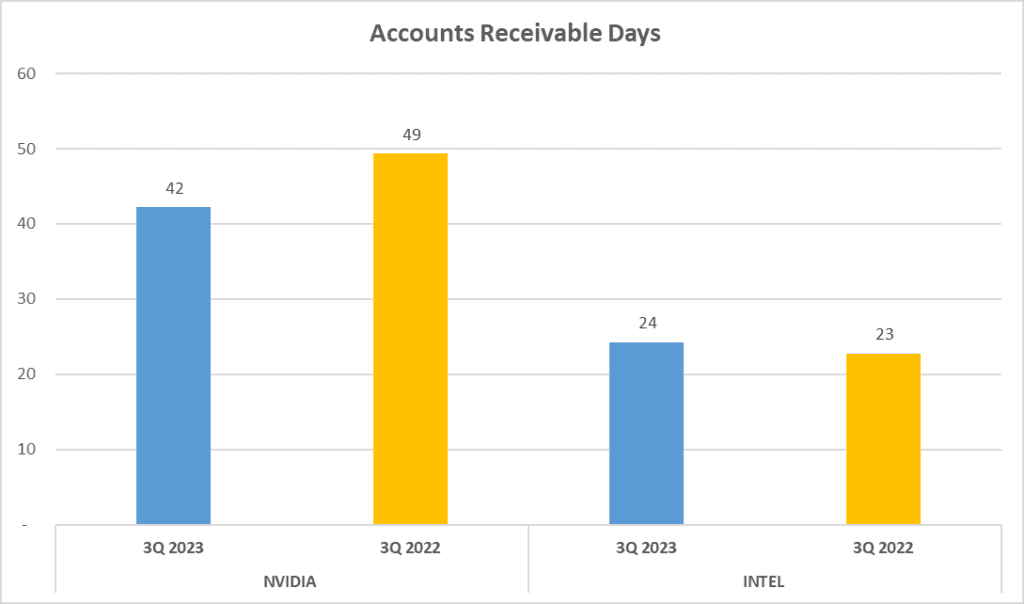
Now, let’s talk about operational efficiency. Here, we focus on Inventory Days and Accounts Receivable Days. NVIDIA’s Inventory Days clock in at 119 days, while INTEL takes a little longer, at 138 days. This indicates that NVIDIA is quicker at moving its inventory from production to sales. When we look at Accounts Receivable Days, we see a flip in the narrative. NVIDIA takes 42 days to collect its receivables, whereas INTEL only takes 24 days. This suggests that INTEL is more efficient in collecting payments from its customers.
The story continues with Total Assets Turnover, a key measure of how effectively a company uses its assets to generate sales. NVIDIA turns over its total assets at a rate of 1.09 rounds, while INTEL lags with a rate of just 0.28 rounds. This means that NVIDIA is more effective at using its assets to generate sales, a crucial factor in operational efficiency.
In conclusion, when it comes to liquidity and operational efficiency, NVIDIA appears to have the upper hand. It boasts a stronger liquidity position and a more efficient operation, as indicated by its higher Current Ratio, Quick Ratio, and Total Assets Turnover and lower Inventory Days. INTEL, however, seems to be more efficient in collecting its receivables.
NVIDIA’s efficiency and liquidity seem to give it an edge. But how does this translate into cash flow?
Cash Flow and Dupont Analysis – NVIDIA vs. INTEL Stock Analysis
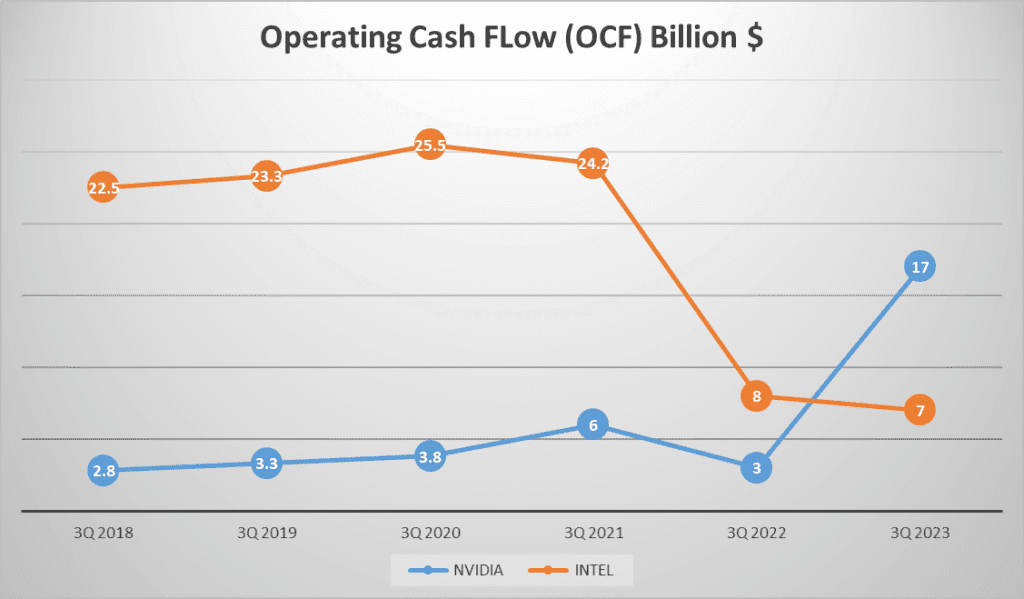
Cash flow is the lifeblood of any company. Let’s see how NVIDIA vs. INTEL Stock Analysis fare in this regard.
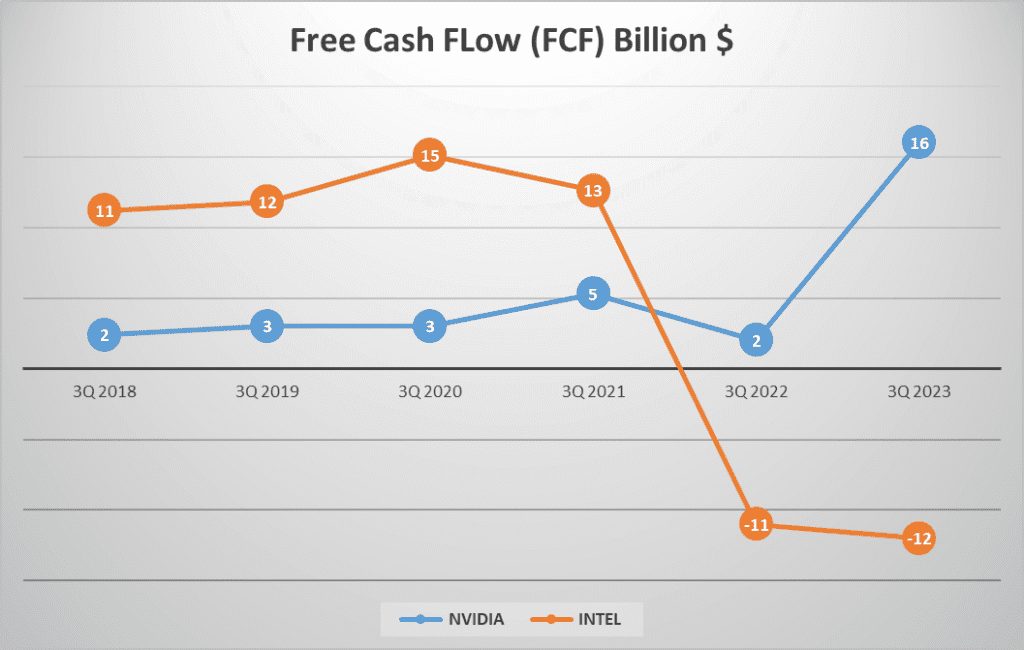
NVIDIA’s Operating Cash Flow, or OCF, for the third quarter of 2023 was a whopping 17 billion dollars, a significant leap from previous years. INTEL, on the other hand, reported 7 billion dollars in OCF. The Free Cash Flow, or FCF, tells a similar story with NVIDIA reporting 16 billion dollars and INTEL in a deficit with -12 billion dollars.
The OCF to Net Income ratio is another key indicator of a company’s financial health. For NVIDIA, this ratio stands at 0.9, suggesting a strong correlation between the company’s net income and its operating cash flow. For INTEL, however, this ratio is a concerning negative seven, indicating a disconnect between the two.
Now, let’s delve into the Dupont Analysis, a technique that dissects a company’s Return on Equity, or ROE. The analysis breaks down ROE into three components: Net Profit Margin, Asset Turnover Ratio, and Asset to Equity Ratio.
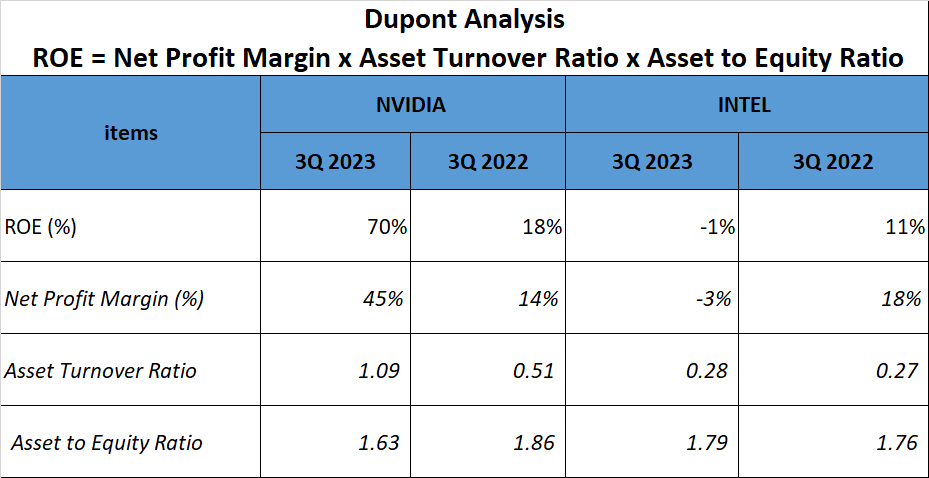
In the third quarter of 2023, NVIDIA’s ROE was an impressive 70%. This was driven by a Net Profit Margin of 45%, an Asset Turnover Ratio of 1.09, and an Asset to Equity Ratio of 1.63.
INTEL, in contrast, reported a negative ROE of 1%, with a Net Profit Margin of -3%, an Asset Turnover Ratio of 0.28, and an Asset to Equity Ratio of 1.79.
It’s clear that NVIDIA’s focus on AI chips has paid off financially, while INTEL’s diversified approach has struggled. But remember, the financial journey of a company is a complex narrative with many chapters yet to unfold.
Conclusion and Call to Action
The financial journeys of NVIDIA vs. INTEL Stock Analysis offer valuable insights for investors. We’ve seen NVIDIA’s dramatic growth, driven by the rise of AI and their dominance in the Data Center and Gaming sectors. Meanwhile, INTEL’s financial performance has been less stellar, despite their larger asset base.
These trends underline the importance of understanding a company’s financials before investing.
If there’s another company you’d like us to analyze, let us know in the comments.
Thank you for watching, and stay tuned for more financial analysis article!
Watching more on Youtube:
Author: Investforcus.com
Follow us on Youtube: The Investors Community


Thank you for your articles. They are very helpful to me. May I ask you a question?