P&G vs Colgate Stock Analysis – Ever pondered how P&G and Colgate fare in terms of financial performance?
Today, we embark on an in-depth exploration of the financial landscapes of these consumer goods giants, Procter & Gamble and Colgate. With over a century of operation, both companies stand as stalwarts in the industry, navigating market fluctuations, technological advancements, and evolving consumer preferences. Yet, they persist, thriving and maintaining relevance. But what’s the verdict on their financial prowess?
We’ll tackle this inquiry by scrutinizing various financial metrics including revenue, profit margins, investment returns, and overall financial robustness. It’s a clash of titans, a duel of figures, ratios, and percentages, and we’re here to unravel it all. So, fasten your seatbelts. This journey promises enlightenment. Join us as we delve into the financial realms of these giants and ascertain the victor.
Revenue Comparison – P&G vs Colgate Stock Analysis
Let’s kick off by comparing the revenue figures of both companies. In 2023, Procter & Gamble, commonly known as P&G, reported a total revenue of $82B. Conversely, Colgate’s total revenue for the same period amounted to $20B.
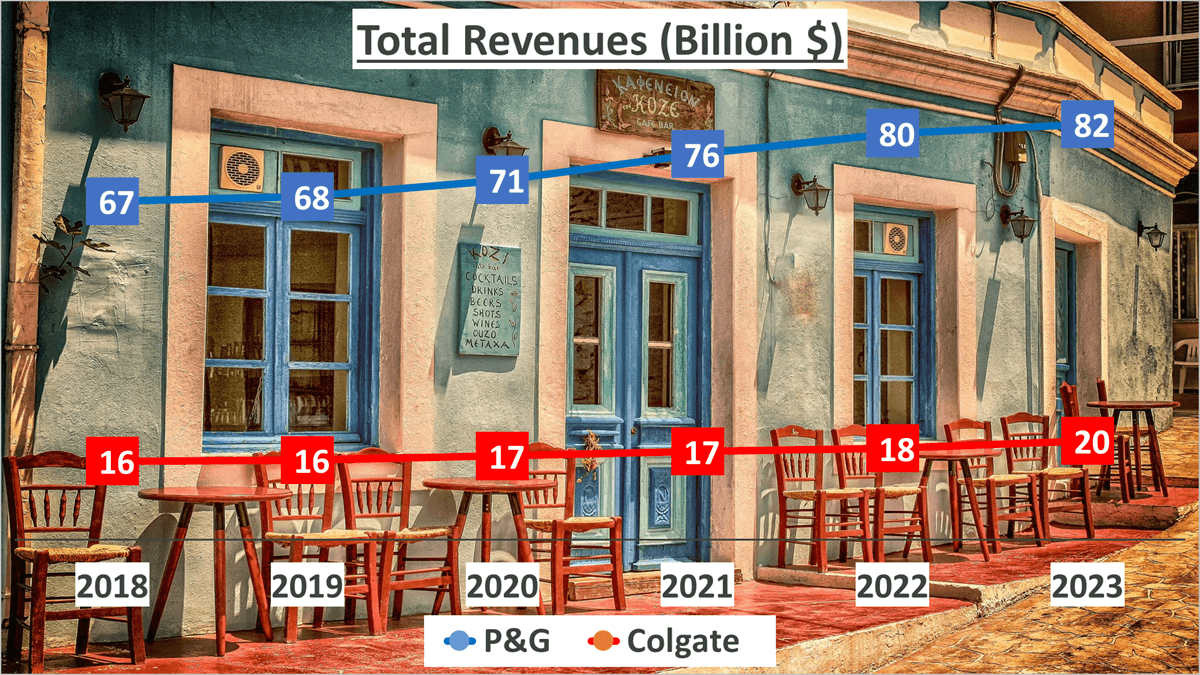
Over the past five years, P&G has witnessed a compounded annual growth rate (CAGR) of 4%, while Colgate experienced a slightly higher growth rate of 5%.
Now, let’s delve into their revenue breakdowns.
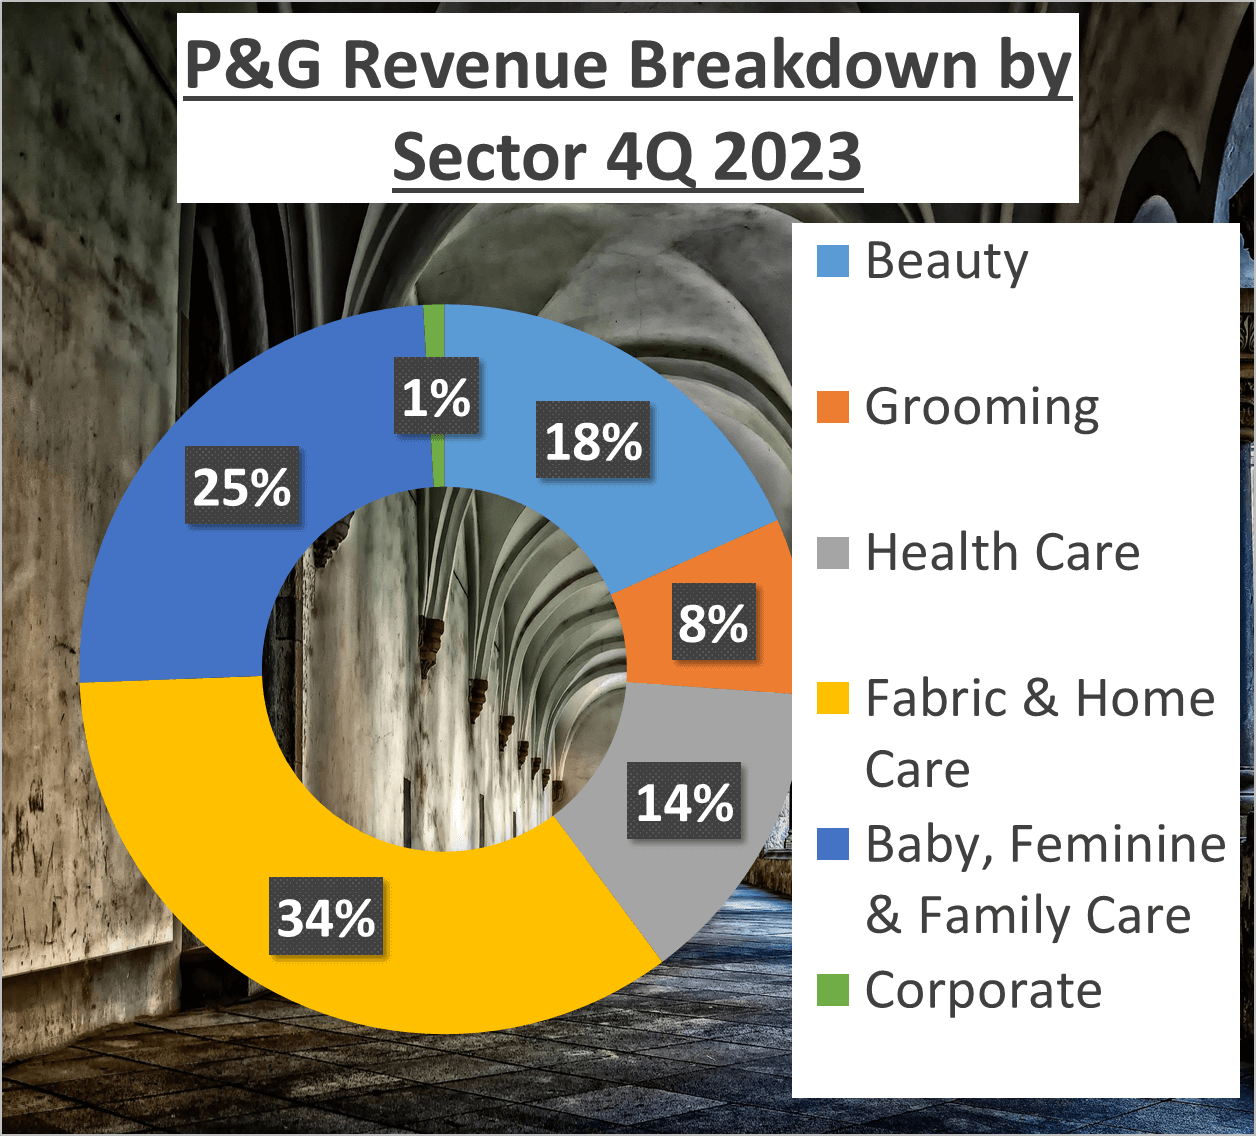
P&G’s revenue is primarily derived from five segments: Beauty (18%), Grooming (8%), Health Care (14%), Fabric & Home Care (35%), and Baby, Feminine & Family Care (25%).
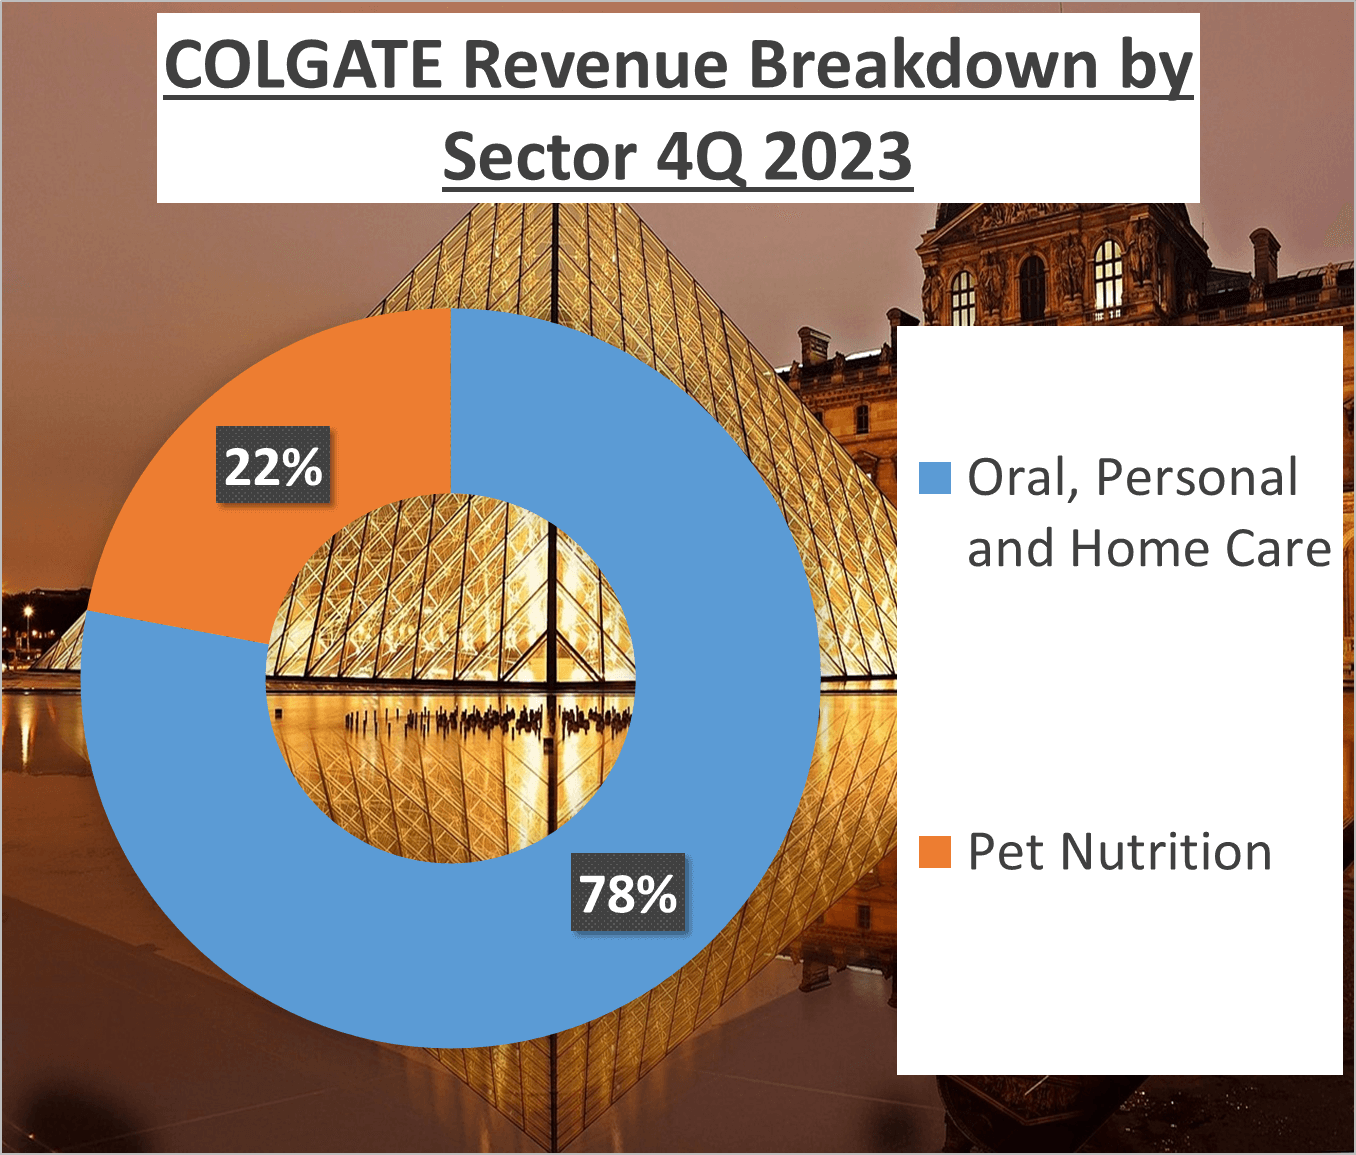
On the other hand, Colgate’s revenue structure is more straightforward, with 78% generated from Oral, Personal, and Home Care products, and the remaining 22% from Pet Nutrition.
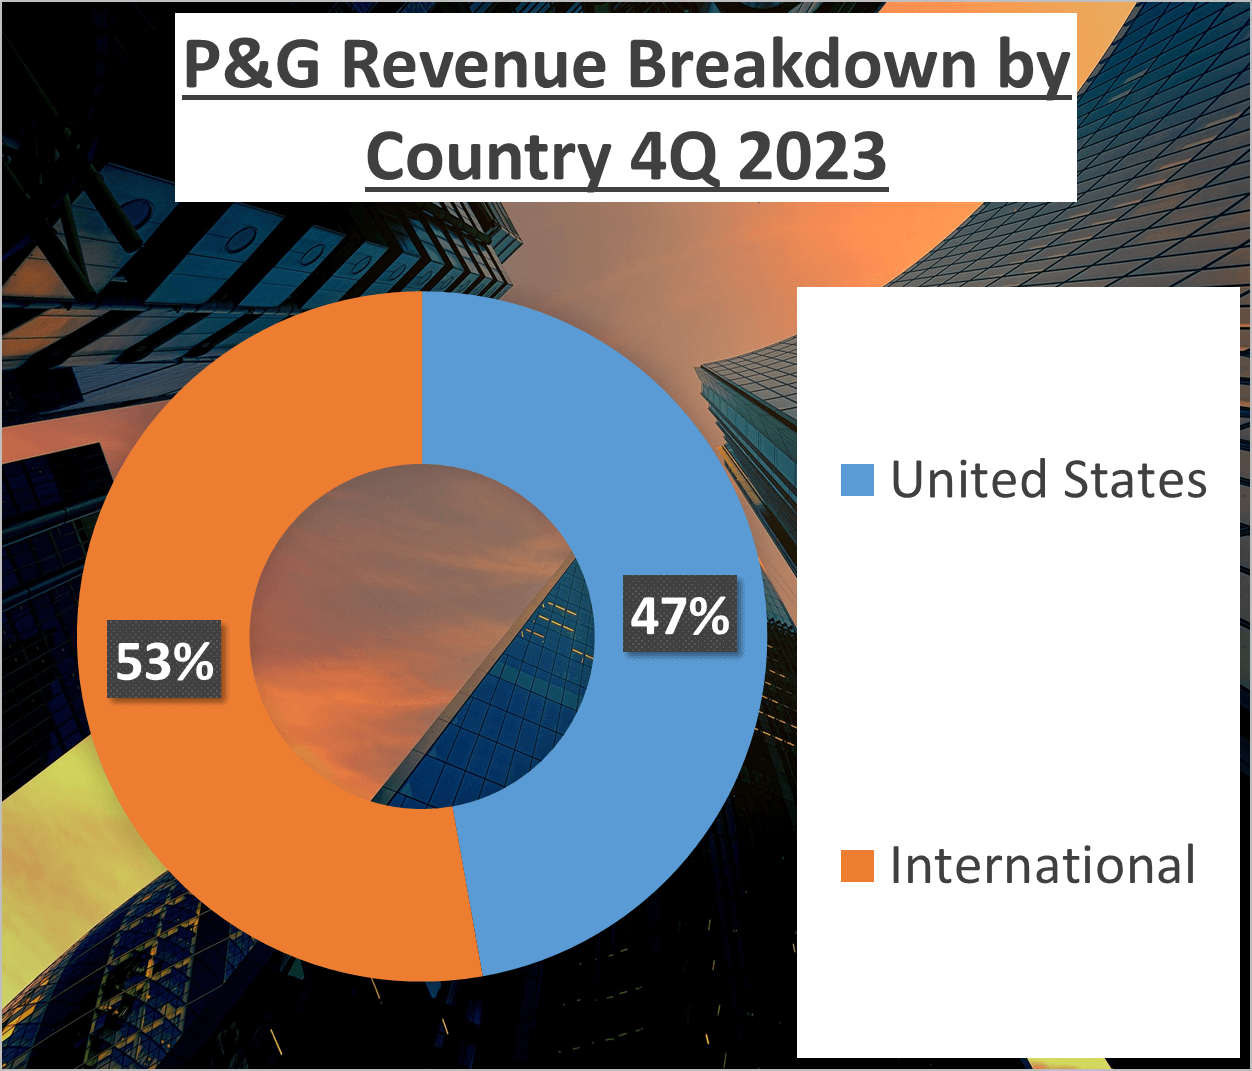
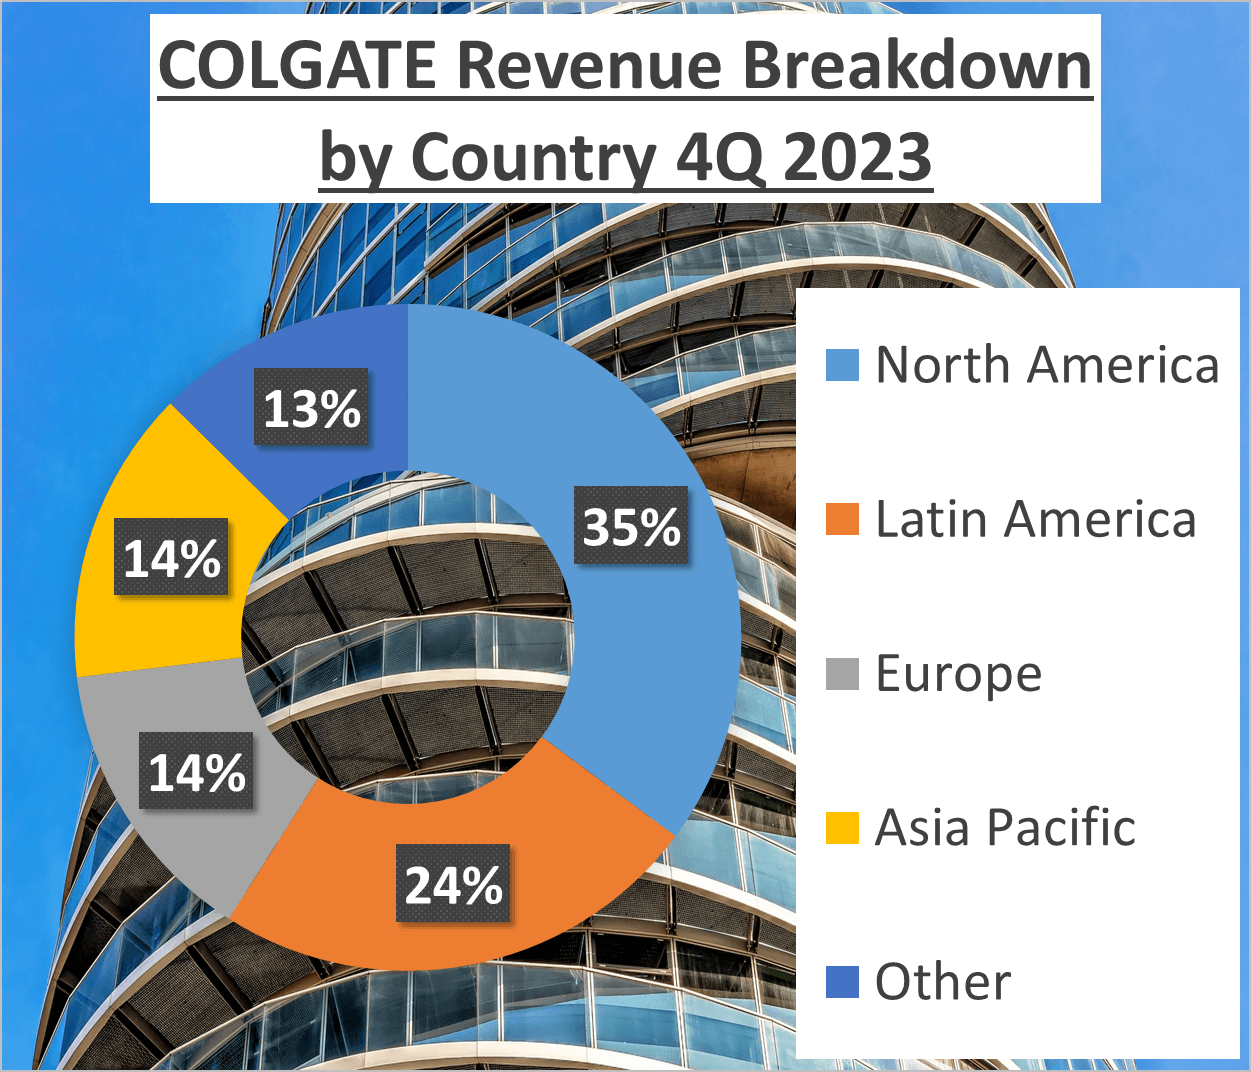
In terms of geographical revenue distribution, P&G’s revenue is almost evenly split, with 47% originating from the United States and the remaining 53% from international markets. In contrast, Colgate exhibits a more diverse revenue distribution, with 35% from North America, 24% from Latin America, 14% from Europe, 14% from Asia Pacific, and the remaining 13% from other regions.
While both companies boast robust revenue streams, they differ in growth rates and geographical distributions. P&G commands a larger total revenue with a balanced geographical distribution, whereas Colgate demonstrates a slightly higher growth rate and a more diversified revenue distribution.
This comparison sheds light on each company’s unique strengths and lays the groundwork for further analysis on profitability, investment returns, financial health, and operational efficiency.
Profitability Analysis – P&G vs Colgate Stock Analysis
Let’s delve into the profitability of P&G and Colgate.
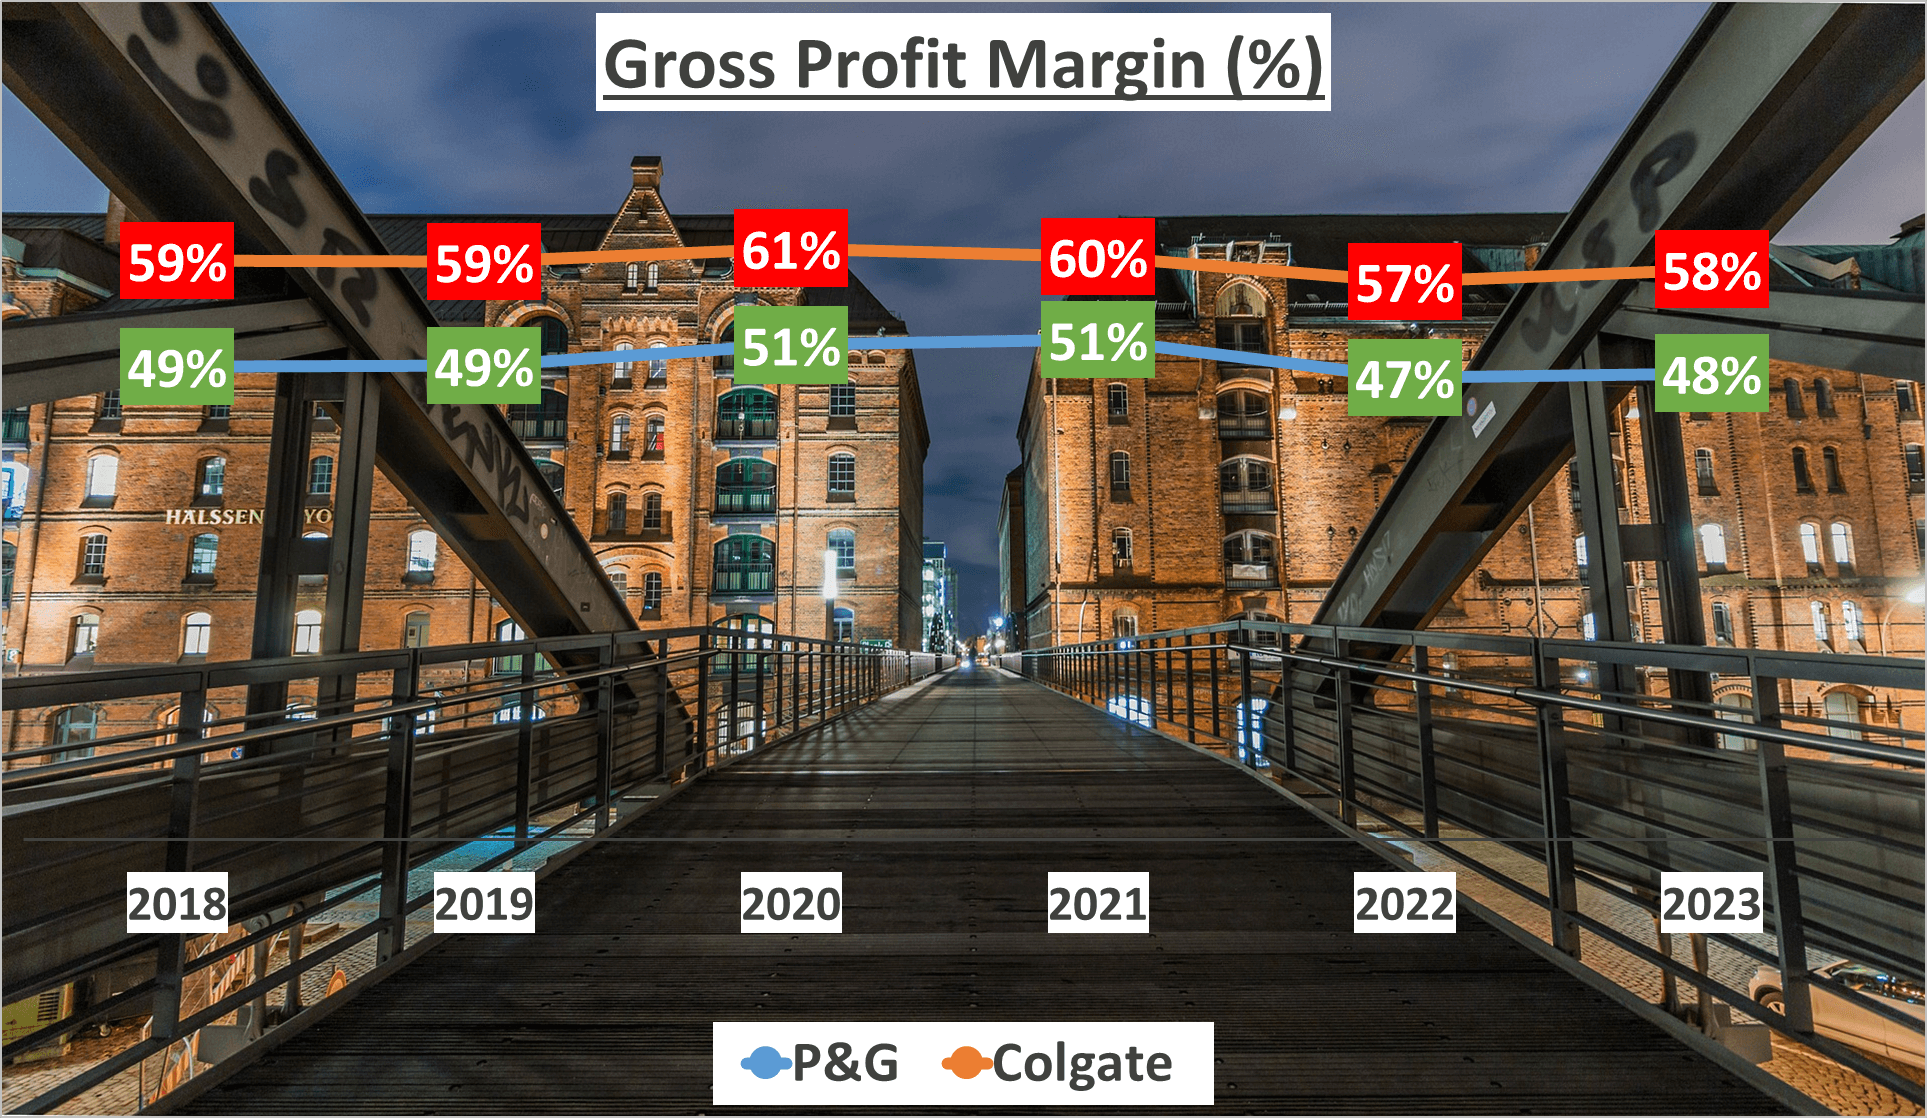
Firstly, let’s examine the gross profit margins. In 2023, P&G’s gross profit margin stood at 48%, whereas Colgate’s was notably higher at 58%. This variance suggests that Colgate demonstrated greater efficiency in converting raw materials into revenue.
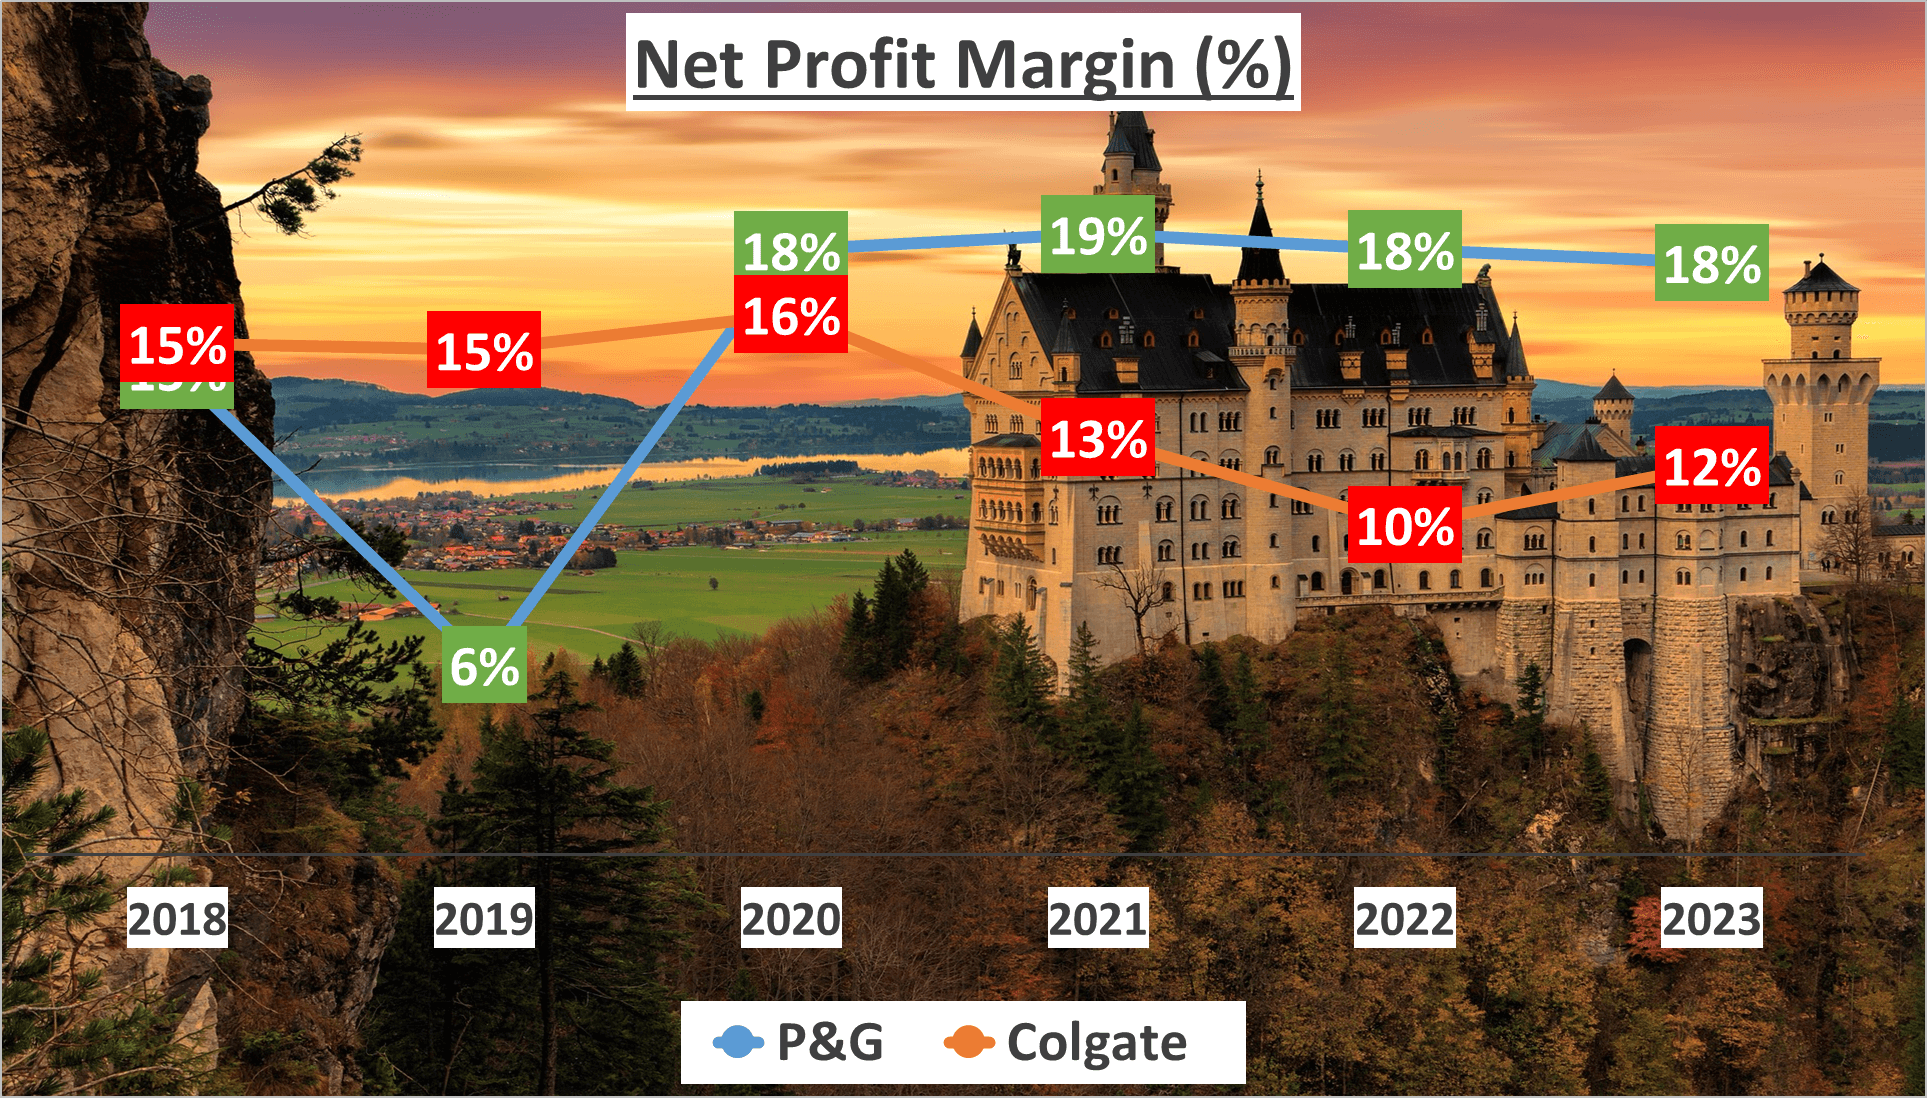
Moving on to net profit margins, P&G boasted a net profit margin of 18% in 2023, whereas Colgate’s net profit margin was 12%. This indicates that P&G was more adept at converting its revenues into actual profit after factoring in all expenses.
Now, let’s discuss net profits. In 2023, P&G’s net profit totaled $14.7B, while Colgate’s net profit amounted to $2.3B. These figures highlight P&G’s significantly higher profitability compared to Colgate for that year.
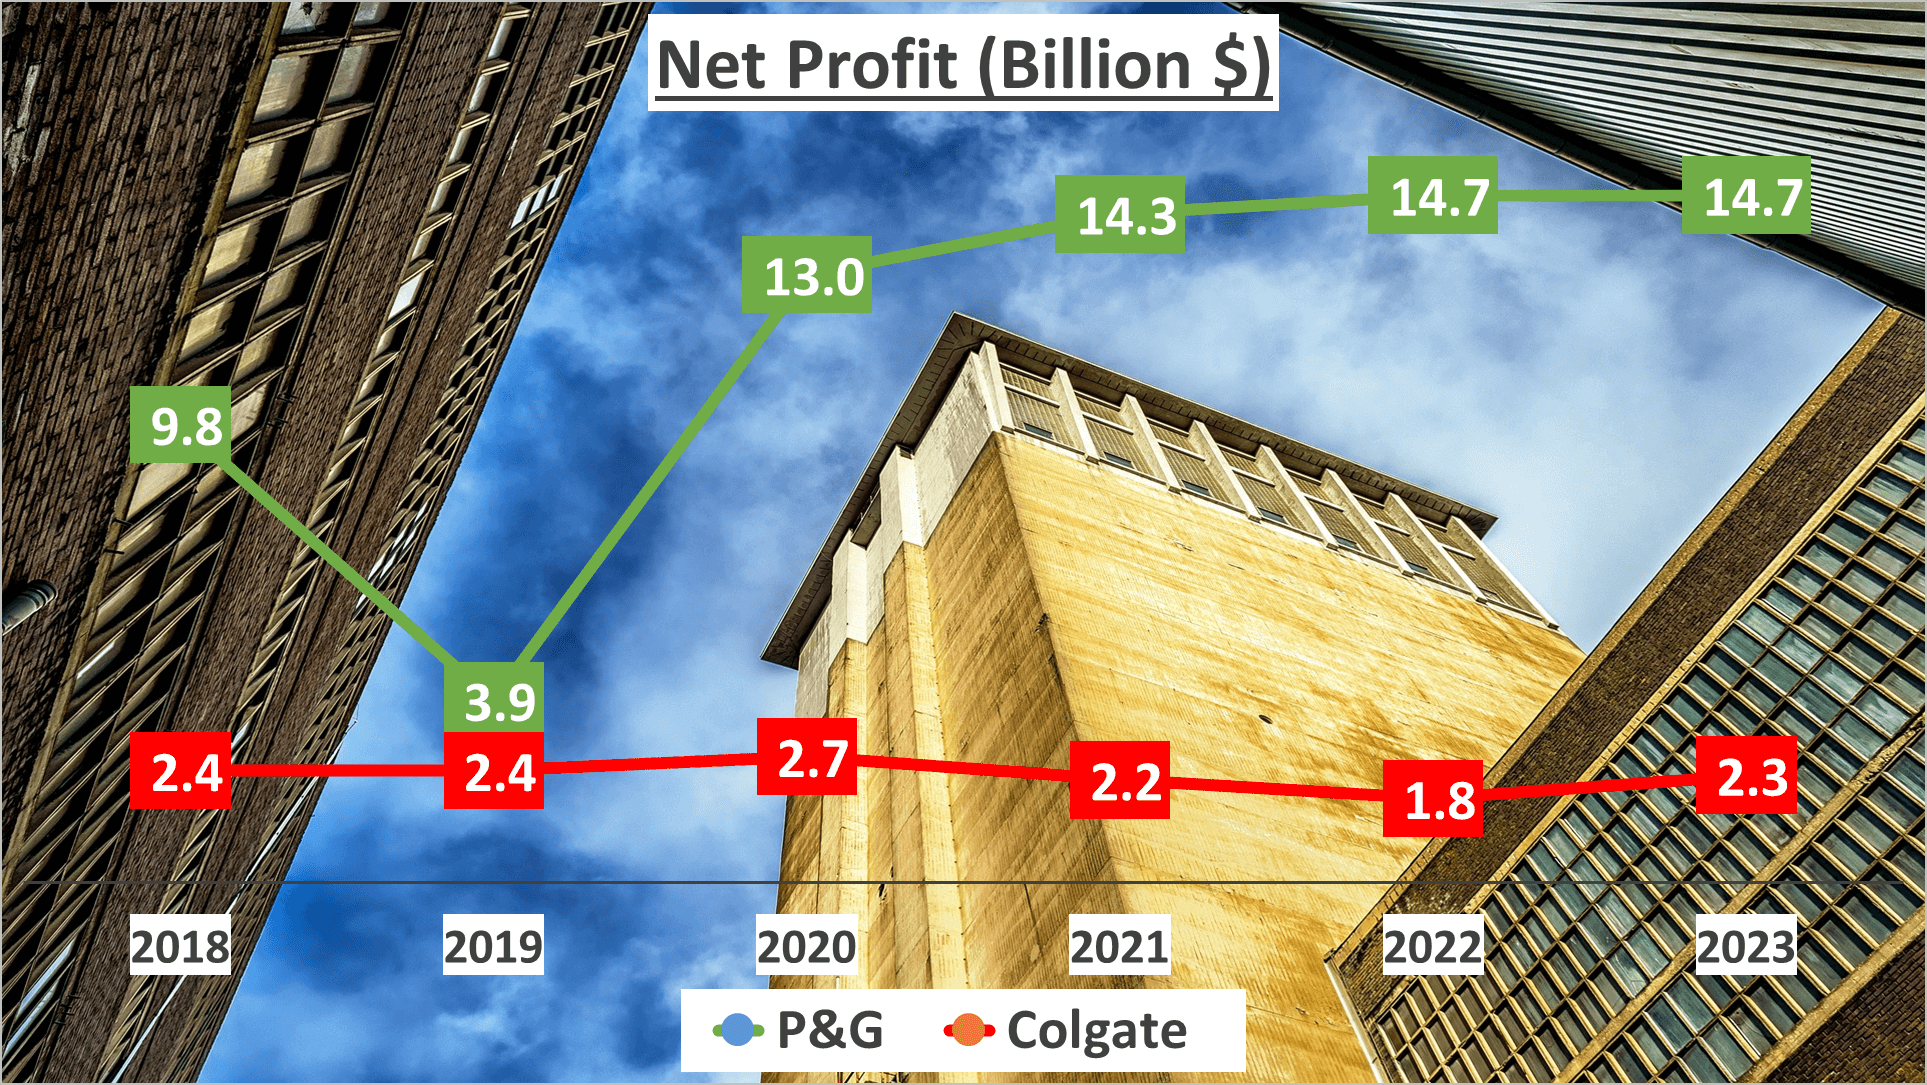
However, the narrative extends beyond mere figures. It’s crucial to consider the growth rates of these profits over the past five years. From 2018 to 2023, P&G’s net profit witnessed a compound annual growth rate of 8%, whereas Colgate experienced a decline in growth, with a compound annual growth rate of -1%. This signifies P&G’s superior ability to increase its profits over time.
In summary, although both companies are profitable, they demonstrate distinct profit margins and growth rates. P&G exhibits a lower gross profit margin but a higher net profit margin compared to Colgate. Additionally, P&G has consistently increased its net profit over the past five years, whereas Colgate’s net profit growth has faltered.
This analysis underscores the disparities in profitability between these two consumer goods giants. It underscores the notion that profitability isn’t solely about the bottom line, but also about a company’s efficacy in generating and sustaining profit growth over time.
While both companies are profitable, they showcase varying profit margins and growth trajectories.
Investment Returns – P&G vs Colgate Stock Analysis
Let’s now assess the investment performance of P&G and Colgate over the past five years. Imagine you invested $1,000 in each of these companies in 2018.

By February 2024, your investment in P&G would have grown to $1,714, representing a 71% increase from the initial investment, equivalent to an annual return of 11%.
In contrast, if you had invested the same amount in Colgate, your investment would now be valued at $1,403. This marks a 40% increase from the initial investment, corresponding to an annual return of 7%.
These figures underscore the overall growth of the companies and their ability to generate profits over the specified period.
Both companies have delivered satisfactory returns to their shareholders, albeit with varying rates of return.
Financial Health – P&G vs Colgate Stock Analysis
Let’s delve into the financial health of P&G and Colgate.
Beginning with total assets, P&G closed 2023 with $121B, whereas Colgate’s total assets amounted to $16B. Net assets, calculated as total assets minus total liabilities, reached $47B for P&G and $1B for Colgate.
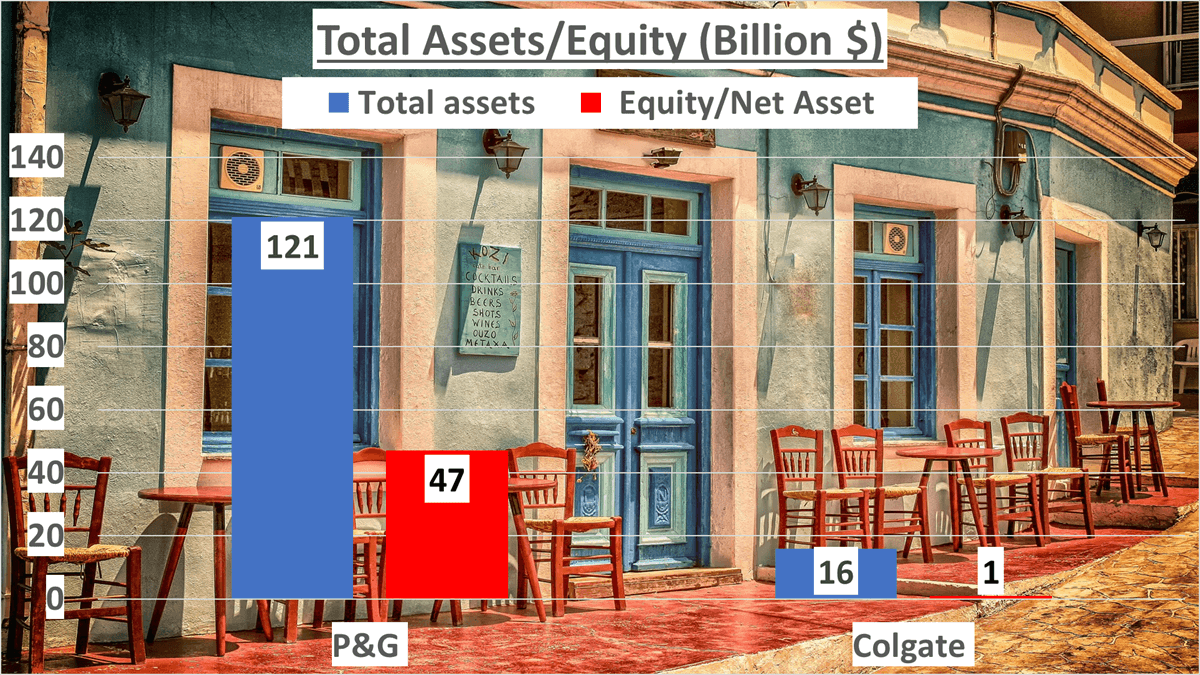
Moving on to equity to total assets, a measure of a company’s net worth, P&G exhibited an equity to total assets ratio of 39%, indicating a substantial portion of its assets were financed by shareholders’ equity. Conversely, Colgate’s equity to total assets ratio stood at 6%, implying a larger reliance on debt financing for its assets.
Regarding current ratios, gauging a company’s ability to meet short-term obligations, P&G recorded a current ratio of 0.63, while Colgate boasted a higher ratio of 1.11. This suggests Colgate’s superior capability to settle short-term liabilities with its short-term assets.
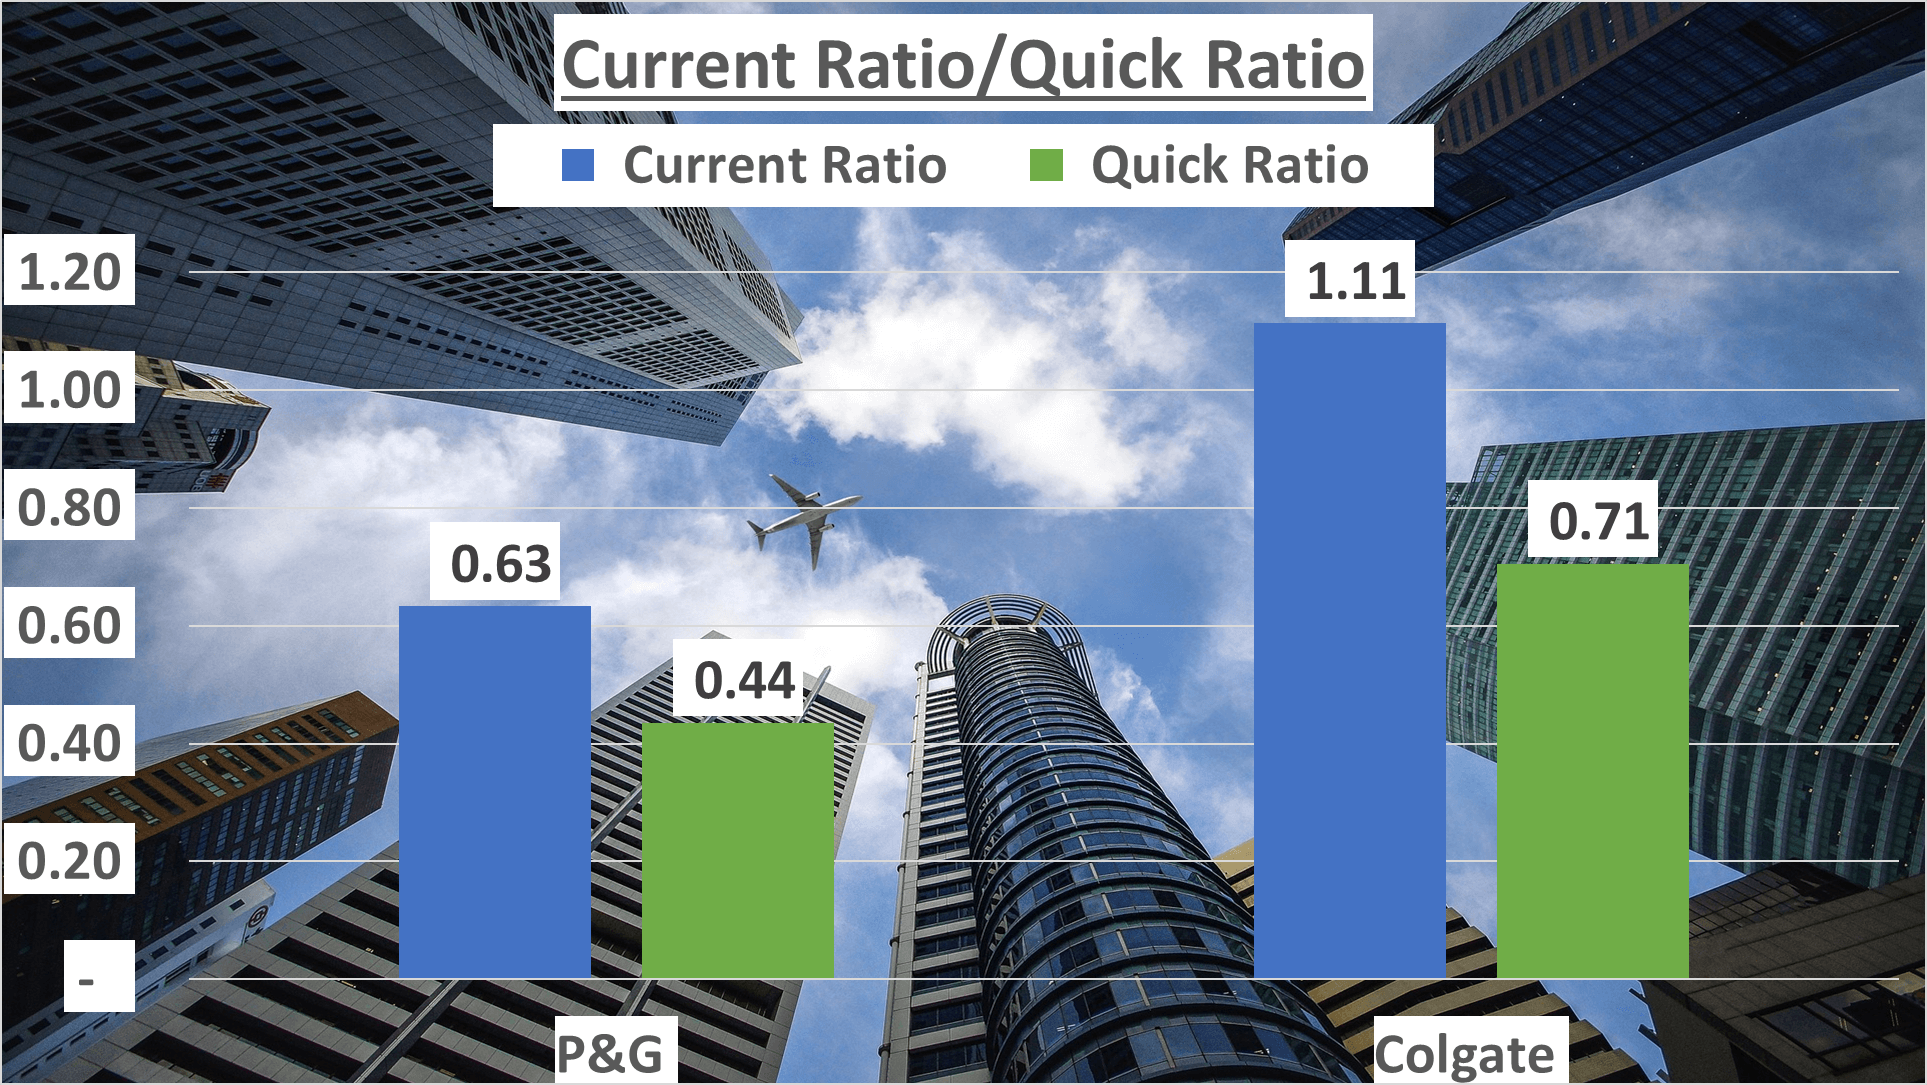
Furthermore, in terms of quick ratios, excluding inventory from current assets, P&G registered 0.44, whereas Colgate marked 0.71. This signifies Colgate’s stronger liquidity position, with a higher proportion of liquid assets to cover current liabilities, even without inventory sales, compared to P&G.
In summary, both P&G and Colgate exhibited robust financial health in 2023. However, P&G showcased higher total and net assets, alongside a greater proportion of assets financed by equity. Conversely, Colgate demonstrated higher liquidity, as evidenced by its current and quick ratios, and a larger reliance on debt financing for its assets.
Both companies manifest strong financial health, albeit with differing levels of liquidity and leverage.
Operational Efficiency – P&G vs Colgate Stock Analysis
Finally, let’s assess the operational efficiency of P&G and Colgate. In 2023, P&G’s inventory turnover stood at 60 days, indicating that goods remained in inventory for an average of 60 days before being sold. Conversely, Colgate’s inventory turnover was notably higher at 90 days.
This underscores P&G’s superior inventory management, as it sells its products faster than Colgate.
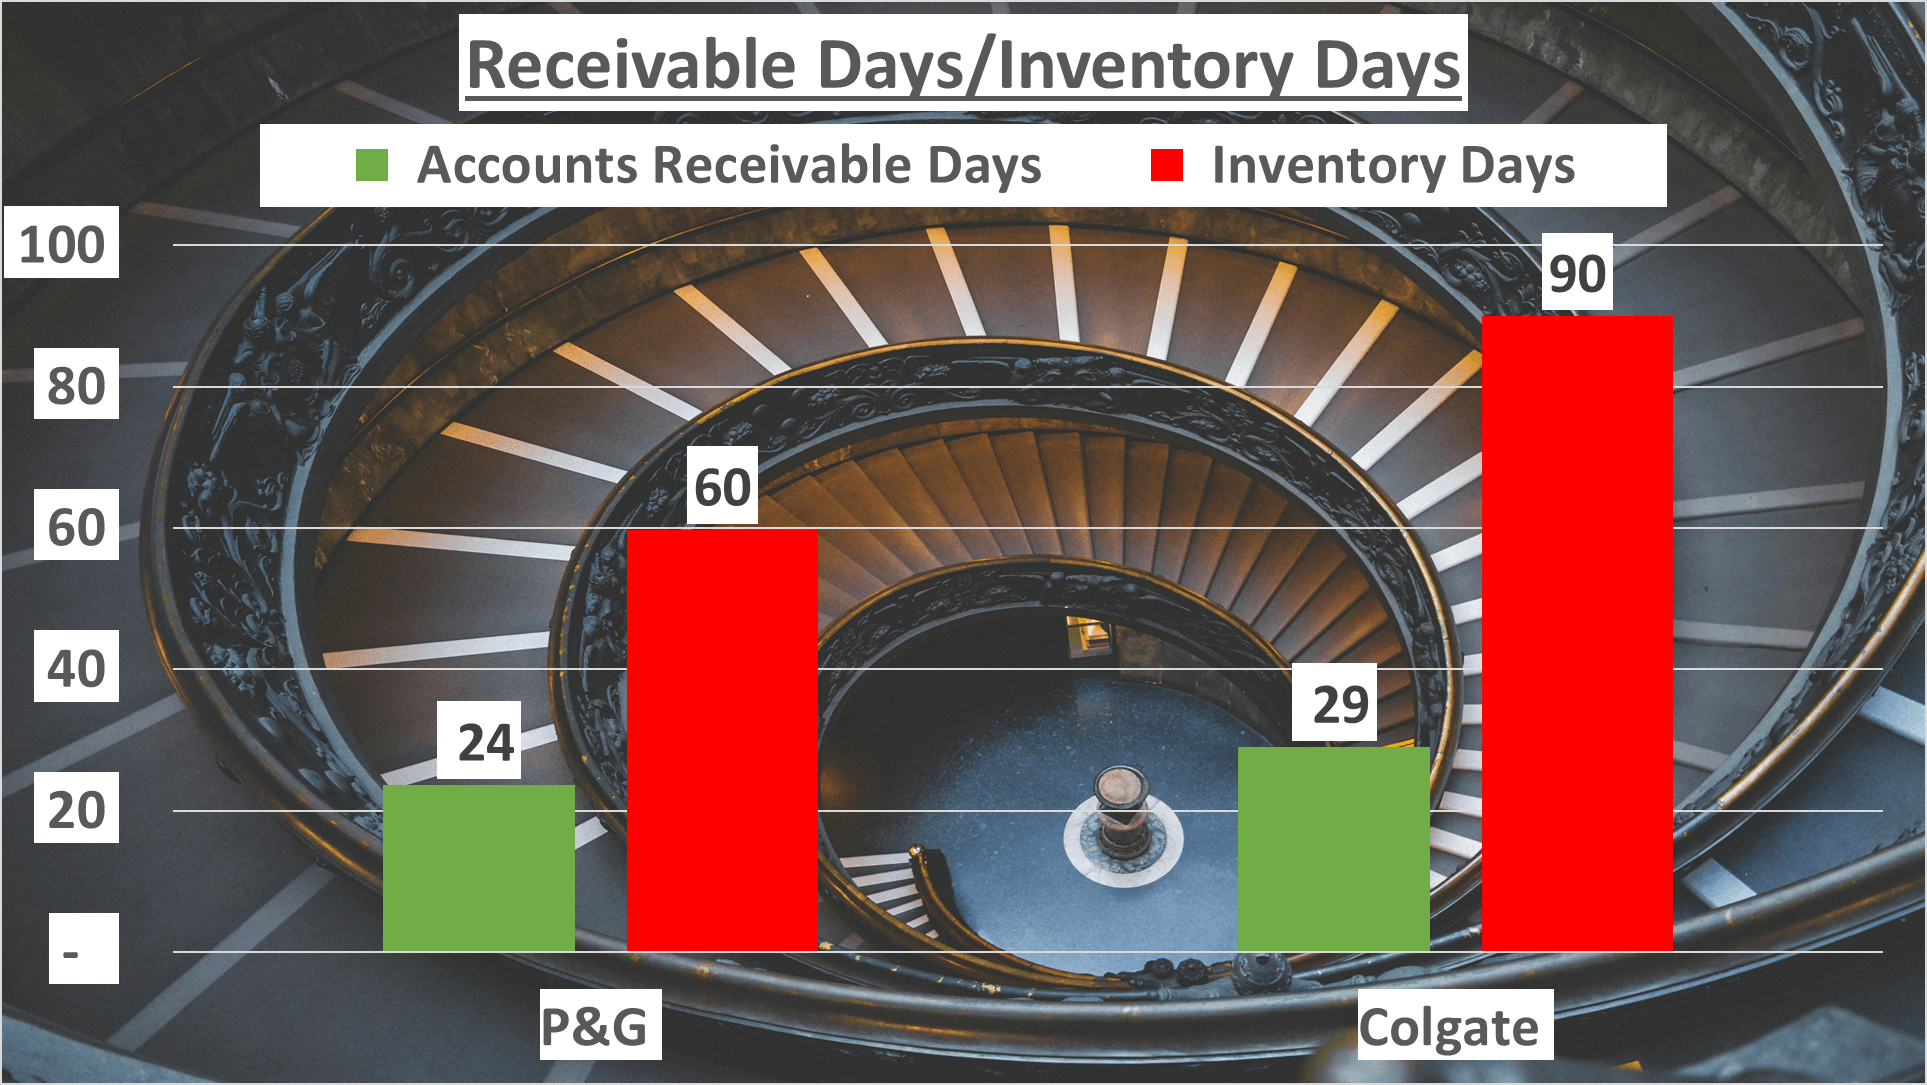
Moving on to receivable days, P&G recorded 24 days, while Colgate reported slightly more at 29 days. This implies that P&G is more efficient at collecting payments from its customers.
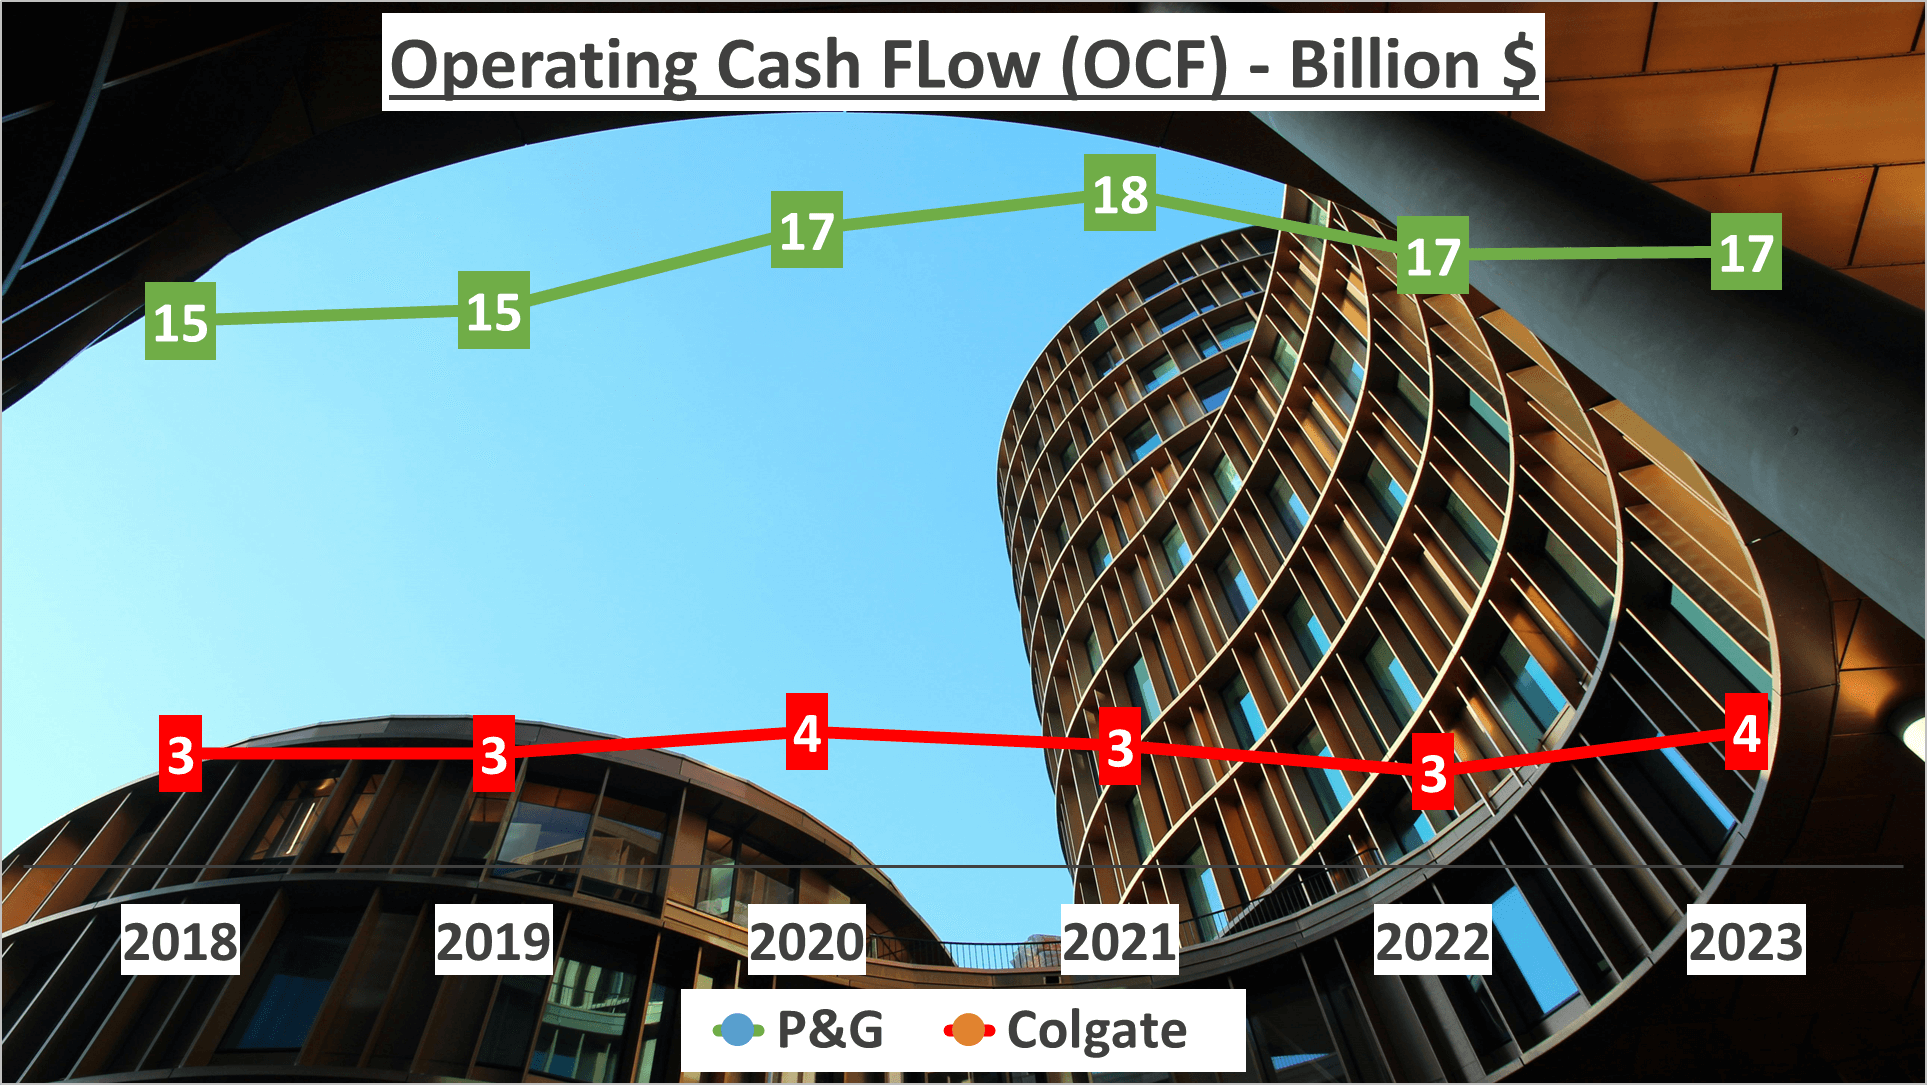
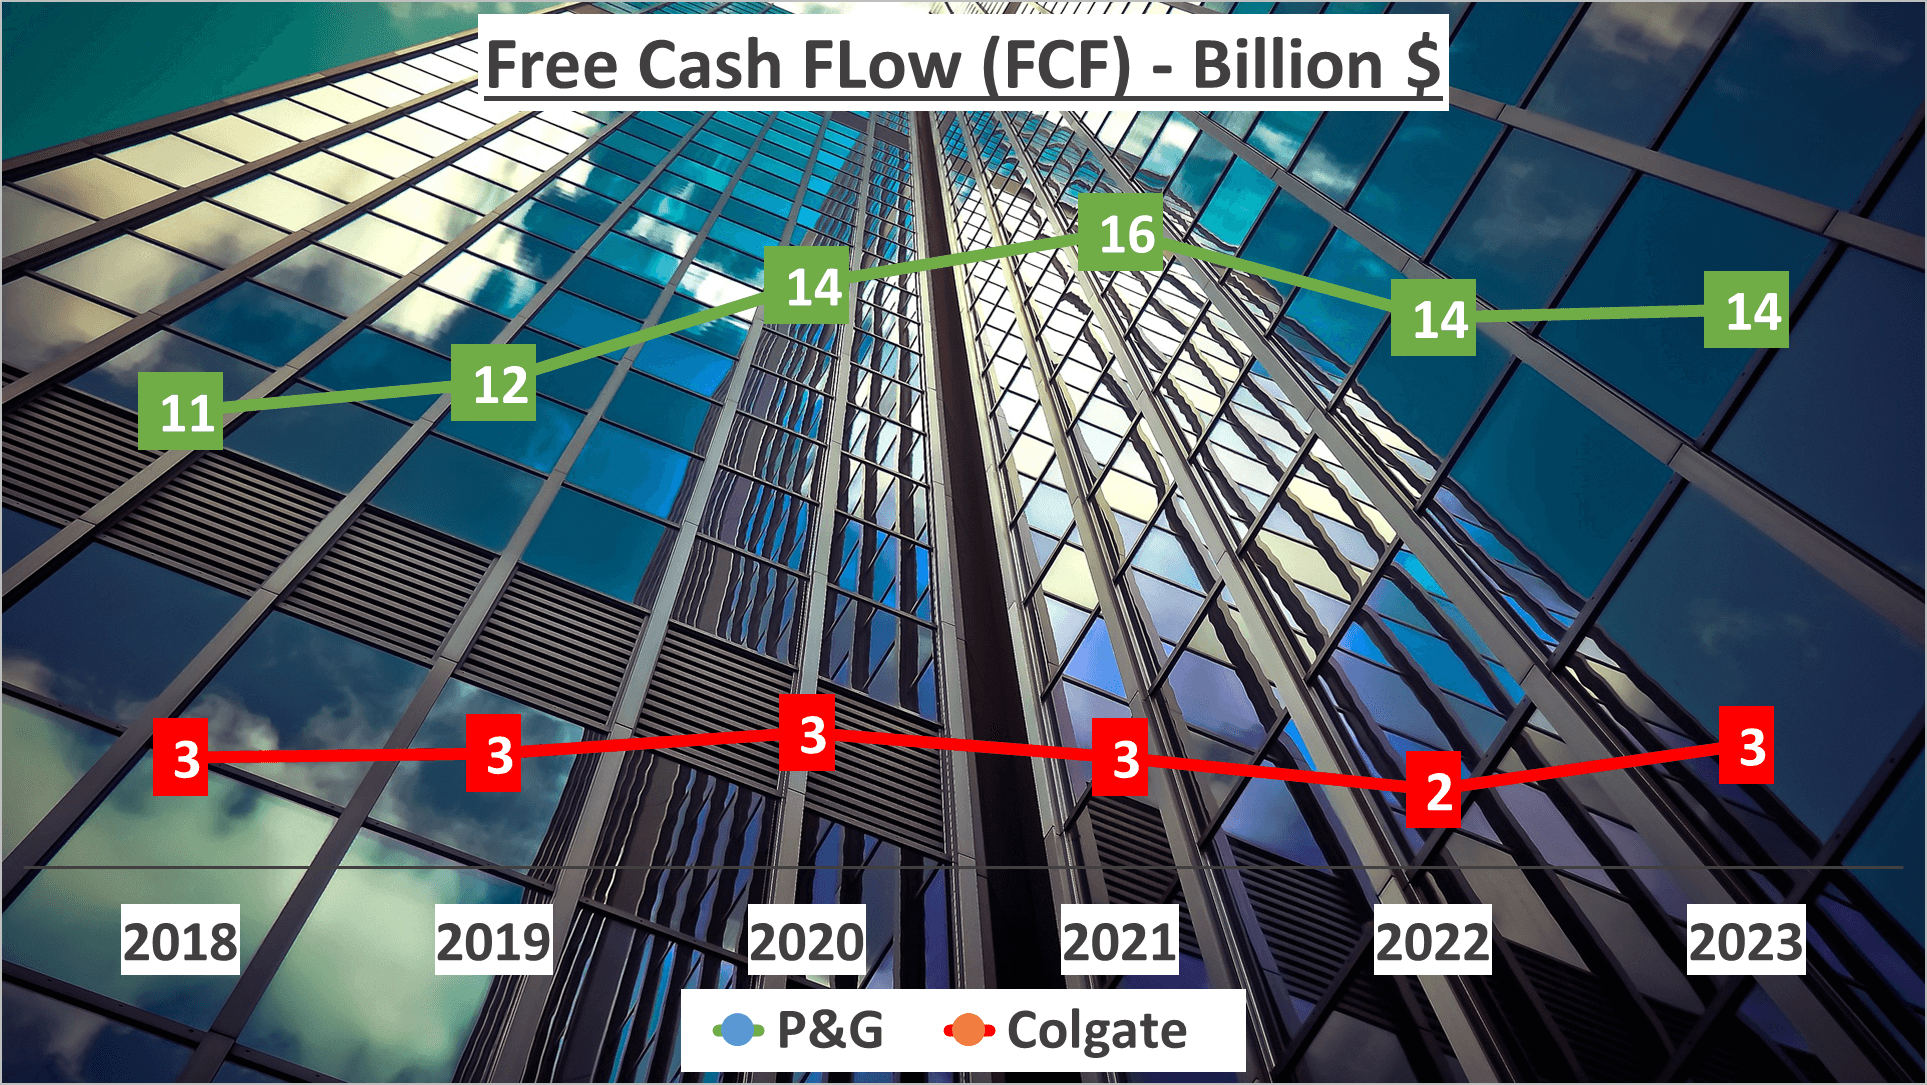
Now, analyzing the cash flow, P&G generated $17B from operating activities, with a free cash flow of $14B. On the other hand, Colgate, albeit smaller, generated $4B in operating cash flow and $3B in free cash flow.
The Operating Cash Flow to Net Income ratio, a pivotal indicator of cash generation efficiency, was 1.1 for P&G and 1.6 for Colgate.
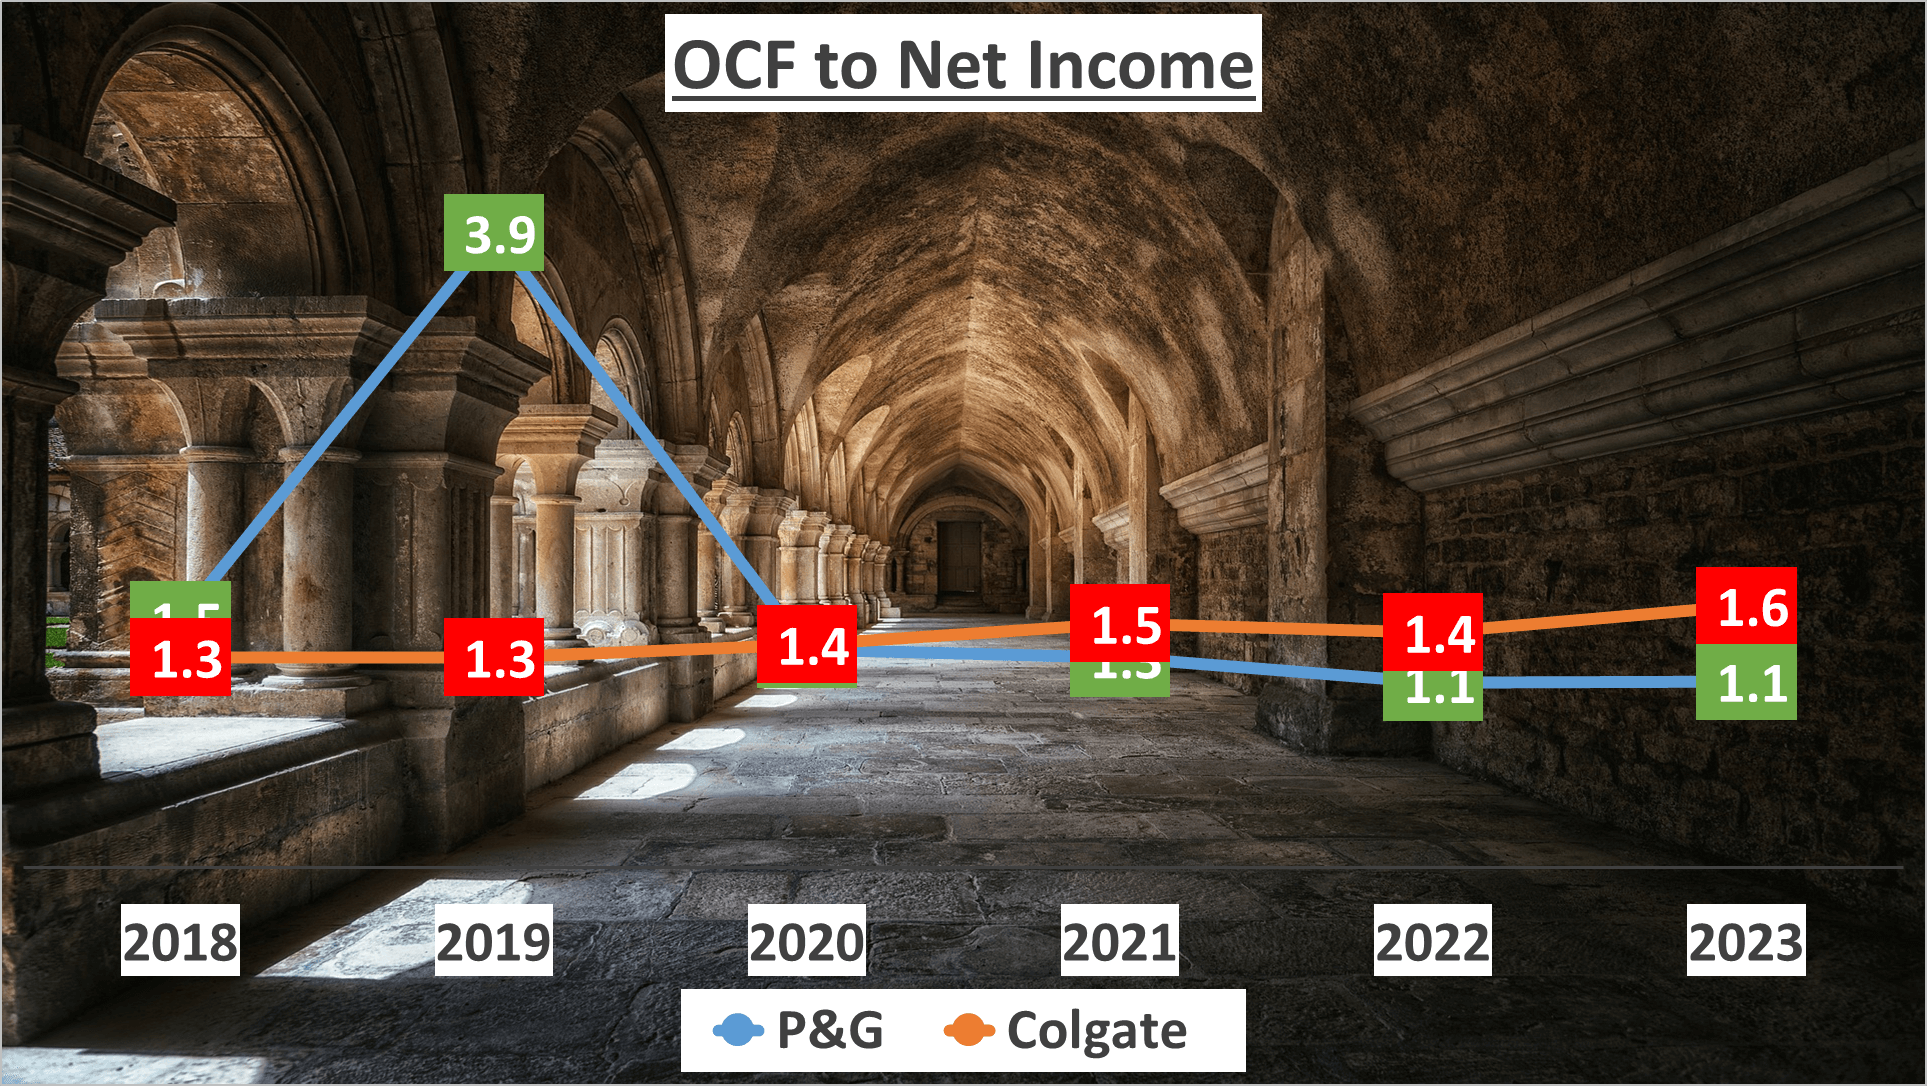
In summary, both companies exhibit robust operational efficiencies, albeit with differing levels of inventory management and cash flow generation.
Conclusion – P&G vs Colgate Stock Analysis
In summary, both P&G and Colgate exhibit strong financial performances, each with its own strengths. P&G demonstrates a diverse revenue structure and a substantial net profit of nearly $15B in 2023. Conversely, Colgate stands out with an impressive gross profit margin of 58% and a robust investment return rate of 40% since 2018.
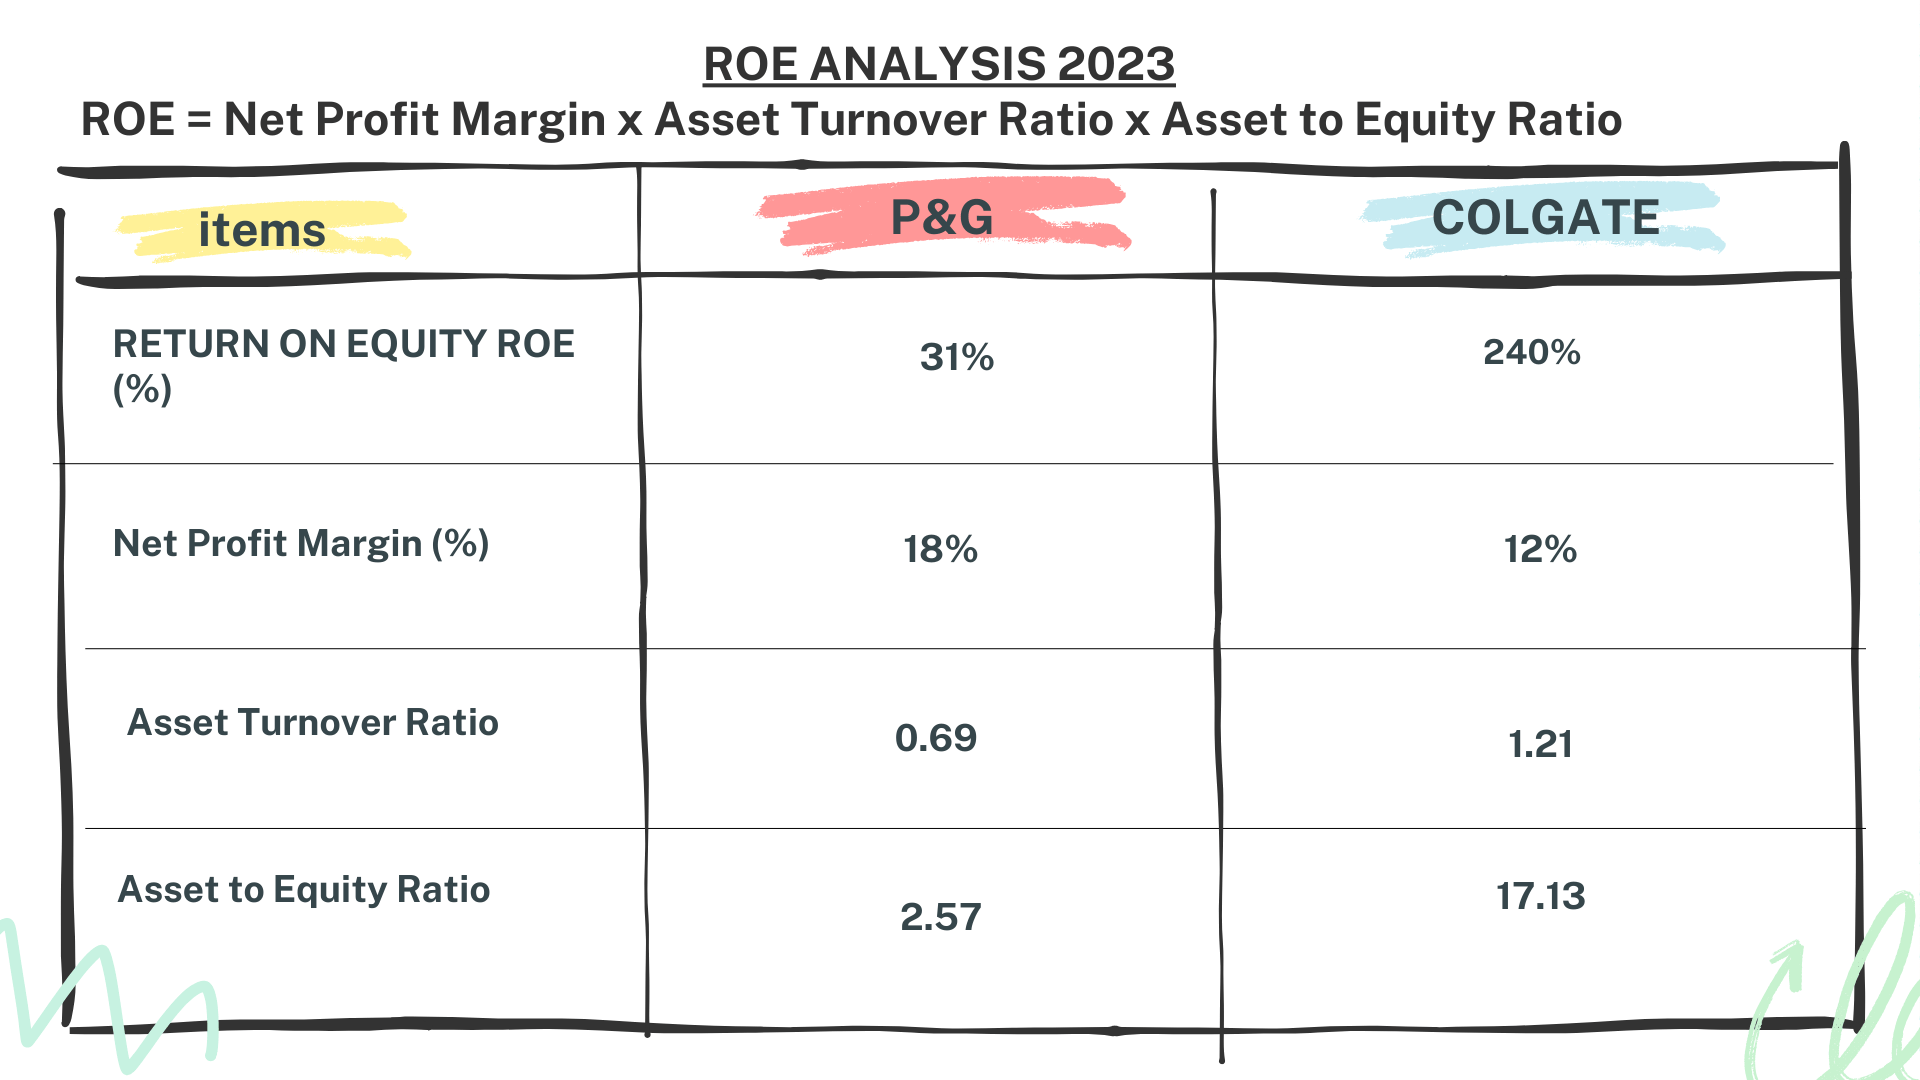
P&G’s equity to total assets ratio of 39% signifies a healthier financial position compared to Colgate’s 6%. However, Colgate surpasses P&G in terms of liquidity, boasting a current ratio of 1.11.
Regarding operational efficiency, P&G maintains tighter inventory and receivable days compared to Colgate. While P&G has a higher operating cash flow, Colgate’s operating cash flow to net income ratio is noteworthy.
These insights should serve as a valuable guide for potential investors. Thank you for watching. Don’t forget to subscribe to our channel for more financial analysis videos. Please comment below which company you would like us to analyze next.
Author: investforcus.com
Follow us on Youtube: The Investors Community
