SoundHound Stock Analysis – Have you ever wondered what your $1000 investment in SoundHound back in 2022 would be valued at now, in March 2024?
If so, you’re certainly not alone. A multitude of investors are eager to track the progress of their investments, particularly in innovative companies such as SoundHound.
However, it’s not merely about crunching numbers; it’s about comprehending the underlying catalysts driving this growth.
So, fasten your seatbelts and get ready as we delve into a comprehensive financial and business analysis of SoundHound.
Let’s unravel the key factors contributing to its remarkable expansion.
Revenue Analysis – SoundHound Stock Analysis
Let’s begin our examination with SoundHound’s revenue. The company experienced significant growth from 2021 to 2023. In 2021, revenue was relatively modest, but by 2023, it had more than doubled, reaching $45.9 million.
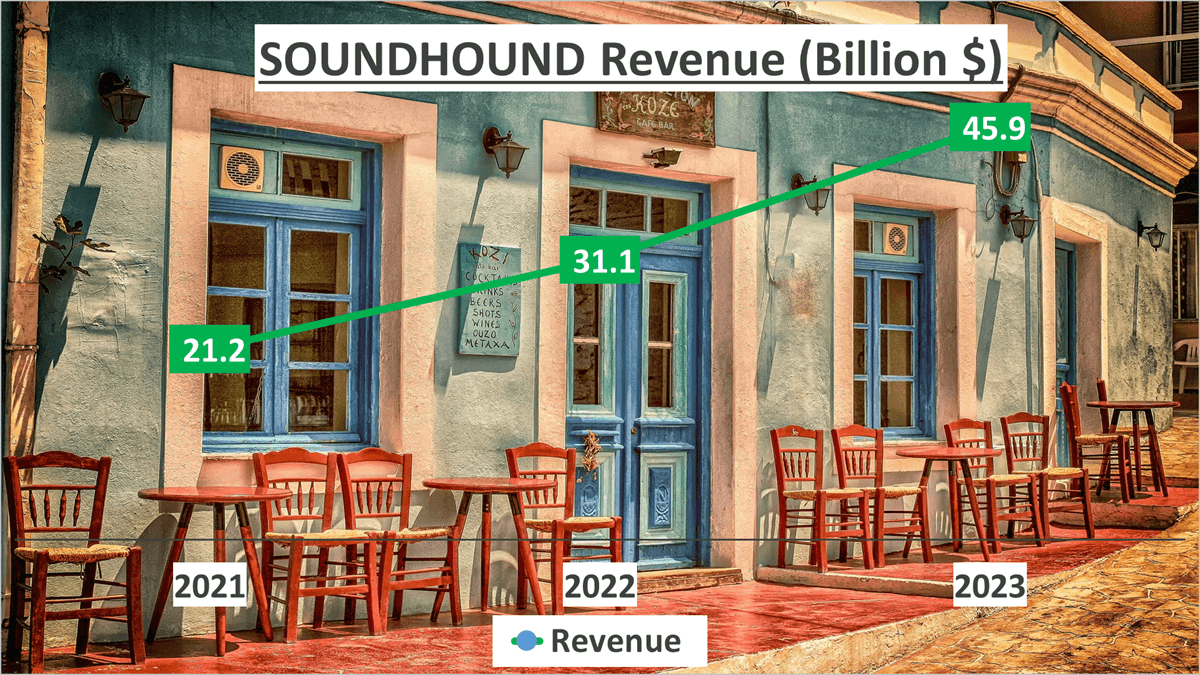
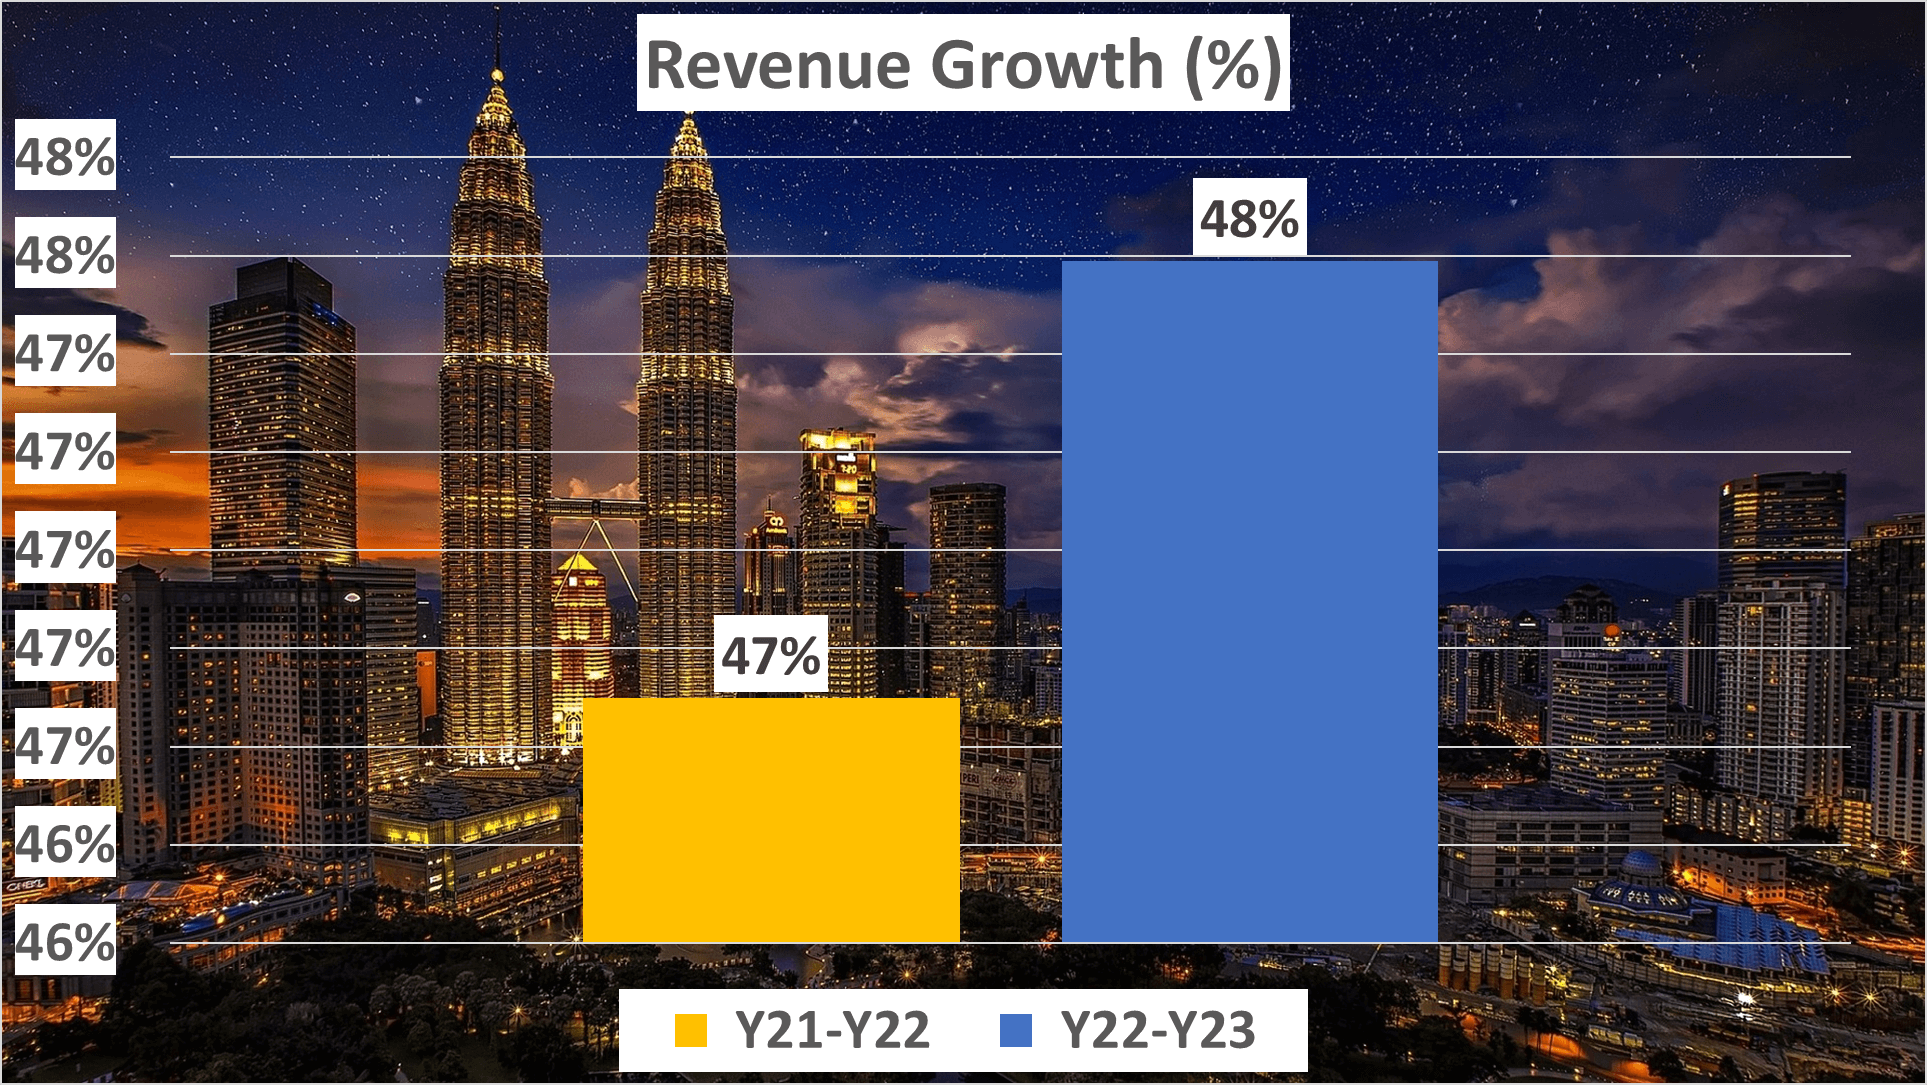
This equates to a year-on-year growth of 47% from 2021 to 2022, and an impressive 48% from 2022 to 2023.
But where does this revenue originate from?
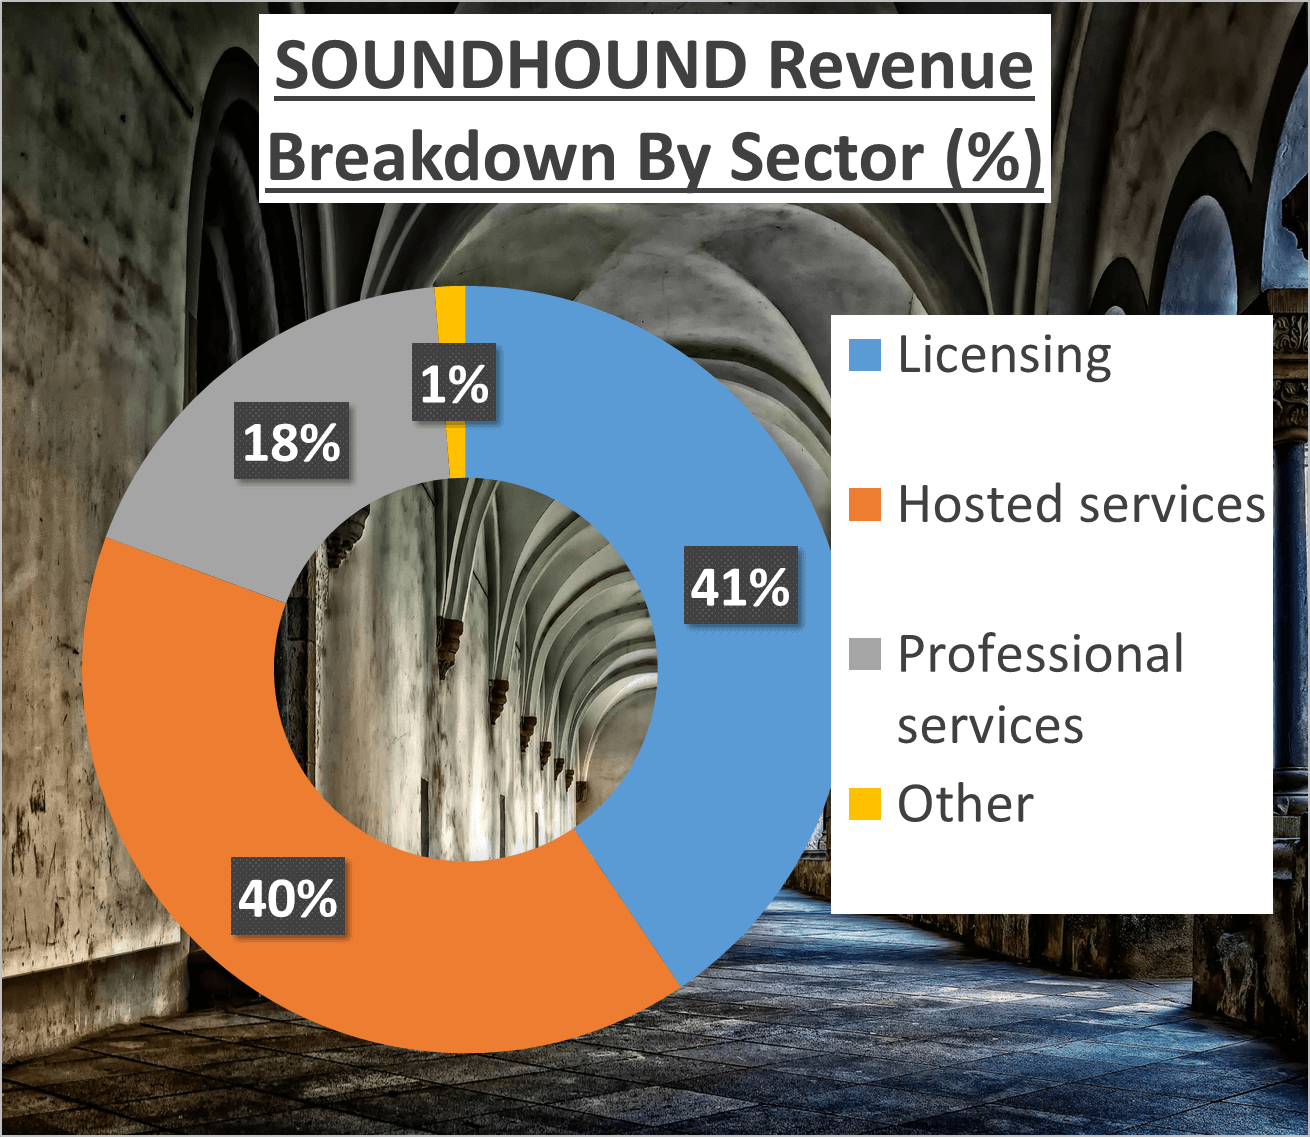
41% of it stems from Licensing, closely followed by Hosted Services, comprising 40%. Professional Services contribute 18%, with the remaining 1% classified as ‘Other’.
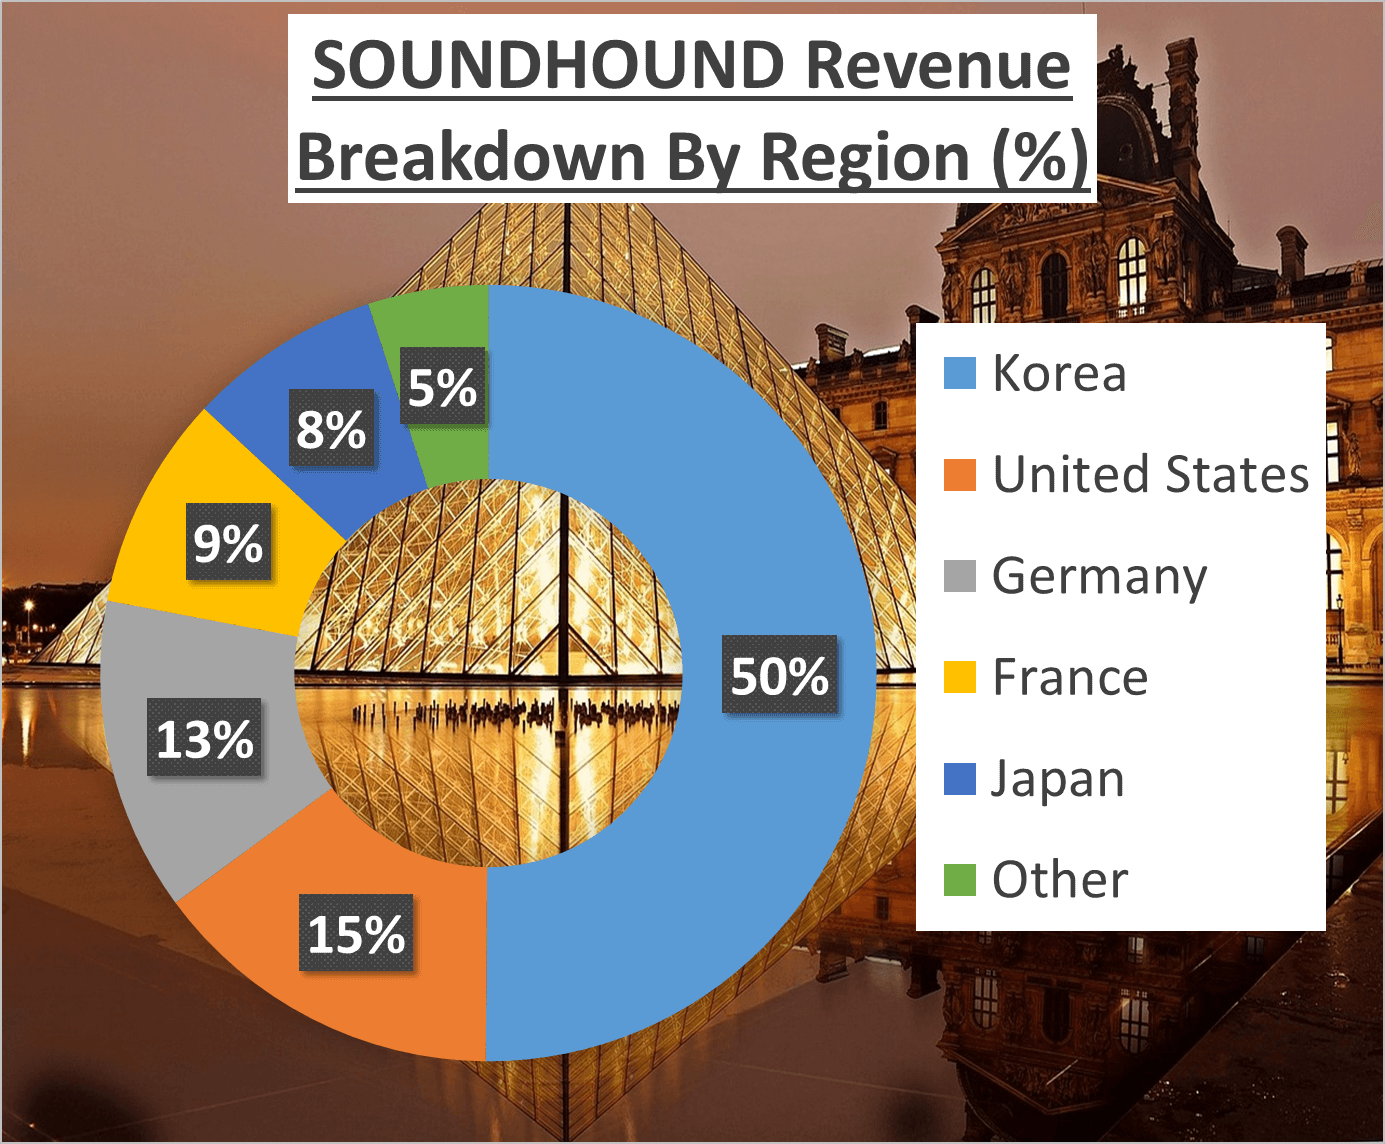
Now, let’s consider the geographical breakdown of revenue. Korea accounts for half of SoundHound’s revenue, followed by 15% from the United States, 13% from Germany, 9% from France, 8% from Japan, and the remaining 5% from other regions around the globe.
It’s evident that SoundHound boasts a diverse revenue stream, both in terms of service offerings and geographical distribution. This diversity serves as a strength, reducing the company’s reliance on any single source of income or market, thereby enhancing its resilience to market fluctuations.
Indeed, the growth is impressive. But how does this translate into profit?
Profit Margin Analysis – SoundHound Stock Analysis
Let’s now delve into SoundHound’s profit margins. SoundHound’s Gross Profit Margin for 2023 stood at 75%, a robust figure indeed. However, the Net Profit Margin paints a different picture, coming in at a staggering -200%.
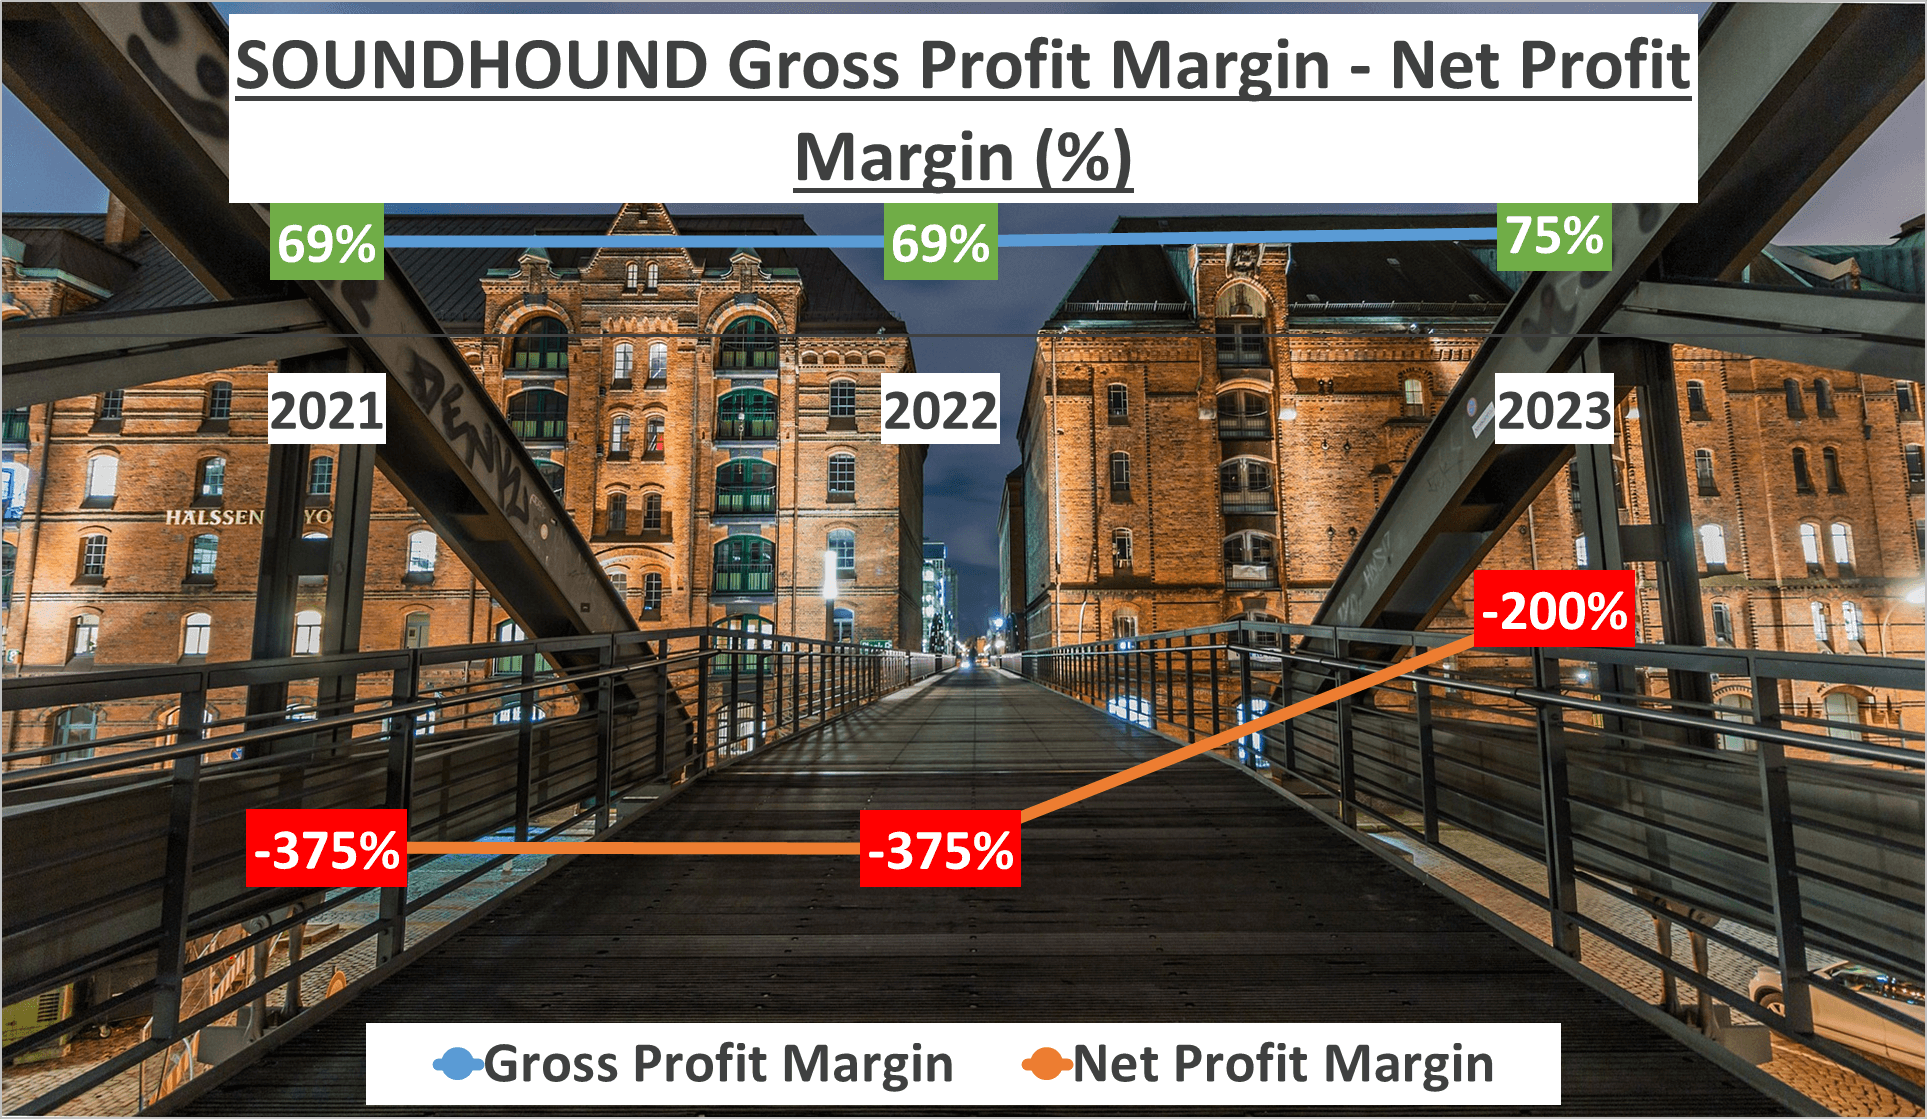
You might wonder, why such a negative Net Profit Margin? This discrepancy primarily stems from SoundHound’s substantial investments in Research and Development (R&D), and Sales, General, and Administrative (SG&A) expenses. In 2023, R&D expenses amounted to 112% of revenue, while SG&A expenses constituted 103%. Essentially, these two expenses alone surpassed the revenue SoundHound generated.
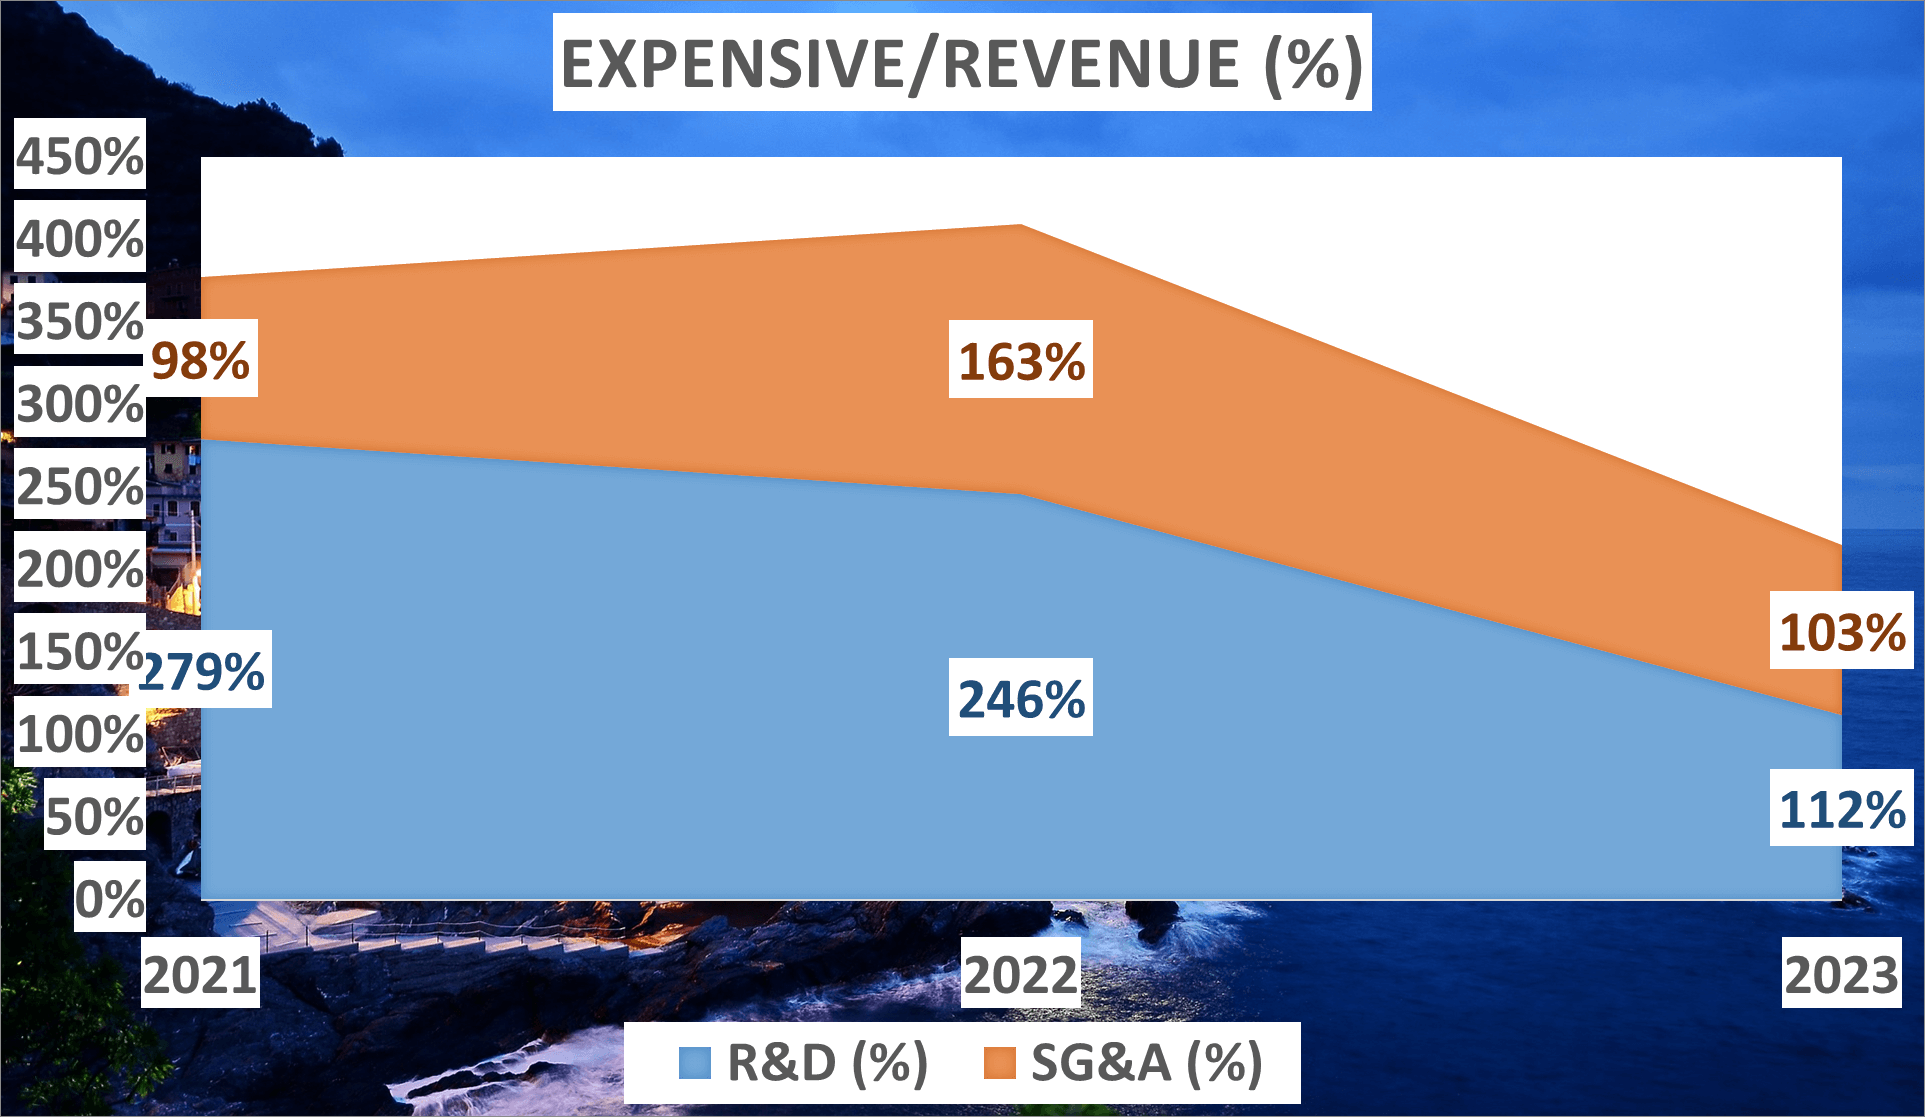
Nevertheless, there’s a glimmer of hope amidst this situation. Between 2021 and 2023, there’s a noticeable downward trend in the proportion of R&D and SG&A expenses, which is a positive signal. If SoundHound continues to streamline these expenditures, we may witness the Net Profit Margin moving into positive territory in the near future.
Despite the negative Net Profit Margin, SoundHound’s net loss in 2023 was $92 million, showing a decrease from the previous year’s loss of $117 million. This reduction in loss, along with the declining trend in expenses, indicates that SoundHound is making strides towards profitability.

While SoundHound’s high R&D and SG&A expenses are a concern, the signs of improvement are encouraging.
Assets and Liabilities – SoundHound Stock Analysis
Let’s proceed with an examination of SoundHound’s assets and liabilities. Understanding the financial health of the company entails grasping the significance of these components. Assets encompass everything the company owns with value, whereas liabilities represent its obligations.
The disparity between the two furnishes us with net assets, essentially the company’s equity. In 2023, SoundHound boasted total assets amounting to an impressive $151 million, marking a substantial increase from the $38 million reported in 2022.
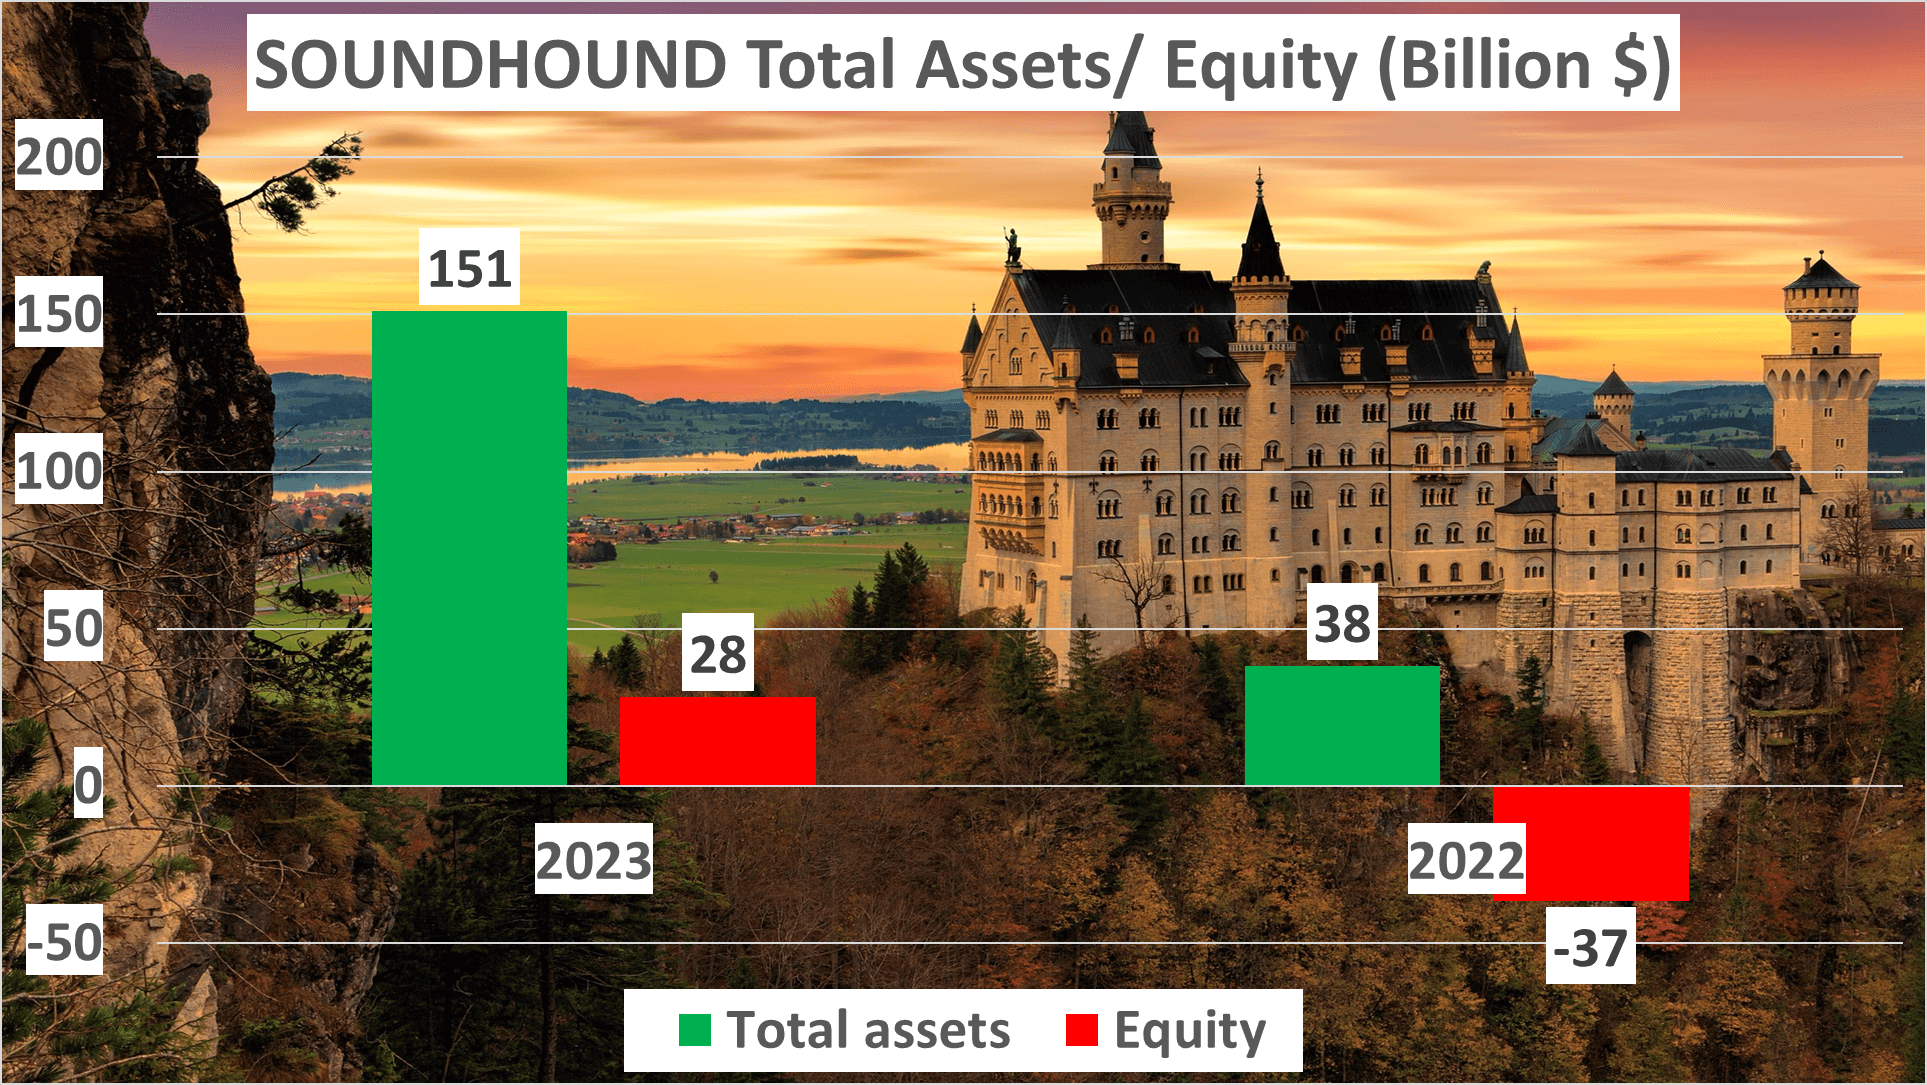
Conversely, on the opposite side of the balance sheet, we observe net assets of $28 million in 2023, a favorable turnaround from the negative $37 million in 2022. An essential metric to gauge is the Equity to Total Assets ratio, offering a quick overview of the company’s financial structure.
In 2023, this ratio stood at 19%, a significant improvement from the -96% in 2022. But let’s delve deeper. The Current Ratio is another vital metric, indicating whether a company possesses sufficient resources to settle its debts over the next twelve months.
A higher value typically signifies financial strength. In 2023, SoundHound’s Current Ratio stood at a robust 4.69, a substantial enhancement from the 0.46 in 2022, primarily attributable to increased capital infusion.
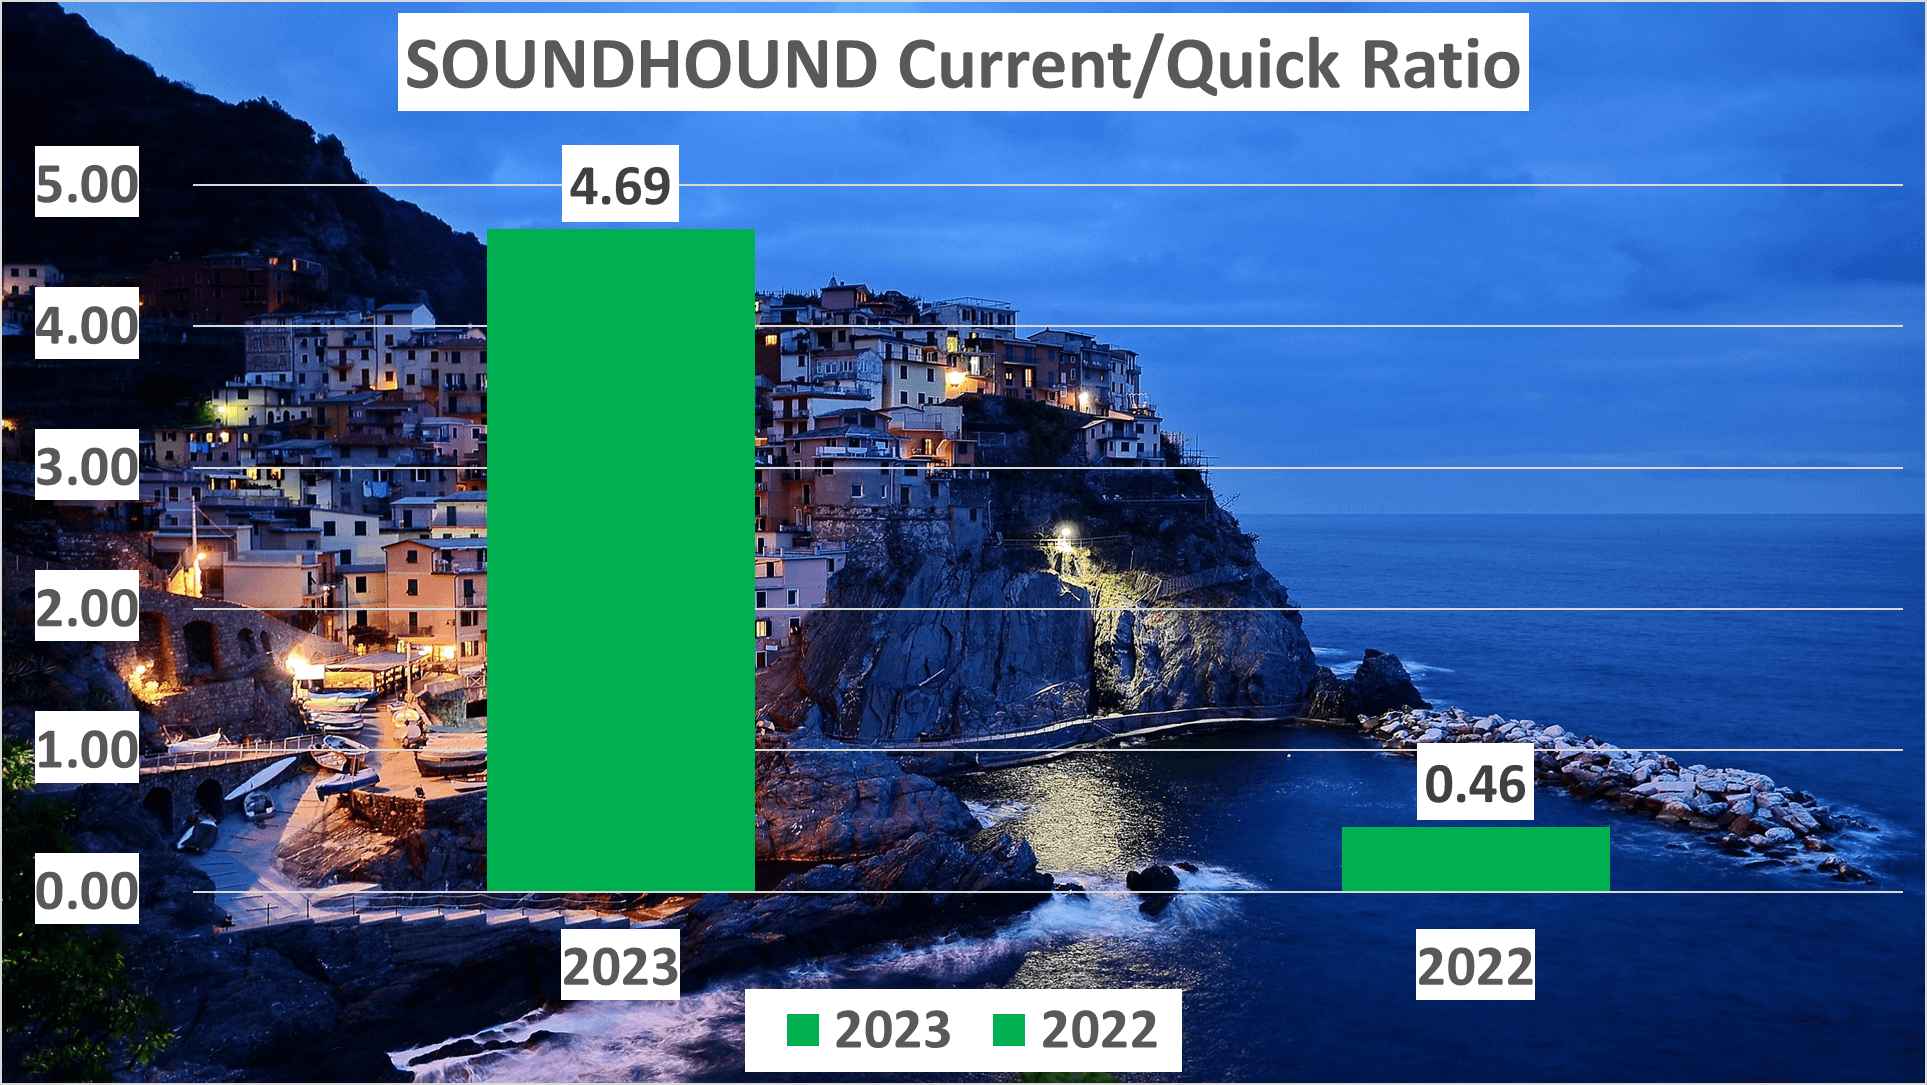
So, what do these findings imply? The surge in total assets, positive net assets, and enhanced ratios indicate an upward trajectory in SoundHound’s financial health.
However, while assets and liabilities provide insight into a company’s financial standing, they constitute only a portion of the narrative. SoundHound’s improved financial health is notable, but what about its cash flow?
Cash Flow Analysis – SoundHound Stock Analysis
Now, let’s shift our focus to SoundHound’s cash flow, a crucial aspect of any financial evaluation. Cash flow offers a transparent view of a company’s financial well-being by illustrating the movement of funds into and out of the business.
In 2023, SoundHound’s operating cash flow, representing the cash generated from its core business operations, stood at -$92 million. This figure raises concerns, suggesting that the company’s primary activities failed to generate adequate cash to sustain its operations.
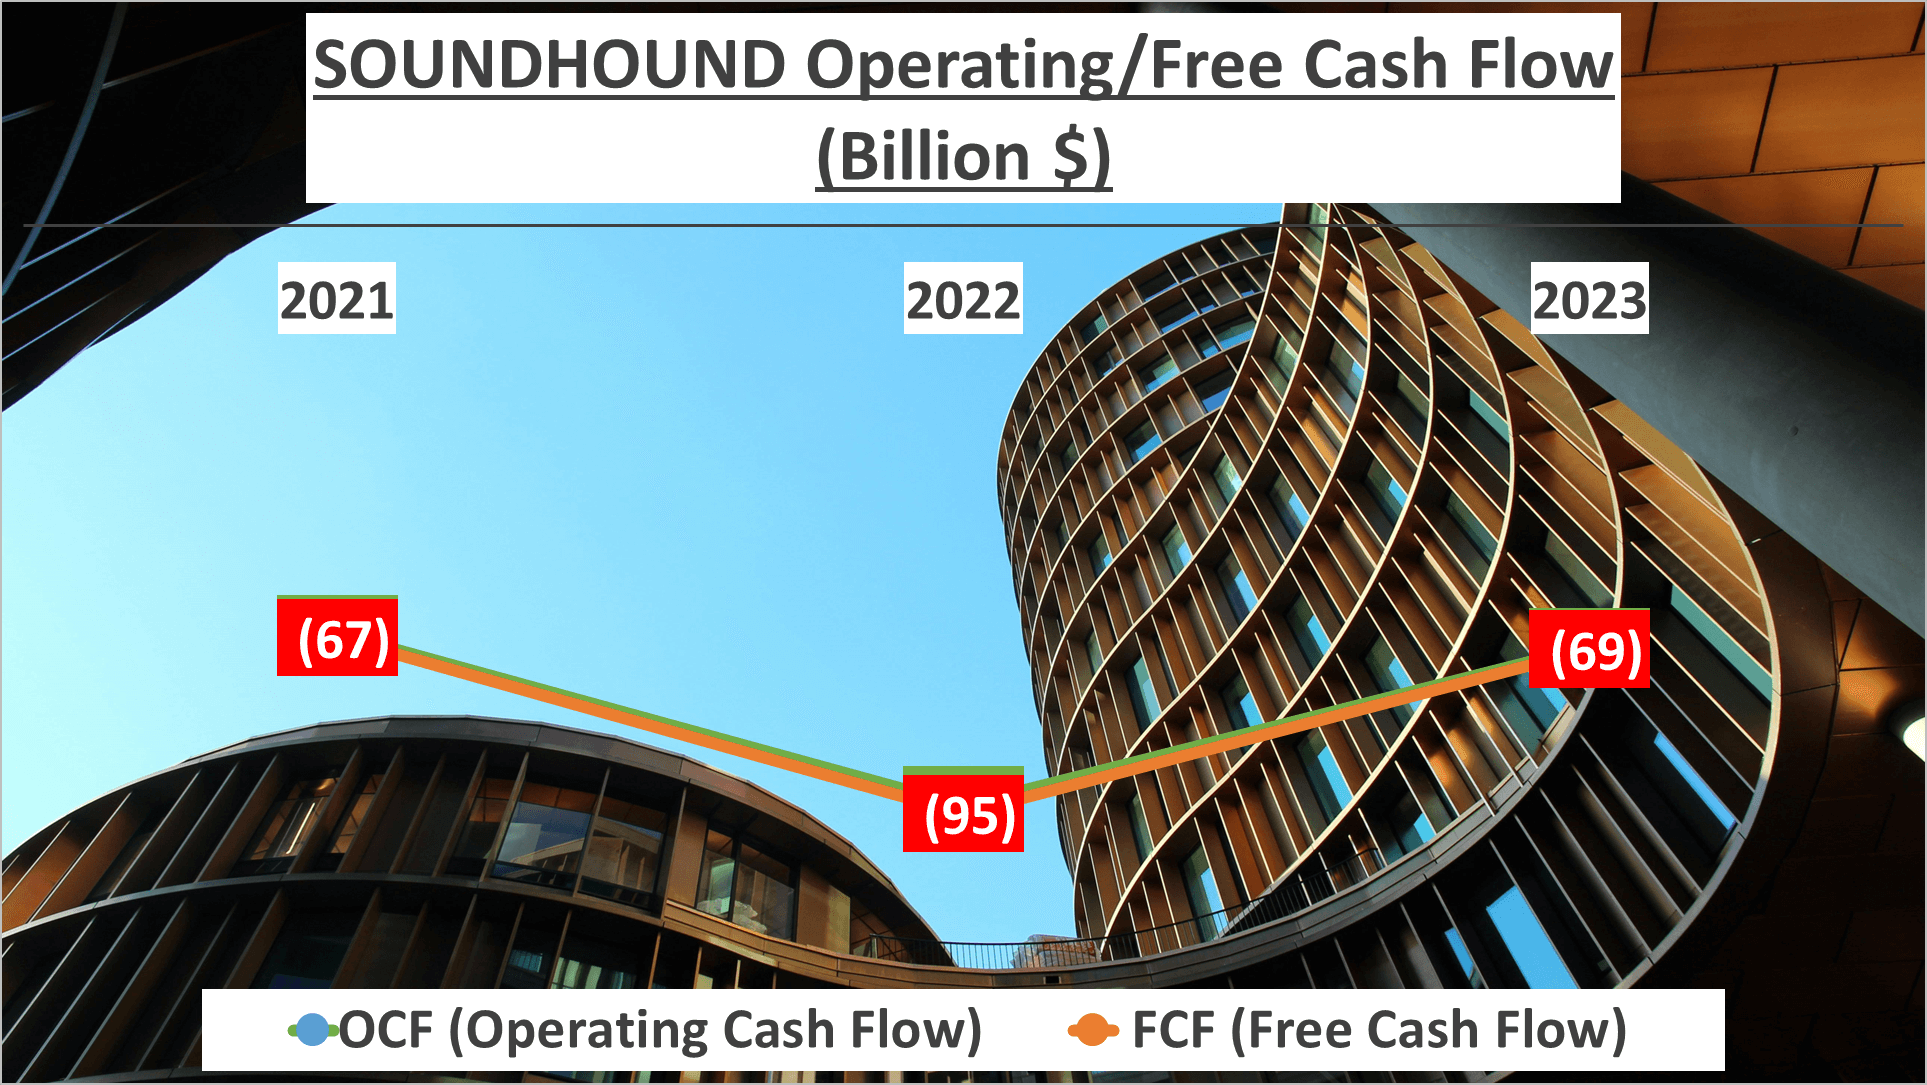
Similarly, examining the free cash flow, which denotes the cash remaining after covering operating expenses and capital investments, reveals a comparable trend. SoundHound’s free cash flow was also negative, totaling -$69 million. This implies that the company struggled to generate surplus cash to pursue initiatives aimed at enhancing shareholder value.
Nevertheless, it’s noteworthy that these figures indicate an improvement compared to 2022 when both operating cash flow and free cash flow were significantly more negative, at -$117 million and -$95 million, respectively.
These statistics highlight that while SoundHound’s cash flow remained negative in 2023, there has been a positive trend. However, a negative cash flow remains a concern, indicating that the company’s financial stability is not yet firmly established.
While SoundHound’s negative cash flow warrants attention, let’s broaden our perspective and consider the broader context.
Dupont Analysis – SoundHound Stock Analysis
Now, let’s delve into a Dupont analysis of SoundHound, a financial ratio used to assess a company’s capability to enhance its Return on Equity (ROE). ROE is a pivotal metric of financial performance, computed by dividing net income by shareholders’ equity, indicating a company’s profitability concerning stockholders’ equity.
ROE comprises three key components: Net Profit Margin, Asset Turnover, and Equity Multiplier. Let’s dissect each of these elements.
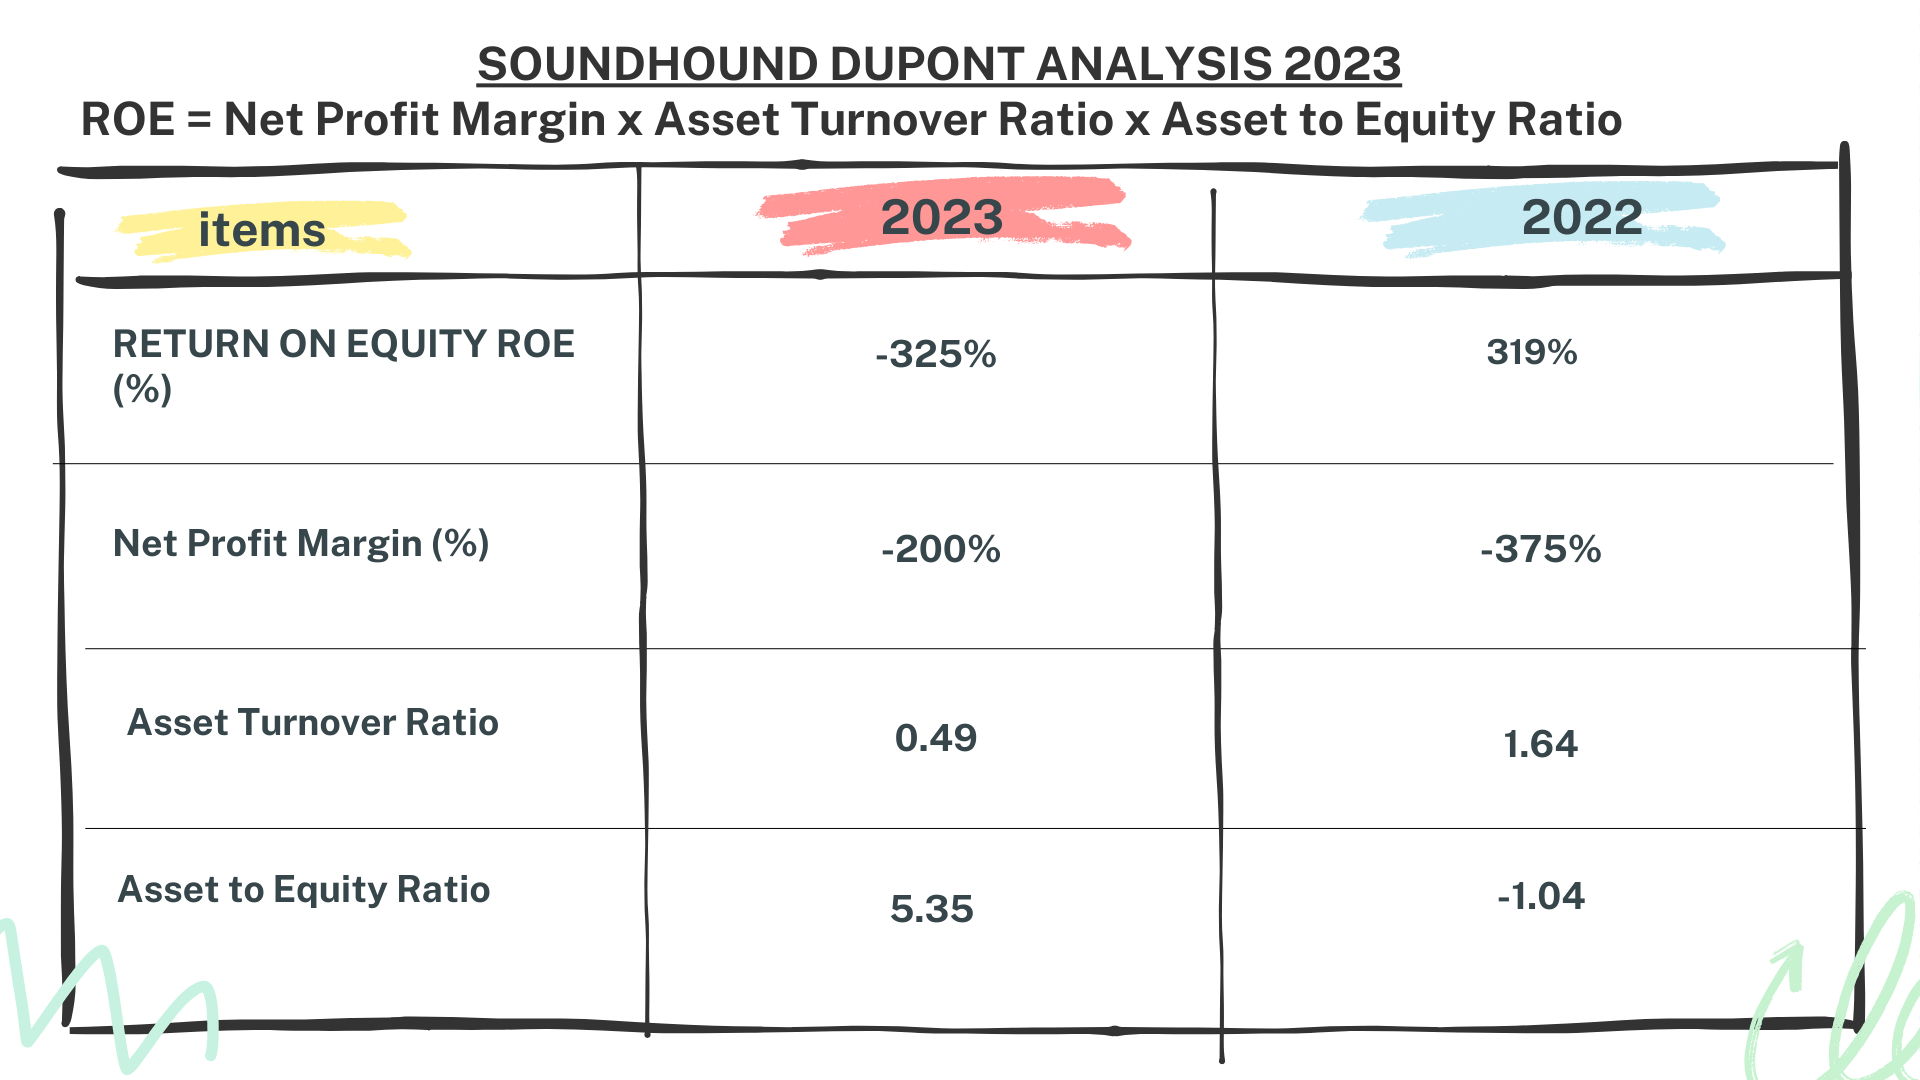
Net Profit Margin elucidates the proportion of each earned dollar converted into profits. In 2023, SoundHound exhibited a Net Profit Margin of -200%. Despite appearing alarming, it’s imperative to acknowledge SoundHound’s substantial investments in Research and Development, leading to escalated expenses and depressed net profit margins in the short term.
Moving on to the Asset Turnover ratio, it gauges how effectively a company utilizes its assets to generate sales. For SoundHound, the Asset Turnover in 2023 was 0.49, indicating that for every dollar of assets, SoundHound generated approximately $0.49 in sales.
Lastly, let’s scrutinize the Equity Multiplier, delineating a company’s financial leverage. SoundHound’s Equity Multiplier in 2023 stood at 5.35, signifying a penchant for financing its assets through debt rather than equity.
While SoundHound’s performance exhibits promise, there remain areas necessitating refinement.
Conclusion – SoundHound Stock Analysis
To conclude, let’s revisit our initial inquiry. If you had invested $1000 in SoundHound in 2022, by March 2024, your investment would have surged by 119% to $2187.

This remarkable growth can be chiefly attributed to SoundHound’s robust revenue expansion, fueled by diversified revenue streams and global reach.
Despite negative net profit margins, largely stemming from substantial investments in research and development, and sales, general, and administrative expenses, there are promising indicators of enhancement.
The diminishing losses and bolstered liquidity position indicate a hopeful trajectory, potentially leading to positive net profit margins in the future.
However, negative cash flows and a notably negative return on equity raise concerns necessitating vigilant monitoring.
Stay tuned for more insightful financial analyses, and remember to subscribe and share your suggestions for the next company you’d like us to analyze.
Author: investforcus.com
Follow us on Youtube: The Investors Community

