Visa vs MasterCard Stock Analysis – Are you pondering which investment holds greater potential: Visa or MasterCard?
In the realm of finance, Visa and MasterCard, the titans of payment services, have perennially captured investors’ attention. With remarkable histories, they present captivating opportunities for potential investors.
This video endeavors to furnish a thorough analysis of their financial performance, juxtaposing essential metrics and indicators. Join us as we delve into the financial prowess of these industry giants.
Financial Performance Overview – Visa vs MasterCard Stock Analysis
Let’s commence by scrutinizing the total revenues of both companies. In 2023, Visa’s total revenue soared to $33B, while MasterCard’s reached $25B.
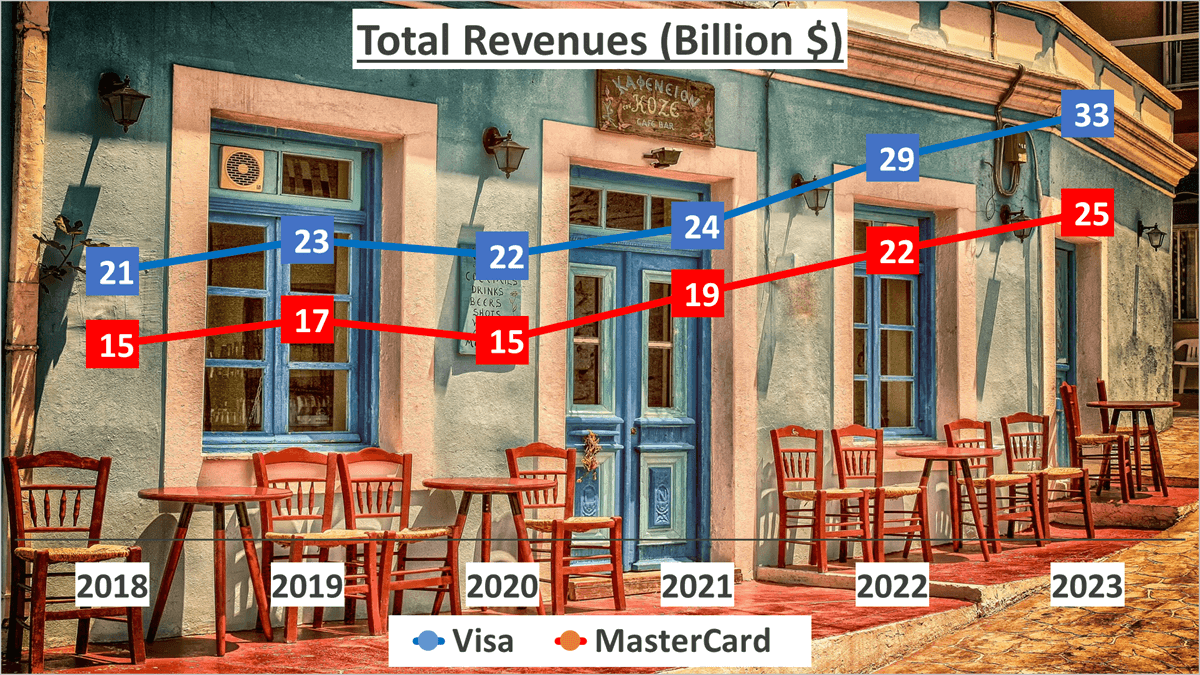
Comparing these figures to 2018, Visa’s revenue has grown at a Compound Annual Growth Rate (CAGR) of 10% over the past five years, whereas MasterCard’s has grown at a CAGR of 11% over the same period. This indicates a consistent growth trajectory for both entities.
Now, let’s dissect these revenues further.
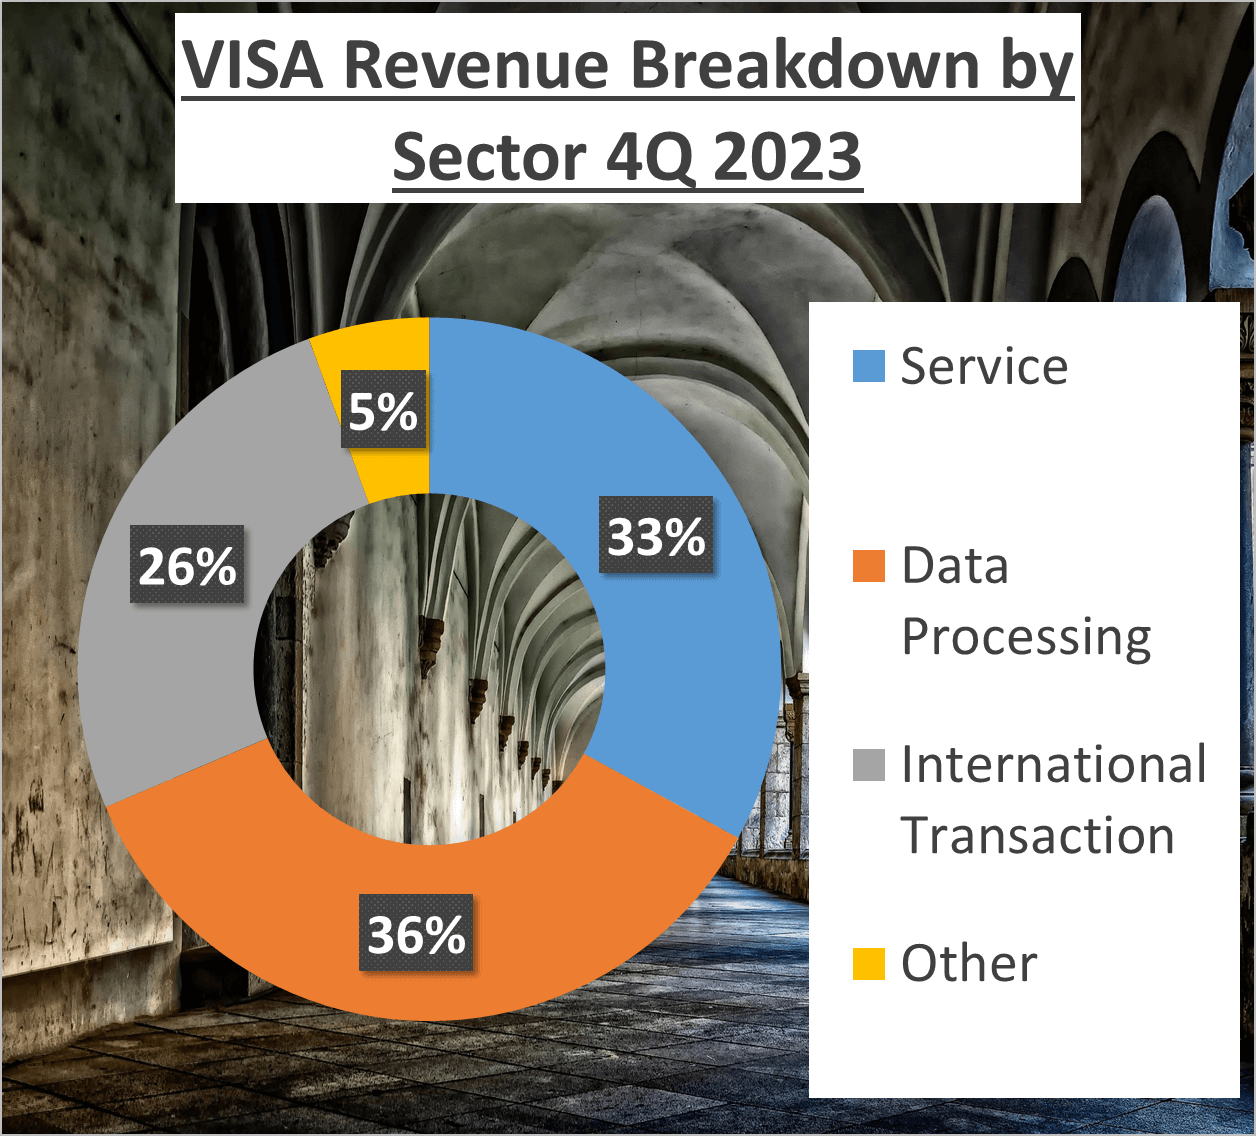
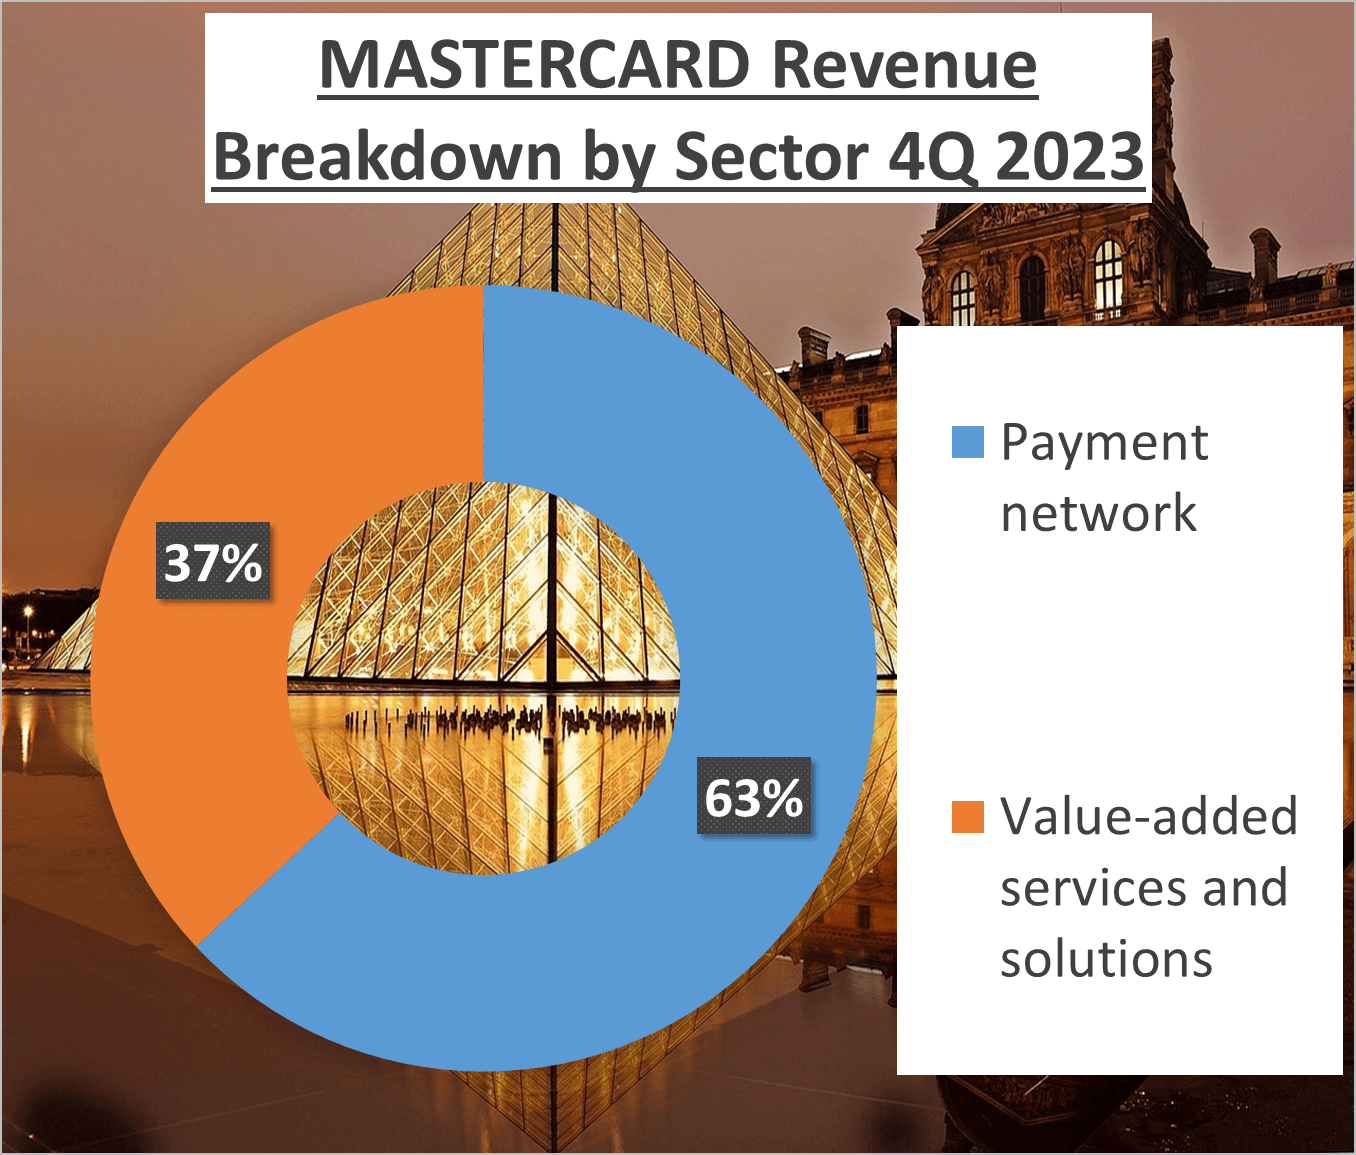
Visa’s revenue breakdown reveals that 33% is attributed to services, 36% to data processing, 26% to international transactions, with the remaining 6% from miscellaneous sources. Conversely, MasterCard’s revenue is predominantly derived from its payment network, comprising 63%, while the remaining 37% is from value-added services and solutions.
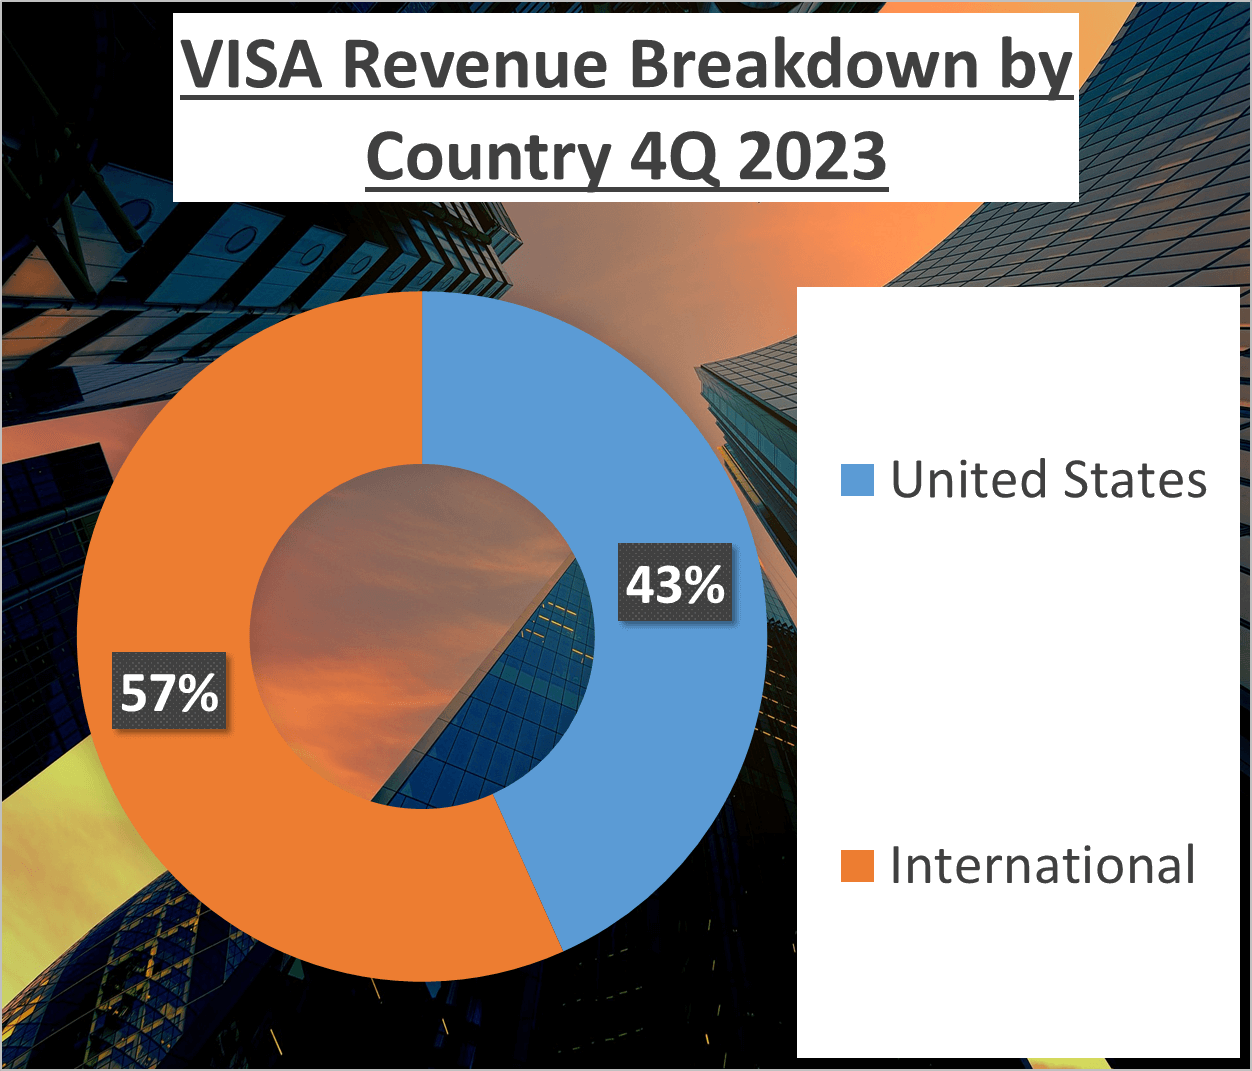
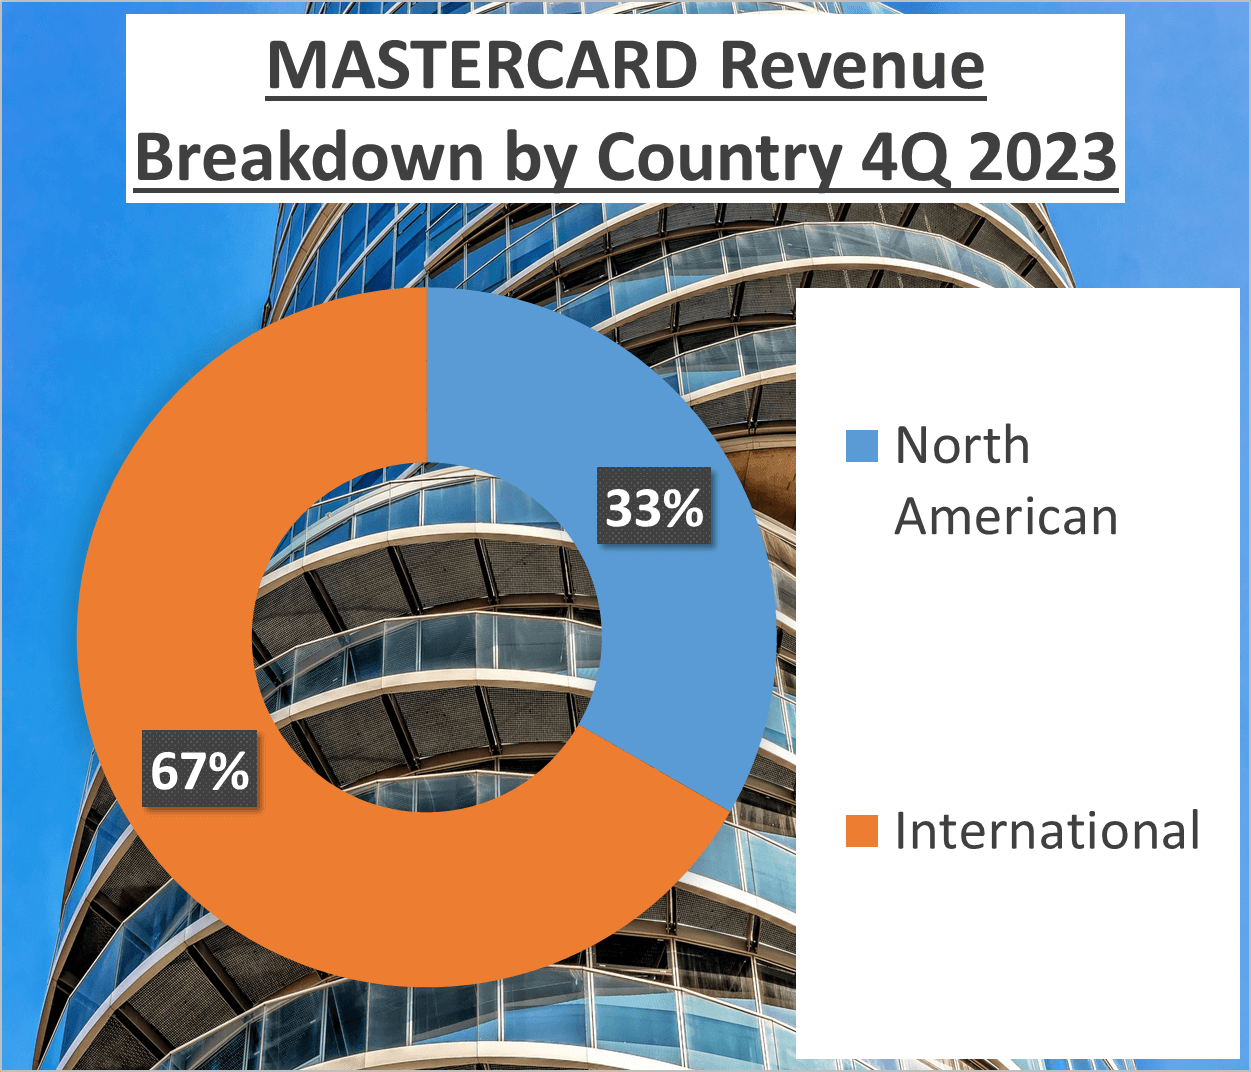
Geographically, Visa garners 43% of its revenue from the United States and the remaining 57% internationally. In contrast, MasterCard earns 33% of its revenue from North America and 67% internationally.
However, revenues only tell part of the story. Let’s also assess profit margins.
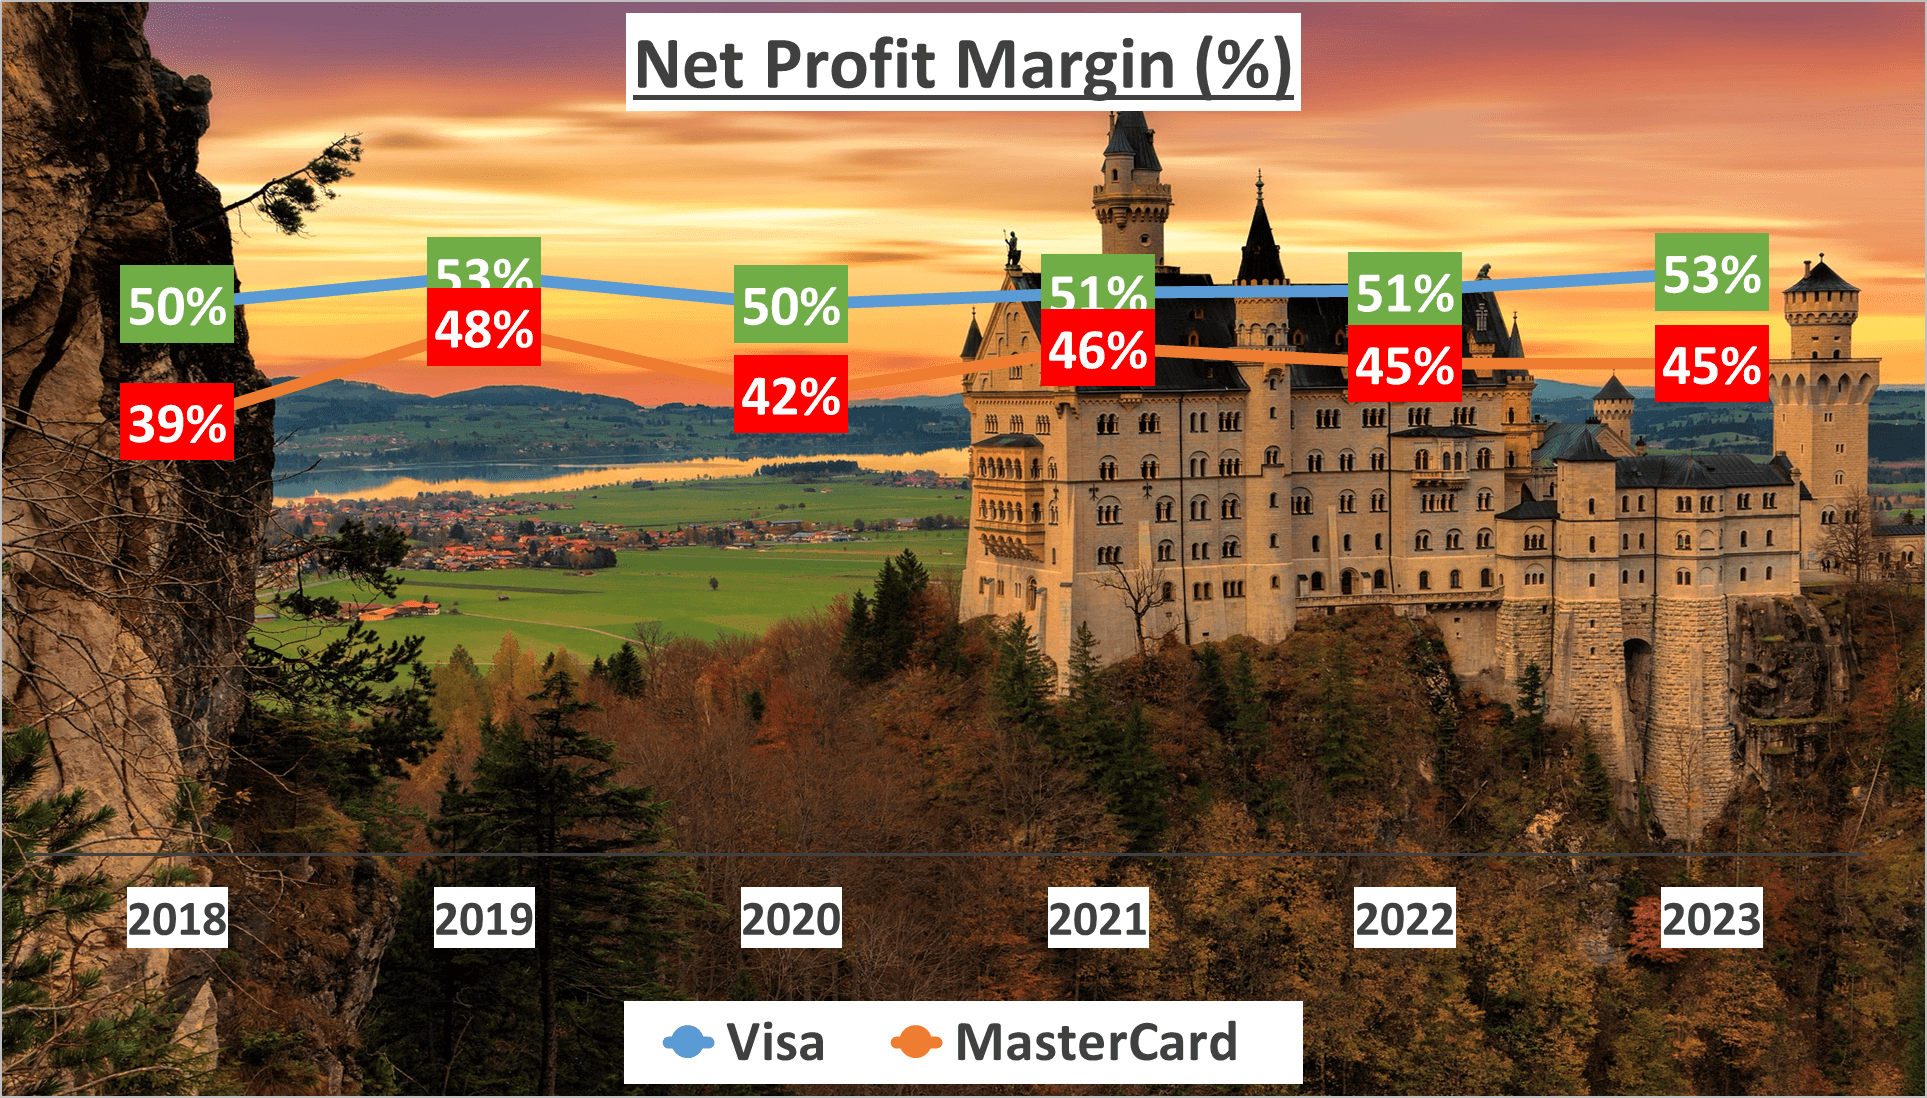
In 2023, Visa boasted a net profit margin of 53%, slightly surpassing its five-year average of 51%. In contrast, MasterCard recorded a net profit margin of 45%, also slightly above its five-year average of 44%. This indicates that, on average, Visa has been more profitable than MasterCard over the past five years.
In the subsequent section, we’ll delve deeper into the net profits of these financial powerhouses and their growth trajectories over the years. However, it’s crucial to remember that while revenues hold significance, they’re merely one facet of the comprehensive picture.
Net Profits – Visa vs MasterCard Stock Analysis
Net profit, the ultimate earnings figure after deducting all expenses, including taxes, is pivotal in assessing financial performance. Now, let’s delve into the net profits of Visa and MasterCard.
In 2023, Visa’s net profit soared to an impressive $17B, while MasterCard’s net profit reached $11B.

Comparing these figures to 2018, Visa’s net profit has surged at a Compound Annual Growth Rate (CAGR) of 11% over the past five years, whereas MasterCard’s net profit has experienced a slightly higher CAGR of 14% during the same period. This indicates consistent profit escalation for both entities, with MasterCard exhibiting a marginally swifter pace of growth.
Visa’s higher net profit underscores its superior profitability, while MasterCard’s accelerated growth rate hints at its potential for advancement. Now equipped with insights into their profits, let’s shift our focus to their assets.
Assets and Liabilities – Visa vs MasterCard Stock Analysis
A company’s assets and liabilities are crucial indicators of its financial stability, offering valuable insights into its fiscal health.
Let’s closely examine the financial standing of our payment processing giants, Visa and MasterCard, by scrutinizing their total and net assets. As of the end of 2023, Visa boasted total assets amounting to a staggering $90B, more than doubling MasterCard’s $42B.
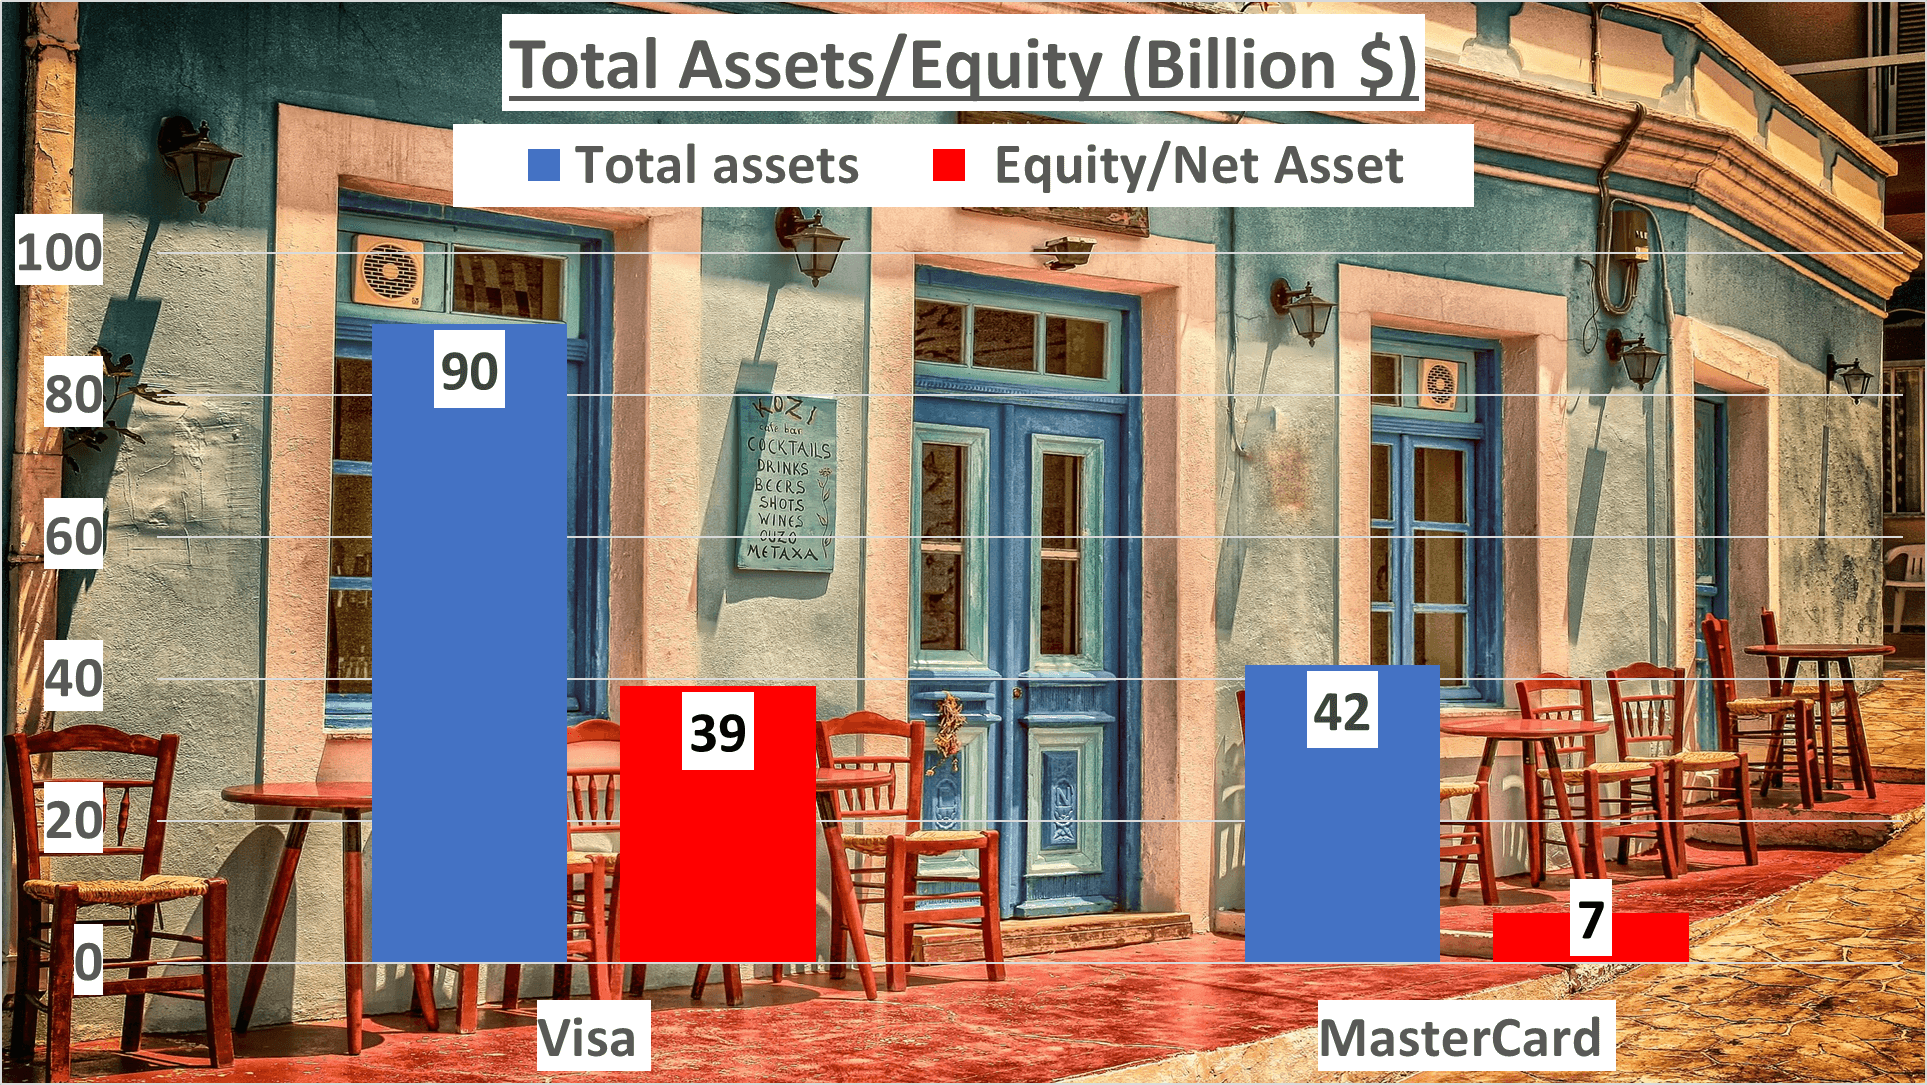
Delving deeper into net assets, we observe a similar pattern. Visa’s net asset value stands at an impressive $39B, whereas MasterCard lags behind at $7B.
Now, when we juxtapose their equity to total assets ratios, an intriguing comparison emerges. Visa maintains an equity to total assets ratio of 43%, indicating a relatively balanced financial structure, with nearly half of its assets being financed by equity. Conversely, MasterCard’s equity to total assets ratio stands at just 16%, signifying a higher reliance on debt, which may raise concerns for potential investors.
Nevertheless, it’s essential to contextualize these ratios within the company’s industry, size, and growth phase. For instance, a company experiencing rapid expansion may exhibit a lower equity to total assets ratio as it leverages debt to fuel growth, a strategy that can be prudent in certain circumstances.
So, what’s the key takeaway here? While Visa appears to hold a stronger financial position with a larger asset base and a higher equity to total assets ratio, MasterCard’s lower ratios might indicate a more aggressive growth strategy, which could yield long-term benefits.
Understanding a company’s assets is pivotal, but so is comprehending its liquidity. As we delve deeper into the financials of Visa and MasterCard, our next focus will be on their liquidity and operational efficiency. Stay tuned for more captivating insights!
Liquidity and Efficiency – Visa vs MasterCard Stock Analysis
Liquidity ratios offer a glimpse into a company’s immediate financial standing. For Visa and MasterCard, these ratios unveil an intriguing narrative. Visa flaunts a current ratio of 1.45, signaling robust capability in covering short-term liabilities.
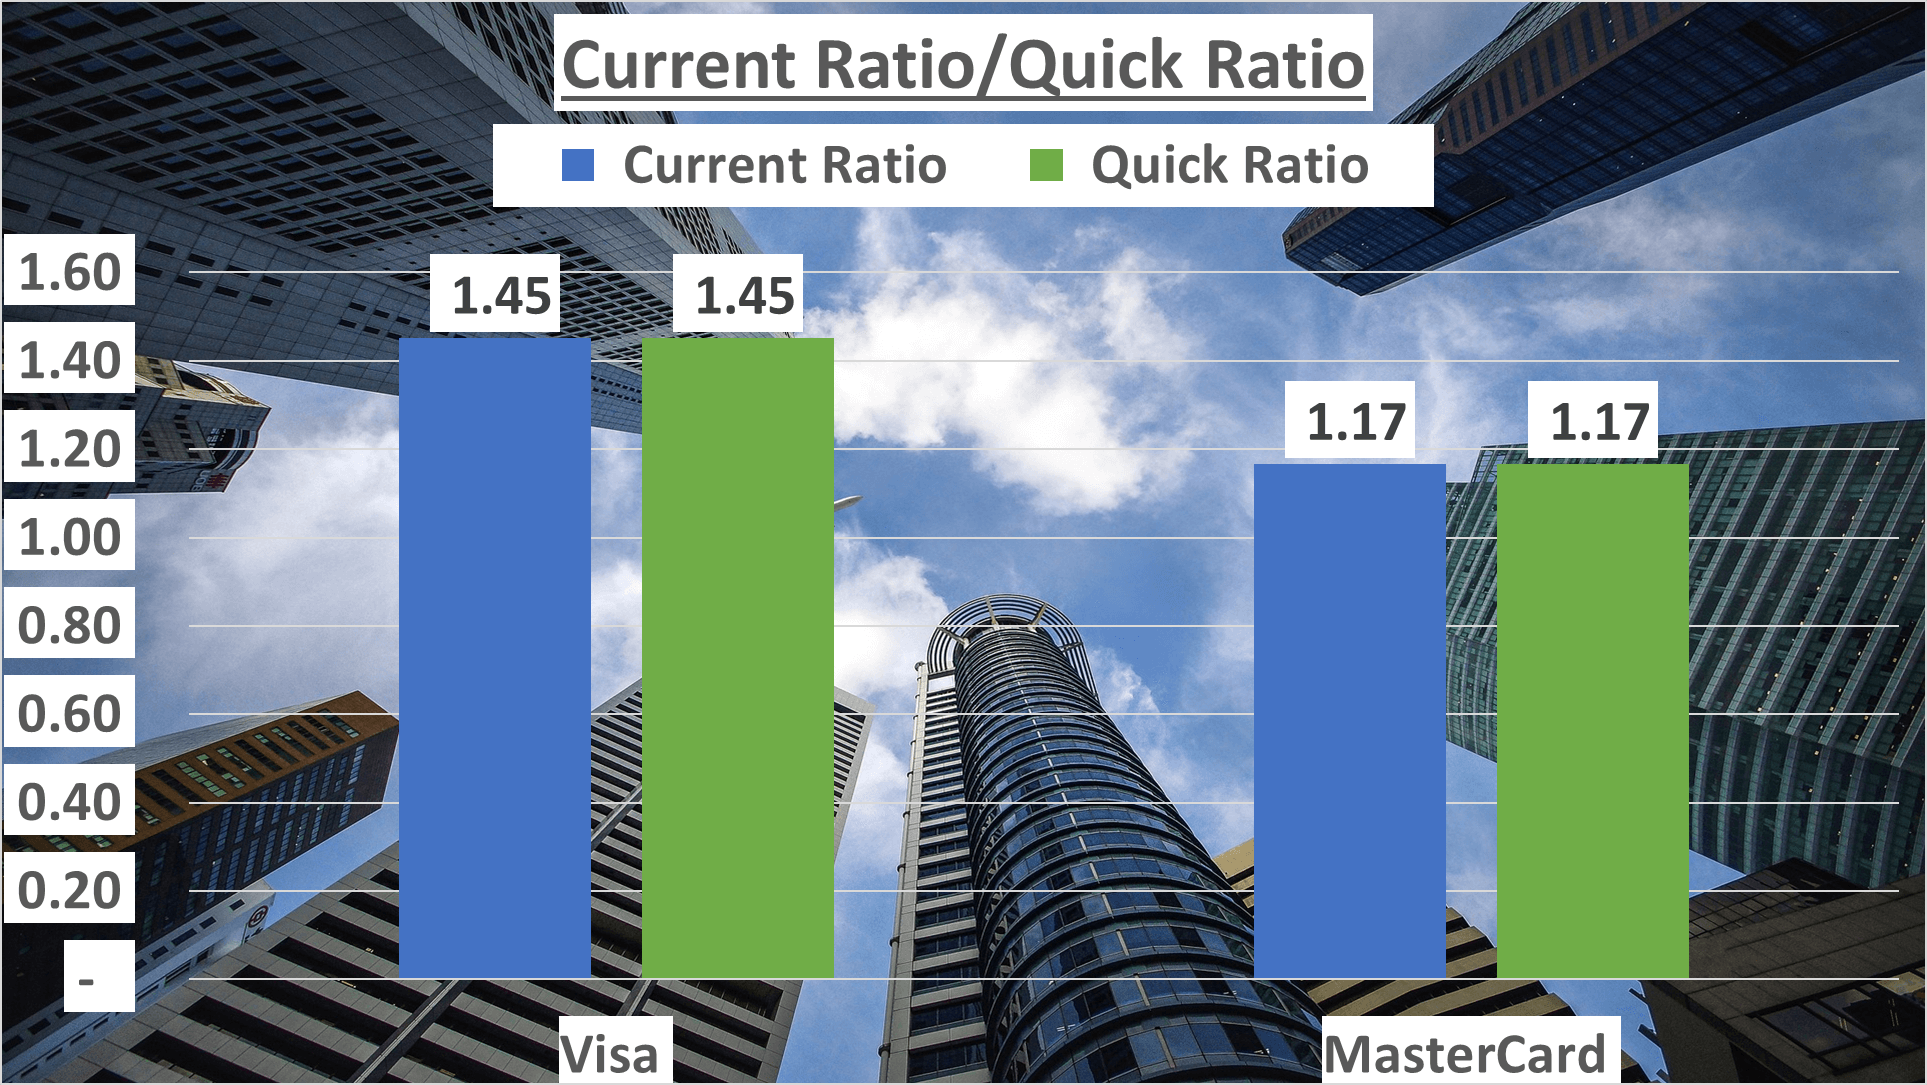
Conversely, MasterCard presents a slightly lower current ratio at 1.17, still reflecting a commendable balance between assets and liabilities.
Now, let’s pivot to operational efficiency, particularly examining receivable days. This metric sheds light on how swiftly a company can retrieve owed payments.
Visa boasts a remarkable 24 days for receivable days, implying that it takes just over three weeks, on average, for Visa to collect its receivables. However, MasterCard lags behind significantly with 54 receivable days, indicating that it takes almost two months for MasterCard to collect what it’s owed.
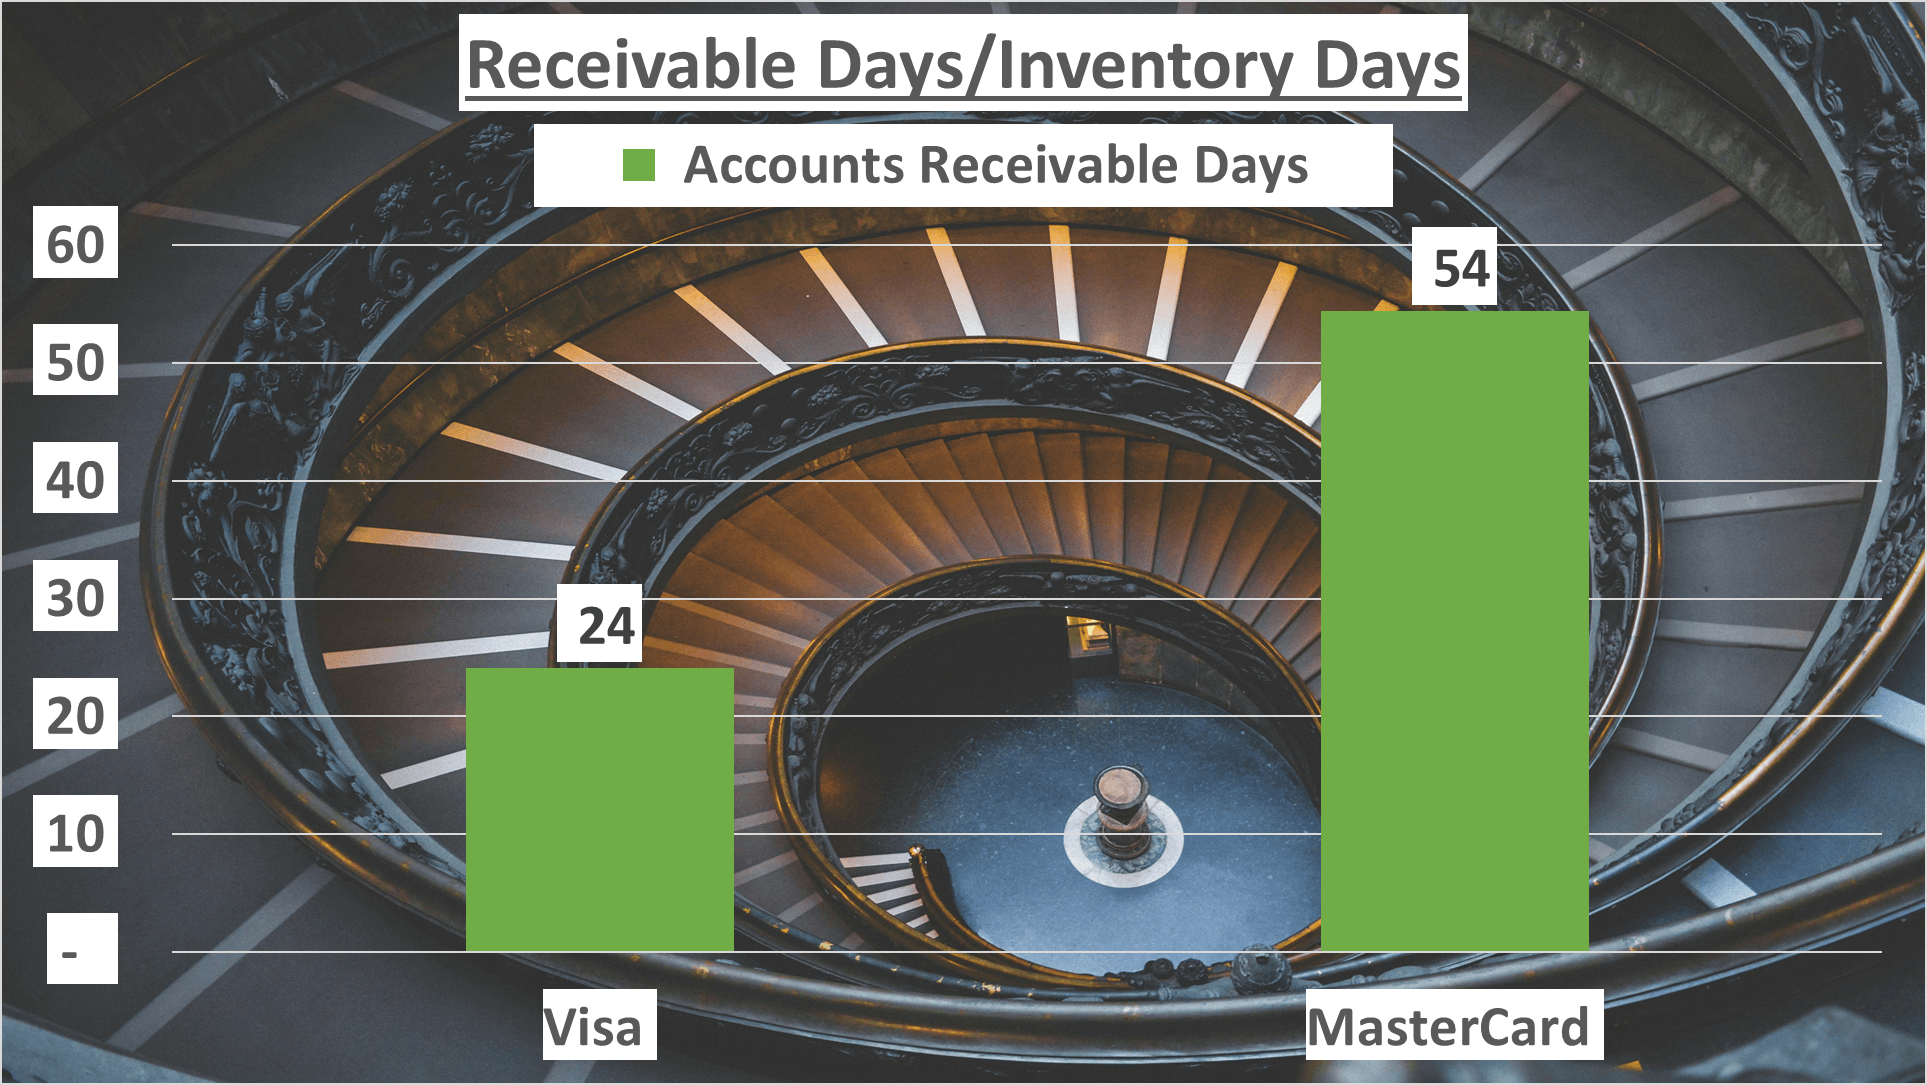
While both companies demonstrate efficiency, Visa clearly holds the advantage here, collecting payments nearly twice as fast as MasterCard. This underscores not only Visa’s operational prowess but also its robust relationships with customers and vendors.
Lastly, let’s delve into how efficiently these companies generate cash. Efficient cash flow generation is pivotal for smooth operations and meeting financial obligations.
Stay tuned for more insights on this in the forthcoming segment.
Cash Flow and Dupont Analysis – Visa vs MasterCard Stock Analysis
Cash flow serves as the lifeblood of any business, sustaining its operations and ensuring its vitality. In 2023, Visa boasted a robust operating cash flow of $21B, whereas MasterCard reported $12B.
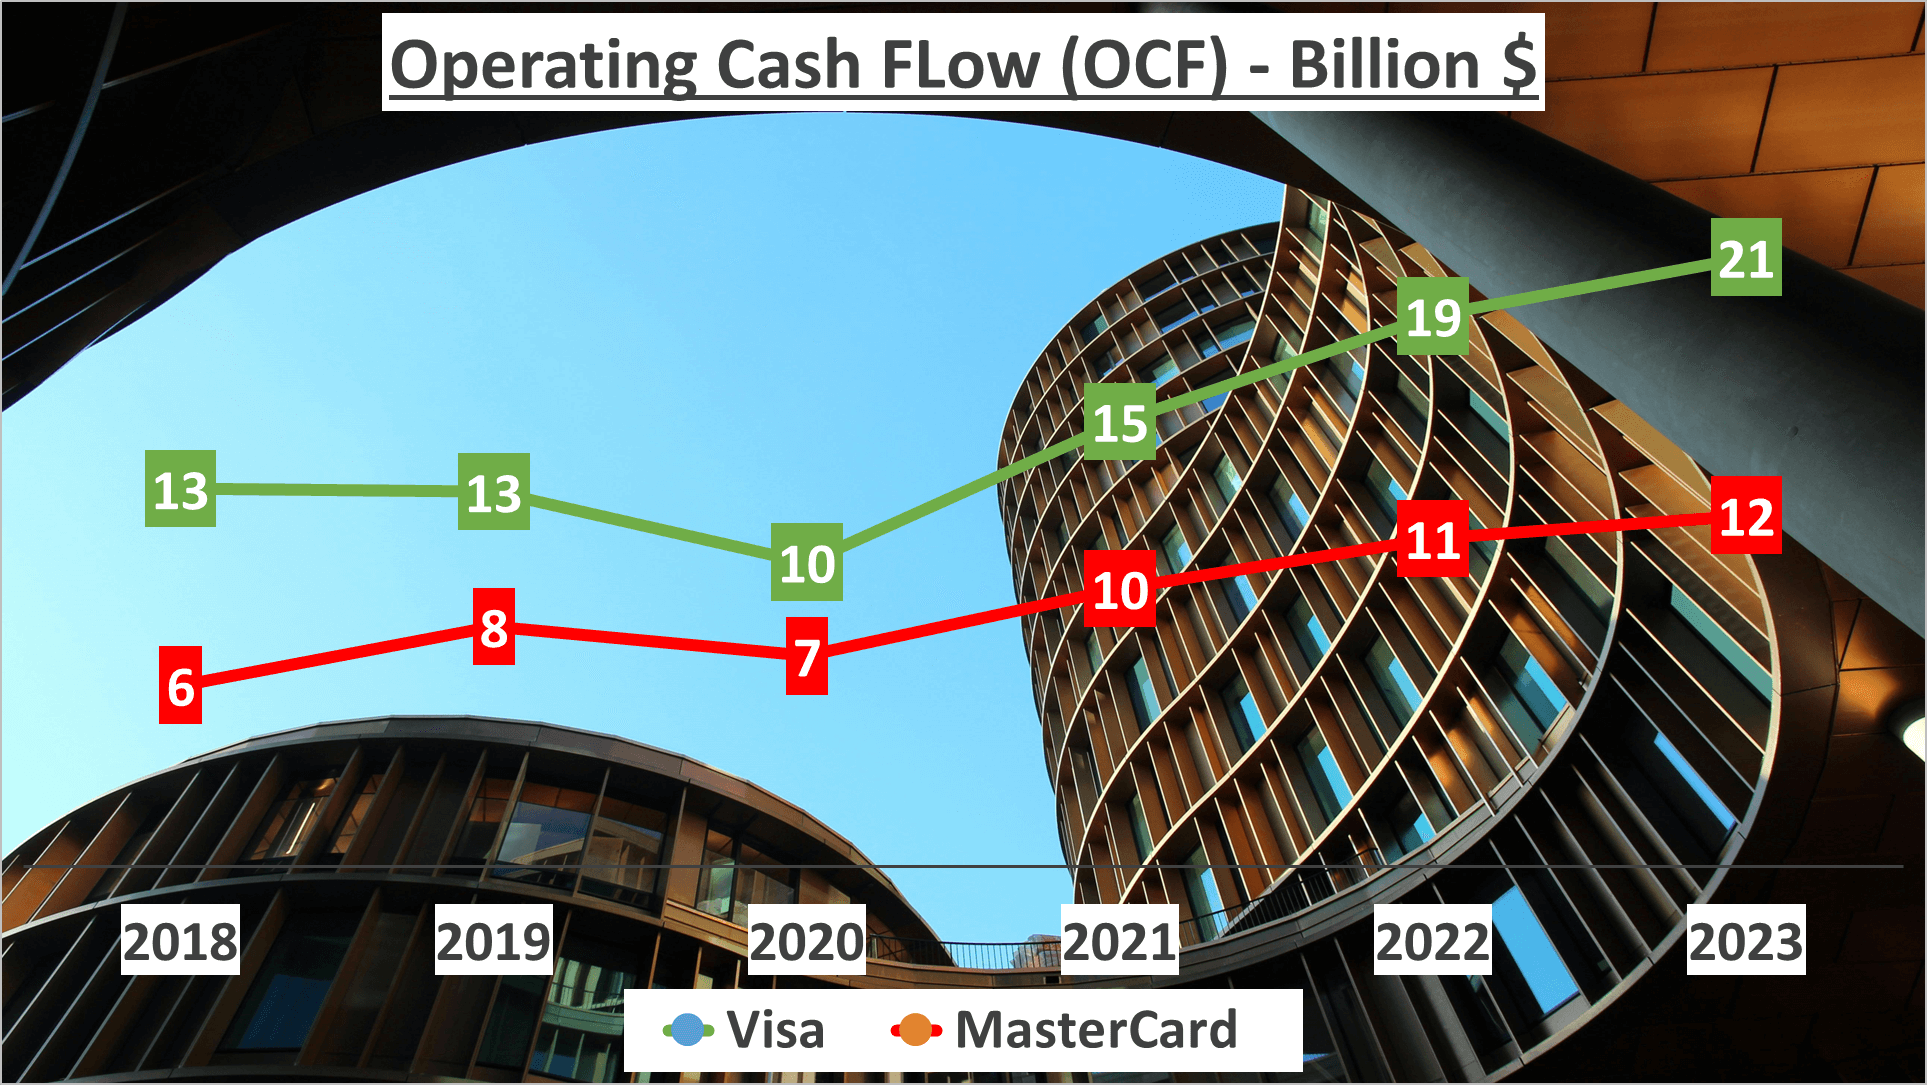
Both companies exhibit strong free cash flow generation as well, with Visa at $20B and MasterCard at $12B.

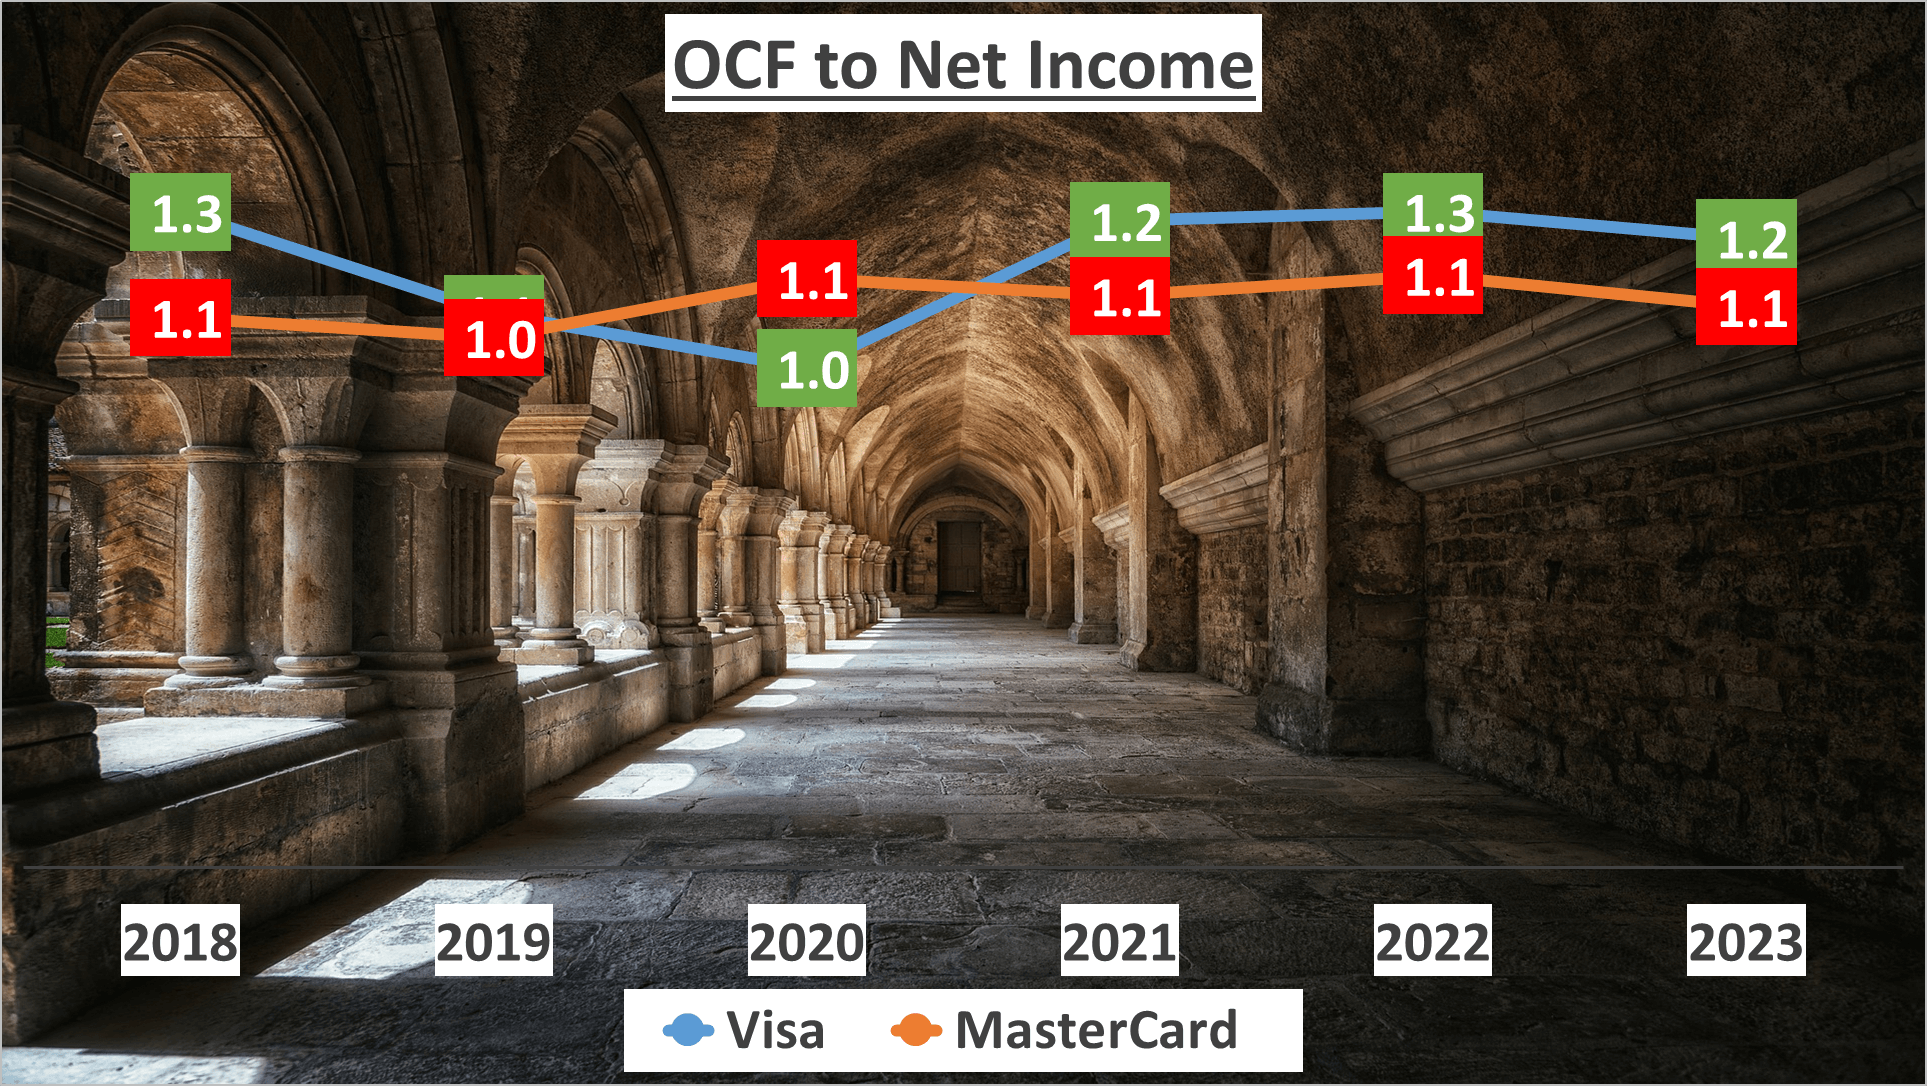
The operating cash flow to net income ratio, a key indicator of the ability to convert profits into cash, stands at 1.2 for Visa and 1.1 for MasterCard, underscoring their operational efficiency.
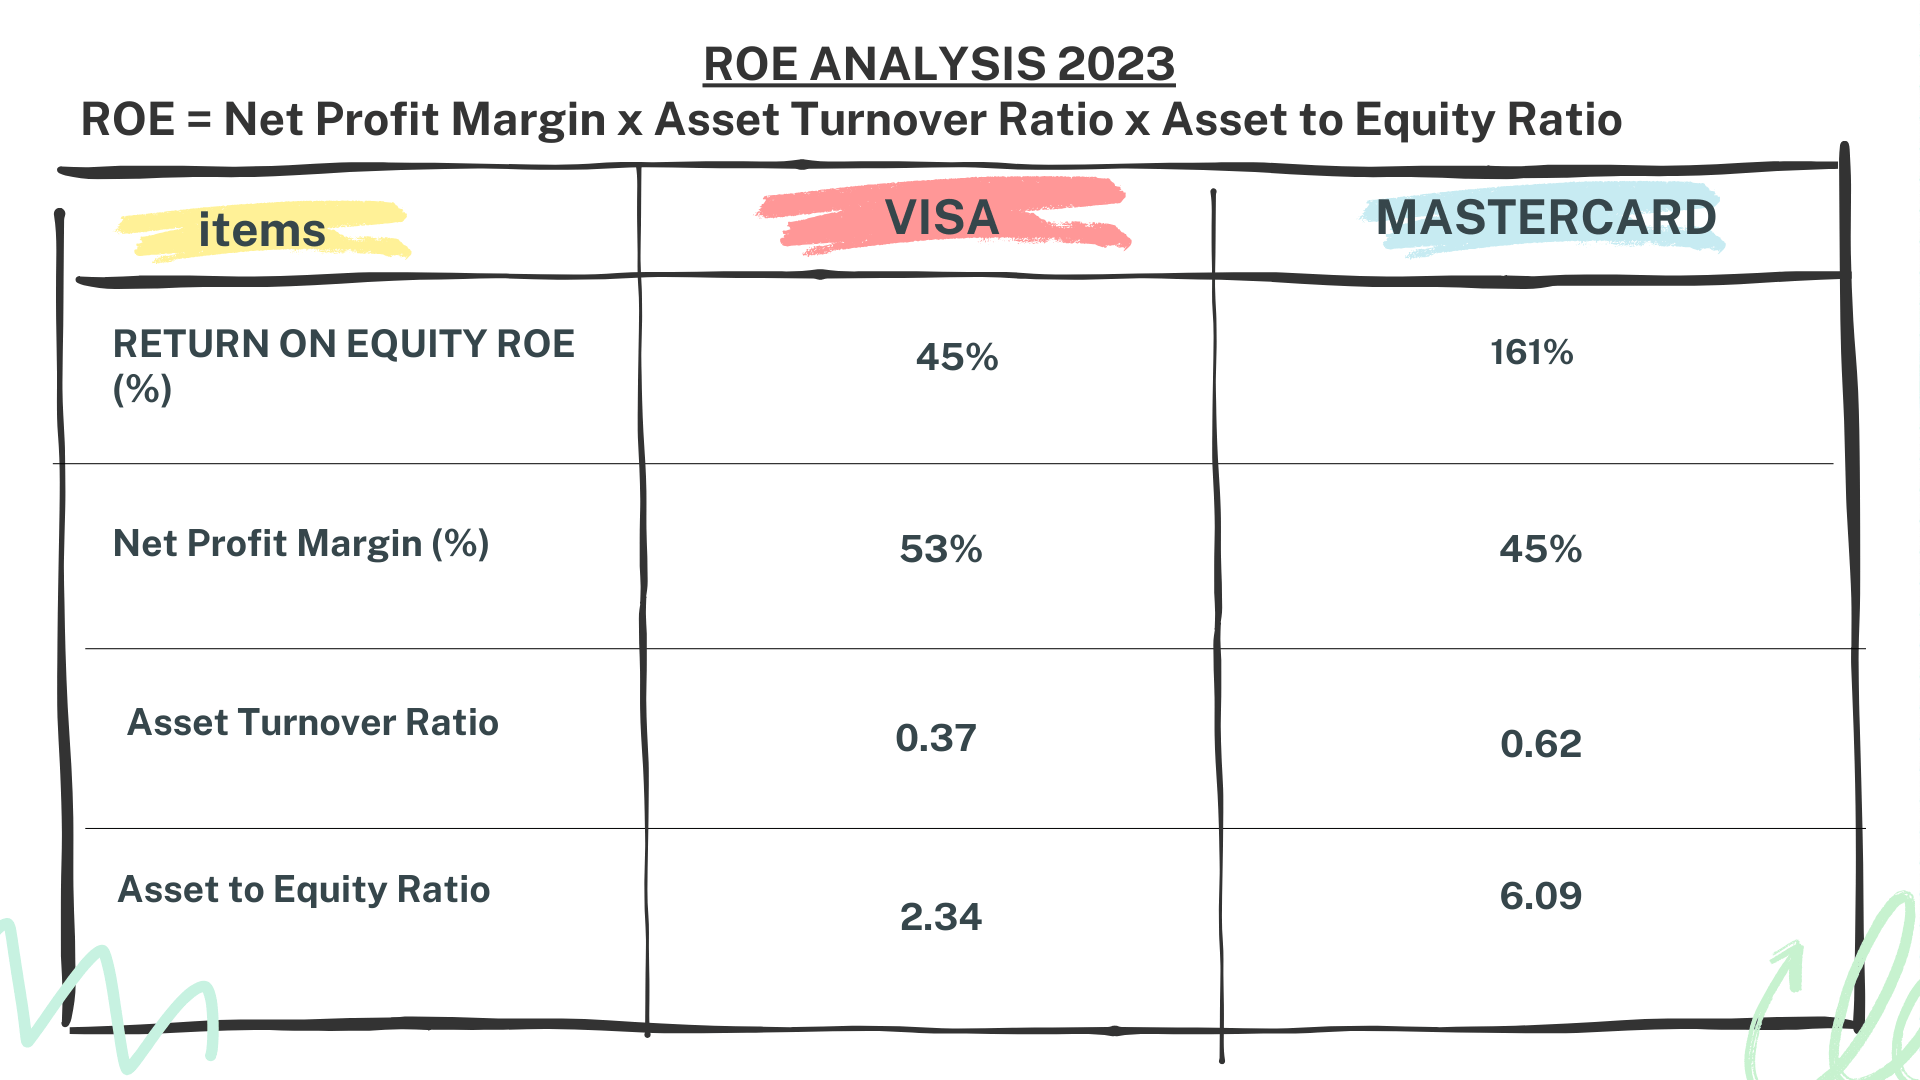
Now, let’s delve into the Dupont analysis, a method dissecting Return on Equity into three components: net profit margin, asset turnover, and leverage.
Despite MasterCard’s lower net profit margin, its higher asset turnover and leverage yield an impressive Return on Equity of 161%, surpassing Visa’s 45%.
As we conclude, it’s essential to remember that investing entails risks, and conducting thorough research is paramount.
Conclusion – Visa vs MasterCard Stock Analysis
Visa and MasterCard stand as formidable giants in the payment industry, each with its unique strengths and weaknesses. Visa shines with its superior net profit margin and efficient receivables collection process, portraying robustness in its operations.
On the contrary, MasterCard impresses with remarkable growth rates and a substantial return on equity, indicating its potential for substantial returns.
The decision between the two titans ultimately hinges on your investment strategy and risk tolerance.
Thank you for your viewership, and be sure to subscribe to our channel for more insightful analyses. Feel free to share in the comments below which companies you’d like us to dissect next.
Author: investforcus.com
Follow us on Youtube: The Investors Community

